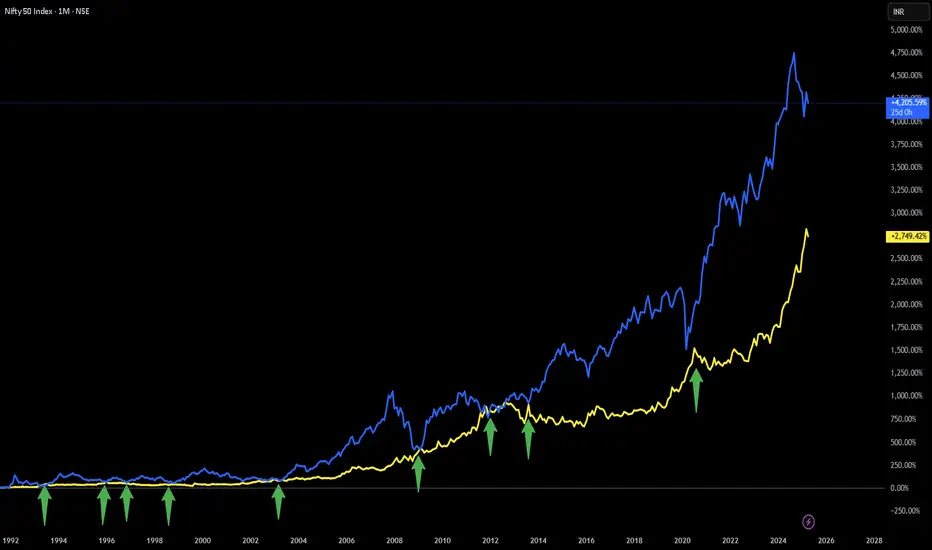
Strange Observation between NIFTY and GOLD...Since August 1, 1991: When ever NIFTY and GOLD return are same NIFTY gives handsome return in coming months.
Good examples of above statement are years 2003, 2009, 2013 and 2020.
Since August 1, 1991: NIFTY has given approx 4200% return and GOLD has given approx 2750% return. Difference in return is approx 1450%.
Going by the above observation either NIFTY has to come down or GOLD has to go up (or both) for NIFTY to give handsome return.
NOTE: This is just a strange observation/correlation.
Disclaimer: This is for demonstration and educational purpose only. This is not buying or selling recommendations. I am not SEBI registered. Please consult your financial advisor before taking any trade.
#nifty#index
#Nifty Weekly Outlook – Cup & Handle in Focus!CMP: 25,285
Primary Trend: Uptrend (Bullish Bias)
🔽 Support Zones
• 25154 – 25084
• 24858 – 24768
• 24588 (Major swing support)
🔼 Resistance Zones
• Immediate Resistance: 25424 – 25449
• Next Hurdles: 25638 – 25669
• Key Breakout Level: 26179 – 26277.35 (ATH)
Pattern: Cup & Handle ☕️
A classic Cup & Handle pattern is forming on the weekly timeframe , following a strong uptrend, which is a bullish continuation setup.
• 🧭 Neckline breakout (sloping white trendline) is the key trigger.
• 🎯 Target Projection: ~29,500 (~16% upside potential post-breakout)
🔒 Pattern Invalidation Level
• Weekly close below 24,337 negates the pattern.
⏳ Awaiting Breakout Confirmation
• A weekly close above the neckline with solid volume will confirm the breakout .
• Until then, price remains in a healthy consolidation.
✅ Dips into support zones can be used for positioning, with proper risk management.
#Nifty | #Nifty50 | #CupAndHandle | #ChartPatterns | #SwingTrading | #PriceAction
📌 Disclaimer: This analysis is shared for educational purposes only. It is not a buy/sell recommendation. Please do your own research before making any trading decisions.

Nifty (is this last hope for buyers?)nifty last hope for buyers it looks more denger if hold below 23300 then it can be gone to hell
FII already sold most of things as seen on fii data
in chart can seen from ab=cd nifty short runninf from top then h & s pattern done and breakdoen and it has been completed the 1:1 tg of h&s ,
now nifty create bat harmonic pattern @ bottom with trendline support
ACCORDING TO NIFTY SPOT can reverse from the area first 23700-680 area second 23380
it ve very strong support and last hope 23200 below closing
FOR SAFE SIDE WE CAN PLAN TO BUY ABOVE 23891 WITH CLOSING SL 23500 AND TARGETS 24300-24700-25600
trailing stoploss metod can use in this
do not work without stoploss
nifty pe ratio 21.3

Nifty 50 Gap fill doneNifty 50 Gap fill done. 23900 is important support.
Index under pressure due to IT Sector.
DXY has cooled off.

Nifty Potential Support ZoneNifty has pulled back after hitting a new all-time high. I've identified a support zone using Fibonacci levels. I believe this zone can serve as a strong support for Nifty. Let's see what happens next.

Long view on NIFTYPlease do your own research before trading or investing. I am not a SEBI Reg. Analayst.

Banknifty Analysis on bigger time frameBanknifty as per my setup looks good in buying i always calculated risk then enter always after consulting with your financial advisor

Risk Management trade in Reliance.Hi there!
Let's talk about this small trade in Reliance.
Reliance CMP:- 2524.05
-->From 30th sep to 1st Dec Reliance has formed HH and HL and was in Uptrend .
-->Since then Price is in correction and approached 0.618 Fib level of that up wave.
What's in my mind?
-->If we observe the price action there is an untested demand zone at this 0.618 Fib area.
-->If we observe the upper 2 arrows those mentioned candles and and their volumes saying that there was some distribution happened may be reason for this correction
-->If we observe the bottom arrow that mentioned red candle with high volume is a support breakdow n and may be the stop losses of previous long trades
What's my point?
-->Even if price continues to move down I'm expecting a pull back before that and this Idea is actually trading that pull back.
-->If my analysis goes wrong and price breaches this demand area I will exit with my stop loss and enter at next demand areas with new confirmations.
Entry setup:
Enter Long: 2480
Stop Loss : 2425 (70 rupees per share and one can plan their risk accordingly)
Managing the trade:
If the trade goes in our way
*Exit half Quantity @1:1 Risk/Reward Target and Shift to SL to cost
*Exit Half of the remaining with 1:1.5 or 1:2 Risk/Reward (by looking at momentum) and trail the SL.
*Exit remaining with trailing Stop loss.
*SECURING THE TRADE AND PROTECTING THE CAPITAL SHOULD BE YOUR FIRST PRIORITY.
*NOT A SUGGESTION VIEWS ARE FOR EDUCATIONAL PURPOSES
***If you like my analysis let me know by giving boost or a comment.
I will be updating.


NIFTY Pre Market Analysis 17/10/2022 E3Good Morning everyone,
Keeping SGX Nifty in mind (17070 levels) Lets say Nifty will have a gap down of approx. 100 points
-->Nifty will try to open @ 17060-70 levels
-->We will be almost opening near support zone.
--> Unless it breakdown 17000 level on stays there for min 15 mins there shouldn't be any shorting .
-->After opening,
--> If market shows bullishness like 5 Min range breakout/15 min narrow range breakout then we can go long with Stop losses below the range.
-->Targets would be as mentioned on chart.
-->After opening,
--> If market goes to test 17000 level (good demand zone) ,Here wait with patience if market shows bullishness(forming bullish candles or
breaking previous highs on 5m TF) then we can go long with SL placed below 16950 and the Targets would be same as mentioned on the
chart.
*SECURING THE TRADE AND PROTECTING THE CAPITAL SHOULD BE YOUR FIRST PRIORITY.
*NOT A SUGGESTION VIEWS ARE FOR EDUCATIONAL PURPOSES.
If you think video analysis will be good for better understanding & If you want me to do video analysis pls give a boost. If I can get 2000 boosts overall on my profile I will start doing video analysis. Need motivation very badly. Expecting as low as 10 follows for this work 🙏🙏🙏.

NIFTY PRE MARKET ANALYSIS 11/10/2022Good morning,
All the levels and key ideas mentioned on the chart itself.
When the market opens today wait for confirmations. Don't take random trades with high SL's.
Yesterday I read something like major institutions are short on market. So keep that in mind
-->No trade until nifty touches any of the two lines (17280) on the upside and (17140) on the down side.
-->Suppose say it is near 17140 what should be your plan of action?
-->Mainly two outcomes are possible, market breaking that level market taking support from that level.(Be Aware of false breakouts also)
-->Go to 5min time frame and look at price action near that support line.
-->Big green candles, breaking previous lower highs will be signs of intraday reversal then you can plan buying with day high levels as targets
-->Breaking that 17140 levels with Big red candles and staying for more than 15 mins there will be signs of falling then we can short market there.
-->Same logic applies when the market is at 17280 levels.
-->Keep small SL's
*SECURING THE TRADE AND PROTECTING THE CAPITAL SHOULD BE YOUR FIRST PRIORITY.
*NOT A SUGGESTION VIEWS ARE FOR EDUCATIONAL PURPOSES.

Will there be an Upmove in Nifty on Monday? Hi there,
I trying to understand and predict the market movement based on crowd mentality.
First I will try to explain my theory on what might have happened (It may not be the case).
GREEN ECLLIPSE @ 16800 LEVEL
--> Price was at the demand zone ,started moving up and at the EOD Nifty was at 17100
OBSERVATION:
-->Most people must have carried longs for the next day.
Next day Nifty opened flat and started going down in the first hour.
OBSERVATION:
People who were long the previous day will be in confusion now might have started exiting their positions (they will be booking losses also if needed)
So by the EOD on 03/10/2022 there are
-->People who shorted the markets freshly will be carrying their trades.
-->Do you think retailers will be carrying longs this day ? (My opinion is very little)
Date:04/10/2022
-->BOOM !! whoever shorted are now trapped, aren't they ?
-->As usual short covering happened and all the bulls started taking positions this day only.(Fresh positions)
Date:06/10/2022 (Expiry day)
Price is at supply zone and in the second half price gave confirmation and came down. So here again every one will be carrying shorts overnight.
--> Next day If we observe price made a V pettern and it went up. Mostly every bear booked their positions and bulls took charge.
-->By EOD everything has changed and suddenly people started carrying longs for the weekend thinking that bulls are strong (Nothing wrong).
HOLA ...SGX at 17070 all of a sudden. All my analysis from now will be if market opens at these levels.
--> Who are more for monday morning ?
a) Those who carried longs booking their losses and exiting their positions or
b)Those who carried shorts and exiting their positions with profits?
I think (a)>>>(b).
And most importantly market will be at its demand zone (opening price is in the FIB extension area of the recent trend)
So any of the above options (a)/(b) happens there will be a retracement wave causing the market to move upside.
I'm expecting retracement wave till 17170 to 17200 levels.
After that there may be fresh shorting of market because actually most of us not benefited from this gap down or bulls might take charge again .
For any of this to happen we will need more confirmations and we will see them in future.
--> I have drawn all the levels here based on Elliott waves & by using Fib tools
In short on Monday first look for any strong bullish candles or confirmation. Take long positions
Try to avoid shorting unless if there is a retracement.
Mostly I will post analysis in 15m time frame for intraday buy/sell Ideas. Follow me If you don't want to miss any updates.
Please let me know if you have liked my analysis with a boost or a comment.
*SECURING THE TRADE AND PROTECTING THE CAPITAL SHOULD BE YOUR FIRST PRIORITY.
*NOT A SUGGESTION VIEWS ARE FOR EDUCATIONAL PURPOSES

MONTHLY STRADDLE IN NIFTY FOR OCTOBER Hi there,
Nifty Closing today 29/09/2022 : 16818 spot
Since last 3 weeks if we observe Nifty movement there is lot of selling pressure.
From the recent high of 18096 levels Nifty has declined almost 7.5%.
In the chart if you observe I have drawn a primary wave .It looks like we are in the wave 2 of that Elliott wave.
wave 2 will be mostly 3-3-3 or 5-3-5 corrective wave.
In this WXY corrective wave W is 0.318 Fib retracement of wave 1.So there is higher probability that we will find some support in this area.
X point is 0.618 Fib retracement of wave W
Considering the recent aggressive selling those who missed the bus will short the market again or take fresh positions when the retracement wave happens.
SO WHY MONTHLY STRADDLE?
There will be 4 weekly candles in the October series.
So even this weeks candle engulfs the latest red candle by oct 6 expiry or after that expiry market will be facing resistance at X area.
If people start shorting the market fresh then high chance that market will go to Y area to complete the correction wave .
In this process mostly after 3 weeks we can see the market in these levels again with most of the price decay.
What if Nifty breaks W area this week without taking support there ?
Then the retracement is inevitable in coming weeks and 2 or 3rd week again nifty will be in the anticipated area.
Straddle breakeven should be above X and near Y
16750 STRADDLE will do the work.
By calculating the percentage return one can safely exit the straddle there.
Nifty monthly straddle has almost 30% ROI.
Even 10% in 15 days is a better deal.
Avoid If you don't know about straddle management
I hope this analysis will help you.
If you agree with my analysis you can comment on this post by yes or give a boost
Thank you. And happy trading.
*SECURING THE TRADE AND PROTECTING THE CAPITAL SHOULD BE YOUR FIRST PRIORITY.
*NOT A SUGGESTION VIEWS ARE FOR EDUCATIONAL PURPOSES.

NIFTY 50 Trading in index is become so frustrating due to the war and USA inflation.
so it is better to stay away from the market and wait till everything calms down.
even though FII knows what the fed is going to do but still they are waiting for the interest hike data because they are preparing
whether to crash the market immediately or gradually.
so it is better to not hold any overnight positions.
and ya the interest hike they are going to announce will definitely affect everyone not only the traders.
Fed system is always like
privatize the profits and socialize the losses

Nifty important levels to watchNifty has traded in a close range and formed spinning tops. for intraday trade, a breakout in any direction with a strong candle will give a good opportunity for a trade.

Banknifty Strong BuyHigh chance of banknifty to rally 1k more points
1. High volume candles
2. Volume Accumulation
3. RSI crossing 60


DMART : Looking for long opportunity!DMART is looking for great buying opportunity & to make some decent amount of profit.

Index Nifty view short term bearish Trend Market continue correction phase Its not the right time to Investment Kindly wait 10 to 15 days, a market can go downside 14100 - 14000 miner up its seems positive one day or two days...

NIFTY | Descending ChannelNifty is following a descending channel and taking resistance from 200 days EMA & support from 15102 level.

Zee Make or breaker levels Zee Make or breaker levels. Guess what can happen !!!!!!!!!!
keep eye if this break out.
follow me to motivate me to post more like this

NIFTY 330 points profit don't miss !i was BANNED for violating house rule so i am republishing again without any alteration
Bought @ 11,389
target @ 11,719
Total points gained = 385 as gap us in our favor

Sandwich pattern in NIFTY --------30min Chart i was banned for violating house rule so i am republishing again without any alteration
Bought @ 11428.34
Target @ 11709.64
StopLoss @ 11335
