BITCOIN BEARISH DUMP ALERT #BITCOIN BEARISH DUMP ALERT
1⃣ CRYPTOCAP:BTC Trying to Break Strong Support $61600
2⃣ If $61600 Level Break then Ready for $50700 & $40500
3⃣ Below Red RedLine #BTC is Bearish
4⃣ Keep an Eye on Red Circle is a Critical Zone
5⃣ Overall BTCUSDT Current Trend is Bearish
1-BTC

BTCUSD important levelBTCUSD make or break level, BTCUSD is at important level Forming a Channel Pattern Let's see this sustain or not. what is your view please comment it down. We are NISM Certified. All views shared on this channel are my personal opinion and is shared for educational purpose and should not be considered advise of any nature.

Looking for short!BTCUSD is looking for short after forming ascending channel & expecting a movement to the downside at 59K

BTCUSD important levelBTCUSD Which is showing a great opportunity BTCUSD is at important level. what is your view please comment it down. We are NISM Certified. All views shared on this channel are my personal opinion and is shared for educational purpose and should not be considered advise of any nature.

BTCUSD at important levelBTCUSD Which is showing a great opportunity BTCUSD is at important level. what is your view please comment it down. We are NISM Certified. All views shared on this channel are my personal opinion and is shared for educational purpose and should not be considered advise of any nature.

ROSE/USDT Bearish Divergence forming in Weekly chartBCBA:ROSE Bearish Divergence Alert
1⃣ Bearish Divergence Forming in Weekly Chart
2⃣ Targets: $0.1/$0.06 with SL = $0.1851 (RR = 1:5 )
3⃣ Market is highly Volatile so Dont try with High leverage
4⃣ Big Dump will be the best Long Term Accumulation strategy
5⃣ Long-Term Bullish Target = $1

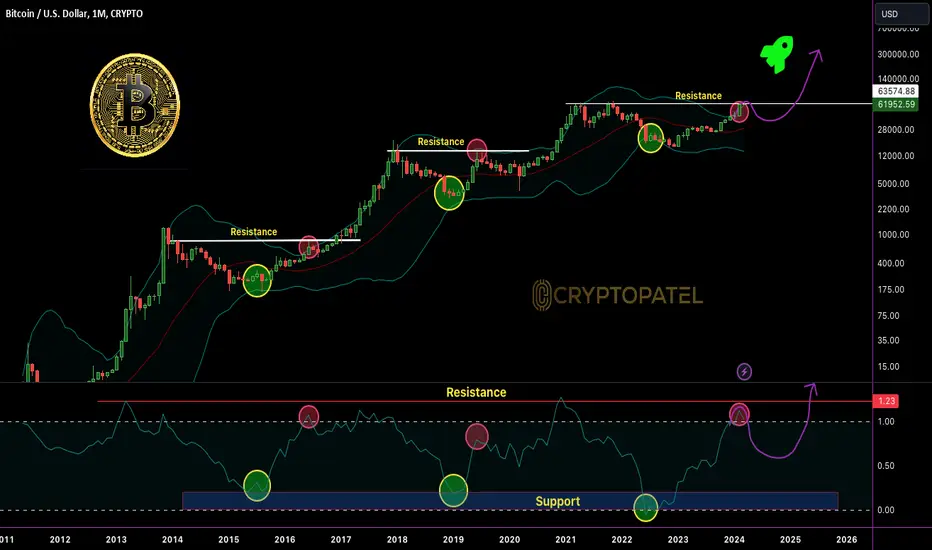
Charting the Future: $BTC HTF Analysis (2024-2026)Bitcoin recently hit a new ATH of around $74k and is now showing signs of forming a local top before a potential correction. There is a significant amount of liquidation expected below $50,700.
The next $Bitcoin halving is predicted to occur on April 21, 2024. The first support level is at 60k, followed by support around 40k. A correction to 50k is expected before potentially reaching 100k.
Buying below 60k could be a good opportunity. Sell after the second quarter of 2025. In my opinion, do your own research before making any decisions. Good Luck! CRYPTOCAP:BTC

BITCOIN Rising Wedge Bearish AlertBreaking: #BITCOIN Broken Rising Wedge Support
1⃣ CRYPTOCAP:BTC Broken Rising Wedge Support $70600
2⃣ Bearish Scenario if not Break $73500 Resistance
3⃣ Retest = $72500 And Target = $52500
4⃣ Trade with Confirmations and Never Trade Blindly and High Leverage

AVAX/USDT Is super Potential as per chart analysis CRYPTOCAP:AVAX Ready for $270 in Bull Run?
1⃣ #AVAX Forming Bull Flag in HTF
2⃣ Breaking out Flag resistance
3⃣ As per Bull Flag Pattern target will be $269
4⃣ For Bull Zone Weekly Candle must hold above $32
5⃣ If 1,2,3 Fractals works then AVAX/USDT will be Super Bullish
6⃣ #Avalanche is a layer-1 blockchain
#cryptomarket

ETH/BTC Chart Overview in monthlyETH/BTC Ascending Triangle Chart Analysis
1️⃣ Forming Strong Ascending Tringle in Monthly Chart
2️⃣ Price holding Strong Support at 0.045 BTC Level
3️⃣ Not Expecting Much Move but Expect Max will hit 0.150 BTC
4️⃣ If hit ETH = 0.150 BTC then CRYPTOCAP:ETH
Price will be FWB:12K -$15k
5️⃣ Supper Bullish Spot Ethereum ETF News in Q2

$BTC | 1H: LTF Plan:
1 CRYPTOCAP:BTC = $100,000. Above 70k bitcoin is extremely bullish, with another all-time high reached today.
While some pullback is expected, it's likely to set the stage for another impressive pump. Send it to 75k!
Previous Day:
VAH: $69826
POC: $69418
VAL : $68980
Date: 11 Mar 2024

BTC.D is about to decline, Alt season is coming! Historical data shows in 1month time thet alt season is about to start in few days.

DOGE/USDT now 200% Up from our Entry setupCRYPTOCAP:DOGE Pattern Repeated and Blasting as per Our Analysis
1⃣ #DOGECOIN is now 200% Up from our Entry zone
2⃣ My Long Term Target is $2/$3/$4/$5
3⃣ Currently #Memecoins Session is on Fire
4⃣ Our Initial Entry was $0.65-$0.75 ✅
5⃣ ElonMusk Always Supports DOGE as per His Tweets
6⃣ Currently Strong Support at $0.1
RT/Comments if you Agree with My #DOGE Setup.

RUNE/USDT 764% Up from Our Entry zoneRUNE/USDT Profit Analysis
1⃣ CRYPTOCAP:RUNE Currently 764% up from our Entry Setup
2⃣ Entry Zone: $1-$0.8 ✅
3⃣ I am Expecting $20-$30 in this bull Run
4⃣ If your Entry is Around $1 then don't forget to secure some Profit
5⃣ Strong Support = $4.10
6⃣ #THORChain is a decentralized liquidity protocol that enables cross-chain asset exchange.

BITCOIN 2025 ROADMAP for BULL RUN#BITCOIN SUPER BULLISH ROADMAP
1⃣ CRYPTOCAP:BTC Forming Inverse H&S ( IMO )
2⃣ Strong NECK LINE Resistance at $69,000
3⃣ If Rejected from NECK LINE Resistance then We can see Right Shoulder in Play
4⃣ If Right Sholder play then Buying Range will be $35000-$30,000 = Strong Support
5⃣ If #BTCUSDT Play Inverse H&S Pattern Then Target for Bull Market will be $2,50,000
Like and Share if you Want Bitcoin at $250k

$BTC | 1H: LTF Plan:Bitcoin recently reached a new all-time high, followed by a 10% drop and quick recovery. Monday's range cleared.
Now, The Bulls are still showing strength in the Crypto market, with expectations of reaching another all-time high soon.
Before that happens, CRYPTOCAP:BTC will likely trade within a range, with a target of $70,000 for this week. Run it back!
Previous Day:
VAH: $68938
POC: $66970
VAL : $63817
Date: 6 Mar 2024


Altcoin Ready to fly soon ? Bitcoin Dominance Chart AnalysisAltcoins preparing for liftoff!
#BTC dominance facing triple resistance:
1⃣ Long-term trendline at 56%
2⃣ 2W cloud
3⃣ Kijin projection
Dominance likely to top soon = #altseason incoming!
Alts about to SURGE. The time is now!

BITCOIN READY TO FLY ?The #BITCOIN party is just getting started
Bollinger bands are still tight - massive expansion ahead.
This bull run is in the early innings.
HODL on, the best is yet to come!
NFA
BTC Bitcoin Sell-Off and COIN Coinbase potential HackIf you haven`t bought BTC before the rally:
Then you need to know that today Coinbase's trading engine experienced a disruption during ETF trading hours, causing a significant impact on individuals actively trading Bitcoin on the platform and leading to a substantial drop in its price.
The aftermath of the incident saw the price recovery after ETFs purchased actual Bitcoin for the next trading day (T+1). However, questions arose regarding the cause of the price decline. While Coinbase's outage played a role, suspicions arose about other exchanges possibly exerting considerable selling pressure. The speculation was whether Coinbase was the main stabilizing force and if there were other irregularities in play.
Concerns escalated, leading to speculation about a potential Hack on Coinbase.
Users reported missing assets, and both phone and chat support were inaccessible during a critical market moment.
The situation highlighted the vulnerability of relying on centralized exchanges, emphasizing the importance of having control over one's private keys to ensure ownership and security of crypto assets.
The overall consequence was a market downturn, signaling a potential local top.
My Price Target for Bitcoin is $51K.

MOVR/USDT Ready for $100 ?Will SEED_DONKEYDAN_MARKET_CAP:MOVR break its ATH $440 Level Again?
1⃣ #MOVR did 11x from in last 4 months
2⃣ Before Pump MOVR Also dumped 99% of the last ATH
3⃣ Down From $440 to $3.5
4⃣ 40% down After My analysis hope you entered at our entry zone.
5⃣ Now I am expecting $100-$200 in the bull run if hold $20 Support.
NFA


Join the $WOO Party!BINANCE:WOOUSDT is showing signs of readiness to pump to $1. There's a noticeable surge in buying from spot investors, signaling a potential uptrend.
Alts keep pumping always happen after CRYPTOCAP:BTC bulls. If there is a pullback, we will consider taking a long position. Here's to hoping for the best!
