Bitcoin Bybit chart analysis FEBURARY 11Hello
It's a Bitcoin Guide.
If you "follow"
You can receive real-time movement paths and comment notifications on major sections.
If my analysis was helpful,
Please click the booster button at the bottom.
This is Bitcoin's 30-minute chart.
The Nasdaq indicators will be released shortly at 10:30 AM.
*When the light blue finger moves,
this is a two-way neutral strategy: switching from short to long or holding long.
1. After touching the purple finger once at the bottom,
the light blue finger at the top indicates a short position entry point at $67,329.9.
/ Stop-loss price if the orange resistance line is broken.
2. Switch to a long position at $64,070.8. / Stop-loss price if the light blue support line is broken.
3. $68,971.8: First target for a long position -> Target price in the order of Top and Good.
The middle price of $68,041.3 can be used as a long position re-entry point.
If the first point is immediately pushed back from the current position,
this is a final long hold strategy at the bottom.
(While unlikely, there's a possibility that it will touch 67.3K at the top and support at point 1. Please note this. See the analysis from yesterday, February 10th.)
Movement within the green support line and orange convergence zone is a sideways movement.
Today, depending on the Nasdaq indicator release,
variables should emerge.
I've tried to be as realistic as possible.
Please use my analysis to this point for reference only.
I hope you operate safely, with a principled trading strategy and stop-loss orders in place.
Thank you.
1-BTCUSD

BTCUSDT.P – Elliott Wave AnalysisSHORT-TERM TRADE PLAN AS PER ELLIOTT WAVE ANALYSIS:
💰 Current Price: ~67230
🔻 Scenario 1 (Downside):
- 🛒 Buying interest may emerge at Intermediate Wave 2/B Support Zone → 62127 – 63890
- 📉 If deeper correction → Major Wave C Support Zone → 48412 – 53325
🔺 Scenario 2 (Upside):
- ⚠️ Selling pressure likely at Intermediate Wave C Resistance Zone → 76328 – 78091

Bitcoin Bybit chart analysis FEBURARY 10Hello
It's a Bitcoin Guide.
If you "follow"
You can receive real-time movement paths and comment notifications on major sections.
If my analysis was helpful,
Please click the booster button at the bottom.
This is Bitcoin's 30-minute chart.
The Nasdaq indicators will be released shortly at 10:30 AM.
The 4-hour chart is undergoing a MACD dead cross.
I've created today's strategy.
*When the light blue finger moves,
Short->Long switching or holding a long position.
This is a two-way neutral strategy.
1. The light blue finger at the top is the entry point for a short position at $70,032.7.
/ Stop-loss price if the orange resistance line is broken.
2. Switch to a long position at $67,889. / Stop-loss price if the purple support line is broken.
3. The first target for a long position at $70,848.3. Target prices are Top, Good, and so on.
If the light blue finger at the top falls immediately without touching 70K,
Long position holding at the first area at the bottom is the final defensive line. / Stop-loss price if the green support line is broken.
Below that is the bottom area.
Up to this point, I ask that you use my analysis for reference only.
I hope you operate safely, with a focus on principled trading and stop-loss orders.
Thank you.

Bitcoin Bybit chart analysis FEBURARY 9Hello
It's a Bitcoin Guide.
If you "follow"
You can receive real-time movement paths and comment notifications on major sections.
If my analysis was helpful,
Please click the booster button at the bottom.
This is a Bitcoin 30-minute chart.
There are no separate Nasdaq indicators.
When the red finger moves,
*This is a one-way long position strategy.
1. $66,268.1 is the entry point for a long position. / Stop-loss price is set when the green support line is broken.
2. $69,531.5 is the first target for a long position.
-> $71,221 is the second target. -> Target prices are set at Top and Good in that order.
Points 1 and 2 in the middle are used to re-enter a long position.
If the price touches 69.5K at the top first,
it could end in a sideways market within the purple support line of point 1. From the breakout of the green support line, the price remains open to a maximum of $61,222.5, so please be cautious.
Up to this point, please use my analysis for reference only.
Please operate safely, following the rules and setting stop-loss orders.
Thank you.

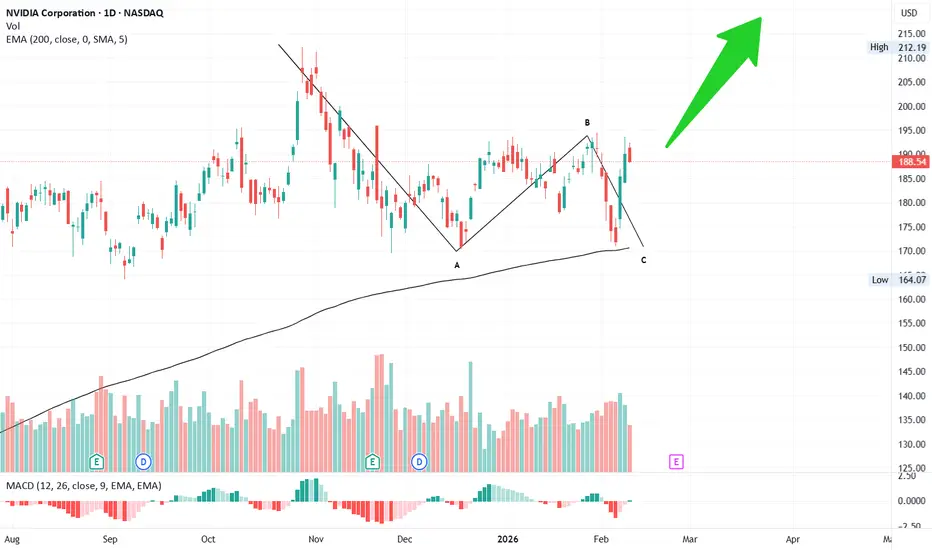
#NVIDIA future BULL RUN📉 NVIDIA Daily Chart Correction – Elliott Wave Insight
NVIDIA began its correction on 29 Oct ’25, topping at 212. From there, it declined sharply to 170 by 17 Dec ’25, completing the A wave.
📊 The A wave unfolded in 5 sub-waves, signaling a zig-zag correction pattern.
📈 As expected, the B wave retraced less than the 61.8% Fibonacci level, peaking at 197 on 29 Jan ’26.
💥 The C wave followed with a sharp downfall, finally completing on 5 Feb ’26 right at the 200 EMA on the daily chart.
🎯 Looking ahead, the next target sits at 220, aligning with the broader corrective structure and Fibonacci projections.
⚡ This sequence highlights the precision of Elliott Wave theory in capturing market psychology and corrective structures.
#Trading 📉 #ElliottWave 📊 #NVIDIA 💹 #TechnicalAnalysis 📈 #StockMarketInsights 💵 #Target 🎯 #Stocks 📊 #Investing 💼 #Charts 🖊️ #MarketTrends 📊
#TELSA 1hr wave analysis.🚀 What’s Next in Tesla?
After completing a powerful 5-wave impulsive structure on the 1-hour chart (from $222 on April 22, 2025 to $499 on December 22, 2025), Tesla wrapped up a remarkable 10-month bull cycle. 📈🔥
Now, the stock has entered its corrective phase:
• 🅰️ The A wave finished on Feb 5, 2026 at $388, retracing ~38.2% of the prior impulsive move.
• 🔄 Since the A wave unfolded in 3 waves, the correction is shaping into a flat pattern.
👉 This means the B wave is likely to retrace at least 61.8%, projecting Tesla’s price to rebound above $460 in the coming days. ⚡💹
Following this, the C wave will continue the corrective journey.
---
📊 Technical takeaway: Tesla’s chart is setting up for a short-term bounce before resuming its correction. Traders should stay alert for opportunities in this B wave rally. 🚀📉📈

#BTCUSD🚀 Bitcoin Technical Update 📊
After hitting a low of $60K on Feb 7, Bitcoin completed its A-wave correction, retracing around the 38.2% Fibonacci level. This structure suggests a classic zig-zag correction.
🔮 Now, we’re likely entering the C-wave, with potential upside targets in the $77K–$81K range over the next 1–2 days.
👉 What’s your take—are we about to see Bitcoin break new highs, or will resistance hold strong?
💬 Drop your thoughts below ⬇️ — let’s spark a discussion!
#Bitcoin #CryptoTrading #TechnicalAnalysis #ElliottWave #CryptoCommunity

Weekly Analysis with buy/Sell scenarios in BTCAnother selling week. Price made low of 59977 and closed above ~70K. Overall BTC is still bearish and we may see further downfall after some pullback. ~74500 is critical level for pullback. ~55K is critical next level. We may witness a consolidation and reversals on 50K – 55K zone.
Price will remain bearish till delivery changes at 4-hour time frame. Currently price has formed double top in 4H time frame which is a good signal for further downside move.
Weeks back we analyzed down fall toward 65K and further ~50K and price made the low of 60K so far. So our overall analysis is still stands good.
Critical Points
1. Price has created double top in 4H TF and targeting further low.
2. Price may hit the zone of 50K-55K and show the delivery change.
3. Next POI is second quadrant of weekly time frame.
4. Price may consolidate at this level and form MSS at this POI and possibly reverse for further highs.
5. Most probably price will take liquidity of FVG/RDRB level and create MSS/CISD/TS/iFVG in LTF.
6. Price should show rejection/reversal in respective LTF (4H/1H) at Key Level/FVG zone.
7. Take the trade only once clear entry model i.e. turtle soup. iFVG break, CDS or MSS happens on LTF.
All these combinations are signalling a high probability and high reward trade scenario.
Note – if you liked this analysis, please boost the idea so that other can also get benefit of it.
Also follow me for notification for incoming ideas.
Also Feel free to comment if you have any input to share.
Disclaimer: This analysis is for educational purposes only and does not constitute investment advice. Please do your own research (DYOR) and check with your financial advisor before making any trading decisions.

Bitcoin Bybit chart analysis FEBURARY 3Hello
It's a Bitcoin Guide.
If you "follow"
You can receive real-time movement paths and comment notifications on major sections.
If my analysis was helpful,
Please click the booster button at the bottom.
This is Bitcoin's 30-minute chart.
There's a Nasdaq indicator release coming up shortly at 12:00 PM.
In the upper left corner, in purple, I've linked the strategy to yesterday's short position entry point, $78,592.3.
*The blue finger path indicates a two-way neutral strategy.
1. Short position entry point at $78,795.9 at the top / Stop loss if the pink resistance line is broken (same as yesterday's short stop loss of $78.9K).
2. Long position switch at $77,708.7 / Stop loss if the green support line is broken.
3. Long position 1st target at $80,967.2 -> Good -> Gap8. Target prices in that order.
If the rebound fails to break the orange resistance line at $80,196.8 at the top,
a stronger correction is likely.
If the price falls directly without touching the short position entry point at the top, the final long position entry point is the first section at $76,768.8.
Below that, the bottom -> section 2 is a dangerous area where the previous low is broken.
Please use my analysis to this point for reference only.
I hope you operate safely, with a strict adherence to principled trading and stop-loss orders.
Thank you.

Hidden Bearish Divergence appears on 30m Time frameI have marked a red resistance line on RSI on 30m time frame. Which is looks like a class B Bearish Divergence. If it loses the support box expect a swift drop toward $68K.

BTCUSD Trend Change, Support & Resistance ZonesBTCUSD is showing signs of slowing down after a strong fall and is moving into a short-term recovery. Earlier, price was making lower highs and lower lows, following a downward trendline, with strong selling pressure. Gaps during the fall show that buyers were weak at higher levels.
Price found support around 62,000–63,000 and bounced up, breaking the short-term downtrend and making a higher low. This shows short-term relief, but not a full reversal yet.
The price is facing resistance near 70,000–71,000, where sellers may come back. Support around 68,500–67,500 can act as a good buy-on-dip zone for short-term trades. If price fails to cross 71,000, it may consolidate or pull back to 65,000, while 61,000 remains strong support.
Overall, the bias is neutral to cautiously bearish below the resistance zone. Traders should wait for confirmation, manage risk carefully, and avoid guessing, as volatility is still high.
Disclaimer: This analysis is for educational purposes only. It is not financial advice. Trading involves risk and uncertainty.

Bitcoin at $69K: Relief Bounce or Setup for the Next Leg Lower?Bitcoin’s move back toward the $69,000 area may look constructive at first glance, but structurally it resembles a relief bounce inside a broader downshift, not the start of a new bullish expansion.
The recent price action shows a classic sequence:
a sharp drop, followed by a fast recovery into a prior breakdown zone.
This type of move is common in markets that are rebalancing after distribution, not ones preparing for fresh highs.
-------------------------------------------------------------------------------------------------------------
The $74K zone remains the real barrier
Above the current price sits the $74,000 region — a key structural resistance.
This zone represents:
A prior breakdown level
Trapped long positions
A psychological ceiling for the current range
Until Bitcoin can reclaim and hold above this level, the market remains in a lower-value environment. Rallies into this area are more likely to attract sellers than new long-term buyers.
Strong trends reclaim lost structure quickly.
Weak or corrective markets stall below it.
Right now, Bitcoin is doing the latter.
------------------------------------------------------------------------------------------------------------
The current bounce: reaction, not expansion
The move from the recent lows into the $66K–$69K zone appears more like:
Short covering
Mean reversion
Liquidity balancing
There is no clear sign of aggressive accumulation or impulsive breakout behavior. Instead, price is compressing just below resistance, which often precedes another directional move.
When markets bounce but fail to reclaim key levels, they tend to roll over once buying pressure fades.
---------------------------------------------------------------------------------------------------------------
The structural downside path
Below the current range, liquidity sits in clear, untested pockets.
First major magnet: $65K zone
This area represents:
The recent reaction low
A short-term structural support band
A logical first retest level
If price loses this zone with momentum, it signals that the bounce was only corrective.
------------------------------------------------------------------------------------------------------------
Deeper structural target: $48,254
This remains the primary downside objective from the broader structure.
This level aligns with:
A prior accumulation region
A major structural support zone
A logical reset level after distribution
A move toward this area would represent a full corrective leg, not necessarily a long-term bearish collapse.
-----------------------------------------------------------------------------------------------------------
Why the downside scenario remains favored
Several structural elements support the bearish continuation:
1) Failure to reclaim key resistance
Price remains below the $74K structural ceiling.
2) Relief-style bounce structure
The recovery lacks impulsive, trend-confirming behavior.
3) Untested liquidity below
Large demand zones sit far beneath current price.
4) Late-cycle positioning
Markets near highs often drift before a deeper reset.
-----------------------------------------------------------------------------------------------------------
The likely sequence from here
The higher-probability path:
Continued compression below $70K–$74K
Loss of the $66K–$65K support band
Acceleration toward deeper liquidity zones
Eventual test of the $48,254 region
Only a strong reclaim and acceptance above $74K would invalidate this path.
------------------------------------------------------------------------------------------------------------
Bottom line
Bitcoin at $69K doesn’t confirm strength.
It looks more like a relief rally into resistance.
The structure still points toward:
Weakness below $74K
Support test near $65K
Deeper target around $48,254
Until key resistance is reclaimed, the bounce is likely temporary, not transformational.


#BTCUSDWhat’s Next in Bitcoin? 🚀💡
After completing its 5-wave bull run 📈, Bitcoin entered a corrective phase starting on October 3, 2025, which recently completed its A wave on February 5, 2026.
🔍 Breaking down the A wave:
1️⃣ Wave 1: Low formed on October 11
2️⃣ Wave 2: Flat correction completed on October 30
3️⃣ Wave 3: Sharp decline to $80K on November 21 ⚠️
4️⃣ Wave 4: Flat correction rebound, completed on January 13, 2026 🔄
5️⃣ Wave 5: Final drawdown to $60K 💥📉
✨ What’s next?
Bitcoin is now poised to enter its B wave, a classic ABC 3-wave structure:
⚡ Initial bounce: sharp and fast
⏳ Followed by grinding upward momentum
🎯 Potential target: $95K zone
💬 This corrective rally will be crucial in shaping sentiment, positioning traders, and setting the stage for the larger C wave. Stay alert, watch the signals 👀, and prepare for volatility ahead 🌊.

BTCUSD Trend Outlook and Key Price ZonesBTCUSD is trading in a clear bearish trend after strong and continuous selling pressure. Price is making lower highs and lower lows, showing sellers are still in control. The market has now reached an important support and demand area near 65,000, where some short-term stability is visible. This zone is crucial for buyers to hold. If price sustains above this level, a slow recovery toward 68,000 is possible, followed by resistance near 70,000–72,000, where selling was seen earlier. These levels may act as strong supply zones. On the downside, a clear break below 65,000 can increase downside momentum and open the path toward 63,500 and further toward 61,000. Overall trend remains bearish unless price breaks above key resistance and forms a higher low. Any buying at current levels should be cautious and based on confirmation. Proper risk management is important in this volatile market.

Bearish continuation for BTCUSD📍 Primary Plan — Short the Pullback
✅ Entry Zone (Sell)
69,800 – 70,800
Reason:
Previous breakdown area
Intraday supply
Likely retest zone after bounce
🛑 Stop Loss
Above 71,300
Why:
Above last lower-high cluster
Above pullback structure
If price gets here → bearish idea weakens
🎯 Targets
Target Level Logic
T1 68,000 intraday support
T2 66,500 recent sweep zone
T3 65,000 next liquidity pocket
T4 60,000 Final stoppage
Scale out — don’t hold full size to last target.
🚀 Alternate Plan — Breakout Long (Only If Structure Shifts)
Right now this is counter-trend — so only trade if confirmed.
✅ Breakout Confirmation (Must Have)
15m candle close + hold above 71,000–71,200
Not just a wick — a body close + small pullback hold.
📍 Long Entry Zone
On retest of 71,000–71,200 after breakout
🛑 Stop Loss (Long)
Below 70,200
🎯 Long Targets
Target Level
T1 72,300
T2 73,100
T3 74,200
⚠️ Quick Reality Check (Important)
Right now:
Momentum = bearish
Structure = lower highs / lower lows
Best edge = short pullbacks, not blind longs
Breakout longs only after reclaim — no anticipation trades here 😄

Why Bitcoin’s Stability Is a Warning, Not StrengthBitcoin’s inability to participate in the recent “debasement trade” is not a sign of hidden strength — it’s a sign of waning relevance in the current macro cycle.
While gold and silver surged during the final euphoric phase, Bitcoin’s stagnation near $82,000 suggests that capital actively chose hard assets over digital ones, not that Bitcoin avoided speculative excess. In other words, investors didn’t “miss” Bitcoin — they rejected it.
Rather than having “less froth to shed,” Bitcoin may simply lack incremental demand. The market has already priced in its scarcity narrative, ETFs, and institutional adoption. Without a new catalyst, stability becomes distribution, not consolidation.
The idea that liquidity exiting metals will rotate into crypto assumes that Bitcoin is viewed as a safe alternative store of value. Current flows argue the opposite: in periods of uncertainty, capital is choosing tangible, historically defensive assets, not high-volatility digital instruments.
Bitcoin’s scarcity also cuts both ways. Unlike gold and silver, Bitcoin has no industrial or sovereign demand floor. If speculative demand dries up, there is nothing to absorb sell pressure. Scarcity without utility can amplify downside, not protect against it.
If the Warsh nomination triggers prolonged global liquidity tightening, Bitcoin is likely to suffer more than metals, not less. Cryptocurrencies remain among the most liquidity-sensitive risk assets. Tightening doesn’t just pressure them — it starves them.
Bottom line
Bitcoin’s calm may not be coiled strength. It may be complacency before repricing.
In this view, metals already flushed excess and proved their role. Bitcoin still has to.

BTC Ichimoku 4H: Bears in Top Gear as Every Bull Reclaim FailsBTC Ichimoku 4H: Bears in Top Gear as Every Bull Reclaim Fails
This is one of those phases where Ichimoku structure becomes crystal clear and easy to read.
The Weekly HTF has broken down from the Kumo , establishing a clear bearish higher-timeframe bias.
Within that context, the 4H LTF has printed a textbook hierarchy of breakdowns — price first lost the Kumo, followed by failed reclaim attempts at the Kijun, and most recently at the Tenkan.
This Kumo → Kijun → Tenkan sequence highlights sustained bearish control and confirms that upside moves remain corrective rather than trend-changing .
As long as the 4H fails to close above 83,140 , structure favors downside continuation toward the lower reference levels:
L1: 72,480
L2: 71,500
L3: 70,500
L4: 69,500

BTCUSD Reacts From Demand Zone After Strong Bearish MoveBTCUSD has shown a sharp fall from the upper resistance area near 90,500–91,500, where sellers clearly dominated and price failed to hold higher levels. This rejection led to a strong bearish move, confirming a short-term downtrend with consistent lower highs and lower lows. The descending trendline reflects continued selling pressure and weak upside acceptance.
After the decline, price reached an important demand zone around 76,000–77,000. In this area, selling pressure reduced and buying interest appeared, leading to a short-term bounce. This zone is supported by previous price consolidation and acts as a key support in the current market structure. The reaction suggests temporary stability, not a confirmed trend change.
While price stays above 76,000, consolidation or a corrective move toward 82,000–85,000 is possible. This zone may act as near-term resistance, as it aligns with earlier breakdown levels. Acceptance above this range would reduce bearish strength and support further recovery.
If price fails to sustain above the demand zone, downside risk remains open toward the 73,000 support region. Overall bias stays cautious, with high volatility expected near marked levels.

#XAUUSD📊 Gold (XAU/USD) Elliott Wave Analysis
Gold is unfolding a corrective structure that highlights the power of Elliott Wave theory:
- Wave A: The decline began with a 5-wave fall. Wave 1 retraced more than 61.8% by Wave 2, forming a zigzag.
- Wave 3: The strongest and largest bearish leg, confirming downside momentum.
- Wave 4: Price is now rising in a corrective move. This rise is part of the ABC pattern within Wave 4, where the current rally represents Wave C.
- Wave 5 (ahead): Once this corrective rise completes, the next bearish leg is expected.
📈 Key Levels to Watch:
- Corrective rise could extend toward 5030 – each rally remains an opportunity to sell.
- Downside target: Price is projected to revisit the 4200 zone as Wave 5 unfolds.
💡 Trading Insight:
Every corrective rally is a chance to align with the larger trend. Staying patient and disciplined in identifying these setups is crucial for risk-managed entries.

Bitcoin Bybit chart analysis FEBURARY 2Hello
It's a Bitcoin Guide.
If you "follow"
You can receive real-time movement paths and comment notifications on major sections.
If my analysis was helpful,
Please click the booster button at the bottom.
This is Bitcoin's 30-minute chart.
The Nasdaq indicators will be released shortly at 12:00 PM.
We've proceeded as safely as possible, keeping in line with the current market conditions.
*When the light blue finger moves,
Two-way neutral strategy:
1. After touching the purple finger once at the top (autonomous shorting),
Switch to a long position at $77,247.9 at the light blue finger at the bottom.
/Stop-loss price if the light blue support line is broken.
If the price falls immediately without touching the first section,
Place the second section at the bottom as a long position waiting area. / Place the stop-loss price if the green support line is broken.
2. The top section is the target price -> If the price touches the good section repeatedly,
Maintain the long position. / If the price touches the top section and immediately falls,
Place the first section as a confirmation area for re-entry into the long position.
From the bottom, there's a possibility of further lows being broken.
The third section at the very bottom is a double bottom risk zone.
Currently, there's no clear support line, making long positions risky.
A rebound is needed, and I'll focus on this.
*Key criteria for this are a Nasdaq rise or sideways movement, and the XAUUSD gold price should continue to decline.
Please use my analysis to this point for reference only.
I hope you operate safely, with a focus on principled trading and stop-loss orders.
Thank you.

BTCUSD BUYI see BTCUSD going up.
Recent fall in metals triggered possible investments in BTCUSD for short term.

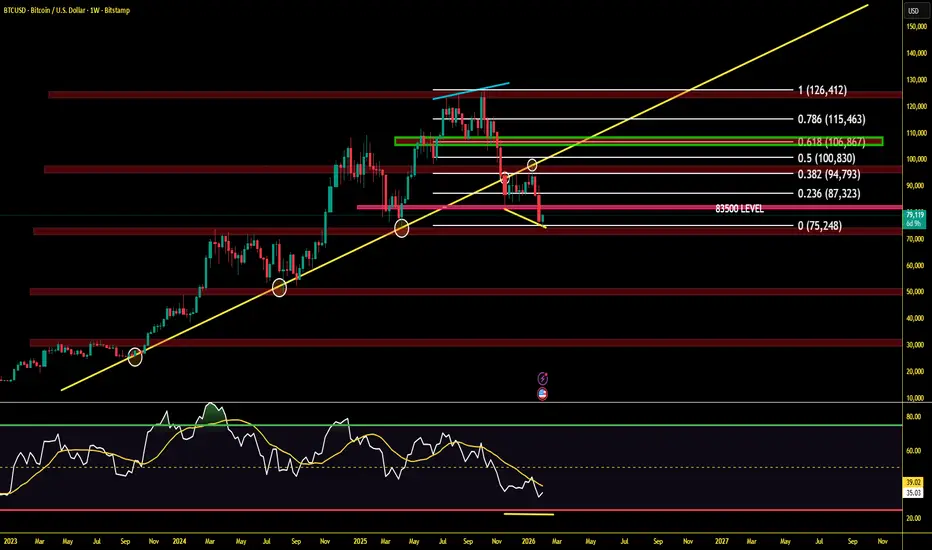
BTCUSD Weekly Close Decides the Next Major Move 83,500 Is strongBTCUSD is at a critical decision zone.
A weekly close above 83,500 can trigger a short-term relief rally towards the 0.618 Fibonacci retracement.
However, the 106,300 – 106,800 region remains a major supply and profit-booking zone.
Timeframe Context:
This analysis is based on the daily structure with weekly candle confirmation.
Key Observations:
• 83,500 is acting as a decisive support/resistance flip level
• A weekly close above 83,500 increases the probability of a move towards the 0.618 retracement zone
• The 106,300 – 106,800 area aligns with 0.618 Fibonacci + historical supply, making it a high-risk zone for fresh longs
Trading Insight:
Any upside from current levels should be treated as a relief rally, not a confirmed bullish continuation.
Strong rejection or bearish confirmation near the 0.618 zone can lead to a larger corrective move or crash.
Conclusion:
Trade the move, respect the levels, and wait for confirmation —
levels lead, price reacts.