Bitcoin Bybit chart analysis April 22Hello
It's a Bitcoinguide.
If you have a "follower"
You can receive comment notifications on real-time travel routes and major sections.
If my analysis is helpful,
Please would like one booster button at the bottom.
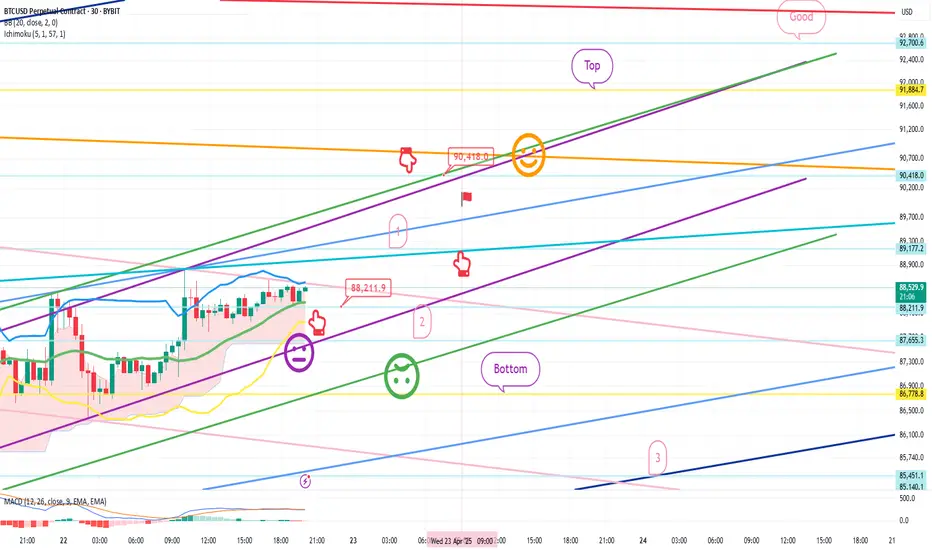
This is the Bitcoin 30-minute chart.
There is no Nasdaq indicator announcement.
Tether dominance is in a vertical decline.
First, I ignored Nasdaq and focused on Bitcoin based on my perspective on recent movements.
In the case of Bitcoin, I proceeded with a conservative strategy when the short-term pattern was broken.
*One-way long position strategy when the red finger moves
1. 88,211.9 dollars long position entry section / cut-off price when the green support line is broken
2. 90,418 dollars long position 1st target -> Top 2nd target
If the strategy is successful, the 1st section at the top
can be used as a long position re-entry section,
but from the Top section -> Good section, it is the center line of the weekly Bollinger Band chart,
so there is a possibility of a strong adjustment this week.
Section 1 at the top and section 2 at the bottom are extreme horizontal support sections.
If section 2 is broken, it is a section where the short-term pattern is broken,
and since the bottom touch at the bottom is the lowest point of the daily chart,
it is not good,
and since the support line is open, it can be directly connected to section 3.
Up to this point, I ask that you simply refer to and use my analysis,
and I hope that you operate safely with principle trading and loss cut prices.
Thank you.
1-BTCUSD
BTC/USD 1H – Bullish Breakout with FVG Entry & $91K TargetChart Breakdown:
📈 Trend Structure:
BTC is moving in an ascending channel with:
🔵 Resistance Line on top
🟢 Support Line below
🔁 Recently, it broke out above the resistance with a bullish move!
Key Zones & Levels:
🟦 Fair Value Gap (FVG)
This is your potential buy zone:
✅ Entry Point: $86,135
❌ Stop Loss: $85,098
🎯 Target: $91,000
📌 Plan:
Wait for price to retrace into the FVG zone
Look for a bullish bounce ✅
Enter long at $86,135
Set your SL and target accordingly
Risk-Reward Setup:
Risk: Small (below FVG zone) ❗
Reward: Big upside toward $91,000 🚀
Gain Potential: +5.74% ($4,948 per BTC)
Visual Flow:
1️⃣ Price breaks resistance 🔼
2️⃣ Pullback expected to FVG 🔽
3️⃣ Entry triggers around $86,135
4️⃣ Targeting moon shot to $91K 🌕
Conclusion:
This setup shows a bullish continuation with solid RR.
If BTC holds the FVG on a retest, the move to $91K looks likely!

Bitcoin Bybit chart analysis April 17Hello
It's a Bitcoinguide.
If you have a "follower"
You can receive comment notifications on real-time travel routes and major sections.
If my analysis is helpful,
Please would like one booster button at the bottom.
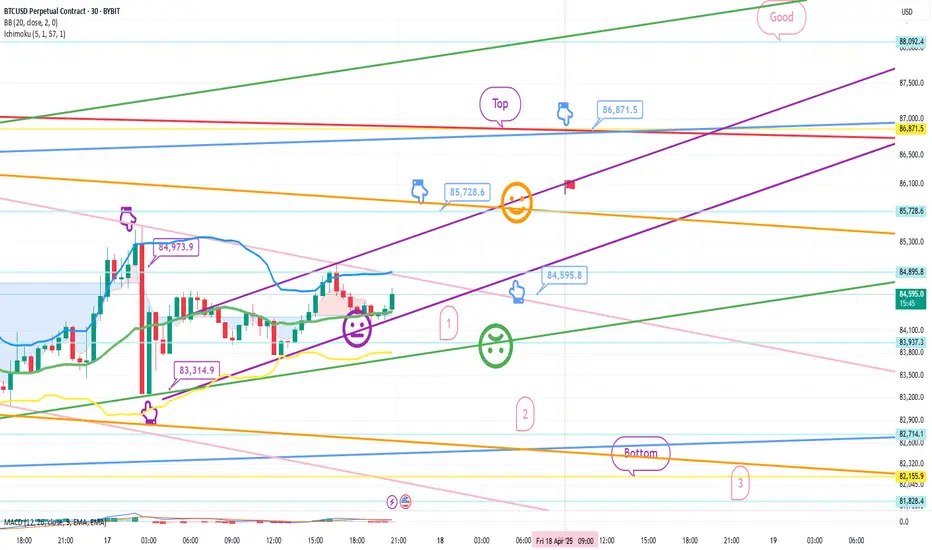
This is the Bitcoin 30-minute chart.
Nasdaq indicators will be announced at 9:30 in a little while.
The purple finger section on the left
is connected to the short->long switching section that was performed on the 16th.
* When the blue finger moves,
Bidirectional neutral
Short->long switching strategy or long waiting if it goes down right away.
1. 85,728.6 dollars short position switching / cut-off price when orange resistance line is broken
2. 84,595.8 dollars long position switching / cut-off price when green support line is broken
3. 86,871.5 dollars long position 1st target -> Good 2nd target
Today's 12-hour chart MACD dead cross is an ignoring strategy. Check if the purple support line deviates from the current position,
and from the 1st section of the green support line deviates,
even those who have been holding long positions since yesterday can operate at the same stop loss price.
If the short position entry section at the top comes down without touching,
the 2nd section at the bottom is the final long waiting section (6+12 pattern),
and if the rebound is not good in this section and it is pushed,
it may continue to fall to the 3rd section at the bottom due to the pressure of the 12-hour chart MACD dead cross.
Up to this point, please use my analysis article only for reference and use,
and I hope you operate safely with the principle trading and stop loss price.
Thank you.
BTCUSD READY TO FLY 4200 POINTS 84830 TO 89000+++BTCUSD strong zone above only 84830
There is no resistance upto 89000
Wait for active mode
Buy above 84830................
Stoploss..........................84400....430 points
Target1..........................87000.....2170 points
Target2..........................89000.....4170+ points
Disclaimer - This level only for education purpose . Do ur own analysis

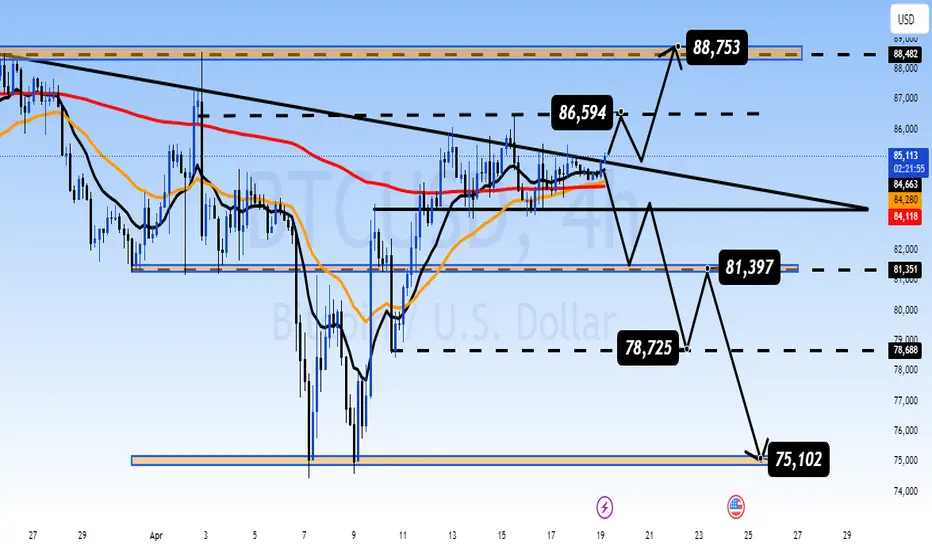
Consolidation Phase Before Breakout – Key Levels to Watch Bitcoin Technical Analysis: Consolidation Phase Before Breakout – Key Levels to Watch 📈💰
Market Overview: Bitcoin (BTC/USD) is currently navigating through a consolidation phase, forming a symmetrical triangle pattern on the 4-hour chart. The price action has been fluctuating between significant resistance at 86,594 and support at 78,725. As we approach the apex of the triangle, volatility is expected to rise, and a breakout from this range could set the direction for the next major move in Bitcoin's price.
Key Technical Levels:
Resistance: 86,594, 88,753
Support: 78,725, 75,102
Technical Indicators:
Bitcoin is holding above both the 50-day and 200-day moving averages (MA), confirming the overall bullish structure in the market. The price’s proximity to key resistance levels suggests that BTC is preparing for either a breakout or a pullback.
Currently, BTC is testing the upper trendline of the triangle, which means the market is gearing up for a potential decisive move. A break above the 86,594 level could send the price toward 88,753, and potentially higher, with 91,000 as a psychological target.
Chart Analysis:
Symmetrical Triangle Pattern: Bitcoin’s price movement has been restricted within the triangle’s boundaries. If the price breaks the 86,594 resistance, we could see BTC push to 88,753, and possibly even 91,000. However, if the breakout fails, BTC might retrace to the support levels at 78,725 or 75,102, which could provide better entry points for long positions.
The formation of the triangle indicates that the market is waiting for a clear direction. A breakout will likely be followed by a sharp movement either upwards or downwards, so traders should be prepared for a spike in volatility.
Macro Factors and Market Sentiment:
Geopolitical Tensions and Economic Uncertainty: The ongoing geopolitical tensions between major global economies, particularly the U.S. and China, have increased demand for safe-haven assets like Bitcoin. In addition, global inflation concerns continue to push investors toward digital gold as a store of value.
U.S. Federal Reserve Policies: The Fed’s actions regarding interest rates and monetary policy will have a direct impact on Bitcoin’s price. Any dovish stance or indications of more easing could benefit Bitcoin, as it is seen as a hedge against inflation and currency devaluation.
Market Outlook:
Bullish Scenario: A breakout above 86,594 could lead Bitcoin towards 88,753 and potentially 91,000. With Bitcoin’s bullish setup and safe-haven status, the next move might be strongly in favor of the bulls.
Bearish Scenario: If Bitcoin fails to break through resistance, we might see a retracement towards the support zones at 78,725 or 75,102, where buying opportunities may arise.
Trading Strategy:
BUY Zone: 78,725 - 75,102 (Look for a confirmation above support levels)
SELL Zone: 86,594 - 88,753 (Watch for a breakout above resistance for further upside)
Conclusion:
Bitcoin’s current consolidation phase has set the stage for a potential breakout. The price is testing crucial resistance levels, and the next few days could determine whether BTC will make a new push towards ATHs or pull back to retest lower levels. With the broader economic and geopolitical conditions favoring Bitcoin as a hedge, the long-term outlook remains bullish, but short-term volatility is expected.
BTC- the next move will shock the worldOf course, It will not go straight up like I drew, but at the end of the day, it will get there 1M, 5M, 10M per coin. DON'T MISS THIS. today's range is peny, every price below 100k is a 90% discount. It's crazy cheap!

What? Bearish Plan of BTC to day and tomorrow go to 82.000 USDBearish Plan (Scenario as per the chart):
✅ Phase 1: Breaking support
BTC has broken below the short-term trendline.
Current price is around $84,500 - $84,700.
It is expected to continue falling towards the support zone at $83,250 – $83,000, lying along the longer-term black trendline.
✅ Phase 2: Drop to strong support zone
If selling pressure continues and volume increases (which is currently indicated in the volume chart), BTC could fall further to a stronger support zone:
$82,262 (yellow support line)
$82,107 is the final support level in this scenario.
✅ Phase 3: Potential bounce
After hitting this strong support area, the chart shows a rebound arrow.
BTC may bounce slightly, retesting the $83,000 – $83,500 zone.
3. Chart Implication:
This is a short-term swing trade plan, aiming to capitalize on a strong downward move towards support.
The risk-reward ratio looks favorable with entry around $84,500, take-profit target below $82,500, and stop-loss above $85,000.
4. Conclusion:
The chart outlines a bearish expectation for today (April 18, 2025) and a continuation of the drop into tomorrow morning (April 19, 2025), targeting the $82,100 - $82,300 support zone before a potential bounce.

BTC: Quiet... but Ready to Explode?Bitcoin’s sideways grind has tested everyone’s patience — but don’t let the silence fool you. Tight consolidation like this often leads to powerful breakouts. And right now, BTC looks like it’s charging up.
📊 Technical Outlook:
BTC is sitting on strong support at 81K–83K, a level that’s sparked multiple rebounds before.
Price action has broken out of the downtrend channel and is now forming a classic accumulation box — textbook setup for an upside move.
EMAs (34 & 89) are tightening, signaling incoming volatility.
Breakout above resistance could open the door to 94K, a key untested zone.
🌐 Macro & Sentiment:
Big money is on standby after the recent crypto shakeout.
Spot Bitcoin ETFs are seeing renewed inflows after weeks of outflows.
With global interest rates cooling off, risk-on assets like BTC are back on the radar.
Trade Plan to Consider:
Look for long setups around 81K–83K support if strong bullish candles confirm
🎯 Targets: 87K → 94K
❌ Stop loss below 79K to protect your position
The breakout may not be loud — but it’s coming. The only question is… will you catch it?

Bitcoin Bybit chart analysis April 14 Hello
It's a Bitcoinguide.
If you have a "follower"
You can receive comment notifications on real-time travel routes and major sections.
If my analysis is helpful,
Please would like one booster button at the bottom.
Here is the Bitcoin 30-minute chart.
There is no Nasdaq indicator announcement today.
I created a strategy based on the possibility of a strong decline in Tether dominance centered on the Gap section at the bottom of Nasdaq and Bitcoin.
*One-way long position strategy when the red finger moves
1. 83,690.8 dollars long position entry section / cut-off price when the green support line is broken
2. 85,772.3 dollars long position 1st target -> Top 2nd -> Good 3rd target.
If the strategy is successful, I have indicated the long position re-entry section.
Today, it is best to maintain the purple support line
because it maintains the mid-term pattern and the daily candle bottom section.
The mid-term pattern can be broken from the 1st section,
and it can be a sideways market until the 2nd section,
and it can decline step by step from the bottom -> 3rd section.
Up to this point, I ask that you simply use my analysis for reference and use only.
I hope that you operate safely with the principle of trading and cut-off price.
Thank you.

BTCUSD READY TO FLY 3500 POINTS..CHECK IT WORLD CLASS ACCURACY??BTCUSD strong zone above only 85550
there is no resistance upto 89000..3500++ point
wait for active mode
Buy above 85550
Stoploss.............84600......950 points
Target1.............87000........1500 points
Target2.............89000++......3500 points
Disclaimer - This level only for education purpose . Do ur own analysis
Magic Indicator - private only script ( any one want 1 week demo for dm me in tradingview. Sent ur username )

Recommendation to sell BTC (2nd time) TP1 83.500 TP2 82.000Recommendation to sell BTC (2nd time) with the expectation that price will pull back to:
TP1: 83,500
TP2: 82,000
Some key highlights from the chart:
EMA 33 and EMA 38 are acting as support around the 81,200 and 79,245 levels.
There is a strong resistance zone around 85,000 - 85,700, where price has been rejected multiple times.
A clear accumulation zone exists between 82,000 – 83,000, suggesting that if broken, price could drop further.
A long-term descending trendline intersects the current price area → this is a very noteworthy resistance level.
If you are recommending a short position around 84,900, with a stop loss above 85,700 and targets at TP1: 83,500 and TP2: 82,000, the risk/reward ratio looks quite solid, especially if the price fails to break above the strong resistance zone.
✅ Trade Idea Summary:
Position: Short
Entry zone: ~84,900
TP1: 83,500
TP2: 82,000
Stop Loss: Above 85,700

BTCUSD READY TO 1800 POINTS FALL CHANCE BTCUSD if break below 84810
there is no suport upto 83000
curent mkt price 84990
Wait for active zone
Sell below ...............84810
Stoploss...................85150...........340 points
Target1...................84150..........660 points
Target2...................83000...........1800 points
Disclaimer - This level only for education purpose.. Do ur own analysis

BTCUSD SHOWING A GOOD DOWN MOVE WITH 1:10 RISK REWARD BTCUSD SHOWING A GOOD DOWN MOVE WITH 1:10 RISK REWARD
DUE TO THESE REASON
A. its following a rectangle pattern that stocked the market
which preventing the market to move any one direction now it trying to break the strong resistant lable
B. after the break of this rectangle it will boost the market potential for break
C. also its resisting from a strong neckline the neckline also got weeker ald the price is ready to break in the outer region
all of these reason are indicating the same thing its ready for breakout BREAKOUT trading are follws good risk reward
please dont use more than one percentage of your capitalfollow risk reward and tradeing rules
that will help you to to become a bettertrader
thank you

BTC/USD) breakout up trand analysis Read The ChaptianMr SMC Trading point update
bullish analysis of Bitcoin (BTC/USD) on the 4-hour timeframe, showing a potential breakout and rally scenario. breakdown:
---
1. Market Structure:
Downtrend Channel: Price has been moving within a falling channel.
Double Bottom Pattern: Marked by two green arrows — a bullish reversal signal.
Breakout Attempt: Price is testing the upper trendline and 200 EMA (~$83,952), suggesting possible breakout.
---
2. Key Zones:
FVG (Fair Value Gap): Around $78,678 — a demand zone where price could retest before moving higher.
Breakout Confirmation Zone: ~$85,130 — breaking above this with volume signals strength.
Target Point: $95,206 — an upside target projecting ~31.77% gain from the breakout.
---
3. Indicators:
200 EMA: Currently acting as resistance. Break above it confirms bullish momentum.
RSI: Around 60 — pointing upward with bullish divergence from recent lows, showing increasing buying pressure.
---
4. Scenarios:
Scenario 1 (Bullish Continuation):
Breaks above trendline and 200 EMA.
Retest (optional) and then heads toward $95,206 target.
Scenario 2 (Retest First):
Price dips into the FVG/demand zone.
Finds support and launches upwards, confirming a strong base.
Mr SMC Trading point
---
Summary of the Idea:
This is a buy setup on breakout or on pullback:
Aggressive Entry: Break and close above $85,130.
Safe Entry: Pullback into $78,678 area (FVG).
Target: $95,206
Risk Zone: Below $78,000 (invalidates bullish structure).
Pales support boost 🚀 analysis follow)

BTC Selling Recommendation Target Price: $83,0001. Sell Order
Sell Price Range: $84,900 - $85,000
Volume: (Adjust based on your capital allocation)
2. Target
Target Price: $83,000
Expected Timeframe: Today and tomorrow
3. Stop Loss (STP)
Stop Loss Level: $85,500
This will help limit losses if the market moves against your position.
4. Technical Analysis
Resistance: $84,900 - $85,000
Support: $83,000
EMA: Showing a downtrend
Volume: Watch for increasing selling pressure
5. Monitoring
Continuously monitor price movements and adjust your orders as needed.
Stay alert for news that may impact BTC market conditions.

"Bitcoin Bearish Reversal Setup: Supply Zone Short Strategy"🔵 SUPPLY ZONE (Resistance Area)
💥 Strong selling area around 85,800 - 87,800 USD
Historically, price got rejected here
Expect sellers to step in again
✍️ ENTRY POINT
📍 Just below the supply zone (~85,889.89)
Ideal for short position setup
Watch for bearish candlestick patterns for confirmation
🛑 STOP LOSS
❌ Placed above the supply zone at 87,796.97
Keeps risk under control if breakout happens
🎯 TARGET POINT (Support Area)
📉 Around 78,000 USD
Marked by previous support and structure
Great Risk-to-Reward ratio
📐 PATTERN WATCH
Looks like a harmonic pattern (maybe Gartley or Bat) 🦇
Suggests reversal from point D
Also resembles a rising wedge, which is bearish
📊 EMA (9-period)
🧭 Price hovering above the 9 EMA (84,704)
A break below it = bearish confirmation
Summary
🔻 Bearish bias
🛒 Short near supply zone
❌ SL above 87,800
🎯 TP around 78,000

"BTC/USD Short Setup: Supply Zone Rejection & 5% Drop Target!"BTC/USD 15-Min Chart Analysis
Trade Setup by EA_GOLD_MAN_COPY_TRADE
---
🔼 SUPPLY ZONE (Resistance)
🟣 Price Area: $83,427.80 – $84,313.06
This is where sellers might step in
Price is expected to reverse or slow down here
🔽 ENTRY POINT
🔵 Sell Entry: $83,427.80
Entering short trade just below the supply zone
Aiming to catch a reversal move down
⛔ STOP LOSS
🔴 Stop: $84,313.06
Placed above the supply zone
Limits risk in case of breakout upward
❗ Protects the trade from loss beyond this point
🎯 TARGET / TAKE PROFIT
🟣 Target: $79,071.05
Major support zone / demand area
Potential Drop: -$4,434.27 (-5.31%)
Big reward zone if price dumps from supply
📈 Trendline & Moving Averages
🔵 Blue = Likely 50 EMA
🔴 Red = Likely 200 EMA
Bullish momentum leading into the supply zone
Trendline supports the prior uptrend, now testing reversal
💡 Conclusion
✅ Trade Bias: Bearish (short)
⚖️ Risk-to-Reward: ~1:5 (Great!)
If price reacts at supply, this setup could pay big
But if it breaks up, stop loss keeps you safe

Bitcoin Trade Setup: Bullish Breakout Targeting $87K!🔹 Key Levels Identified:
📌 Target Point: 87,008.21 USD 🏁🔵
👉 Expected price move (+9.07%) 🚀
📌 Entry Point: 79,719.00 USD ✅
👉 Suggested buying level in demand zone 🏦
📌 Stop Loss: 78,213.25 USD ❌🔻
👉 Risk management level 📉
📊 Technical Analysis:
📈 Trendline Support:
🔵 The price bounced off the trendline 📊, confirming an uptrend 📈
🔵 Demand Zone:
🟦 Marked blue area = Buyer interest 📊
💰 Expected reversal zone if price retests
📊 Moving Average (DEMA 9):
🔸 82,343.85 USD (current level)
🔺 Price slightly below DEMA ➝ possible bullish reversal 🚀
⚡ Trade Setup:
✔️ Risk-to-Reward Ratio:
🟢 Potential profit: +7,220.76 USD
🔴 Risk: -1,500 USD
📊 Favorable trade setup with high reward vs low risk ✅
✔️ Momentum Confirmation:
🟢 Above 79,719 USD = 🚀 Bullish breakout
🔴 Below 78,213.25 USD = ❌ Stop Loss triggered
🔮 Conclusion:
🔥 Bullish setup if price holds demand zone!
🚀 Target: 87,008 USD
⚠️ Manage risk with stop loss! 📉

Bitcoin (BTC/USD) Technical Analysis – Bullish Setup🔵 Key Levels:
🎯 Target Point: 87,050.22 (🔼 Expected upward move)
🔵 Support Zone: 79,833.82 (🛡️ Strong demand area)
🔴 Current Price: 82,254.27
📊 Analysis:
🔵 RBS + RBR Zone (🔄 Role Reversal Support & Rally Base Rally) - Possible entry point for a long position.
🟠 Stop Loss: Below 79,833.82 (🚨 Risk Management)
🟣 Resistance Zone: Near 83,000 (🔄 Possible short-term pullback)
📈 Strategy:
1️⃣ Price might retrace to the blue zone (support) before continuing upward.
2️⃣ If it holds, 🚀 potential rally towards 87,050.22 🎯
3️⃣ If it breaks below support, ⚠️ possible downside risk.
✅ Conclusion:
A bullish setup with a 7.45% profit target 📊
Risk managed with a stop loss below support ⚠️

Trade Idea: SELL BTCUSD at 78,200 – 78,500🧠 Technical Analysis (1H Chart):
Key Resistance Zone: 78,200 – 78,500 USD
Price has consistently failed to break above this area.
Multiple rejections from this zone suggest a strong supply zone.
This area aligns with historical resistance + EMA confluence.
Trend Structure:
Price formed a lower high and shows signs of a short-term bearish reversal.
Breakdown from minor support at 77,800 confirms weak momentum.
Current price action shows hesitation with reduced buying volume.
Volume Analysis:
Large red volume bars signal strong seller presence near resistance.
Weak green candles near resistance imply exhausted buying interest.
🎯 Trade Setup:
Entry Zone: SELL from 78,200 – 78,500 USD
Stop Loss: Above 79,600 USD (just beyond strong resistance zone)
Take Profit:
TP1: 70,000 USD – major support & volume node
TP2: 68,000 USD – high probability support zone from recent base
📊 Risk-to-Reward (R:R): Approximately 1:3 to 1:4 – ideal for swing or short-term positional trades.
🚀 Follow me for more high-probability trading opportunities! 🚀

Bitcoin Bybit chart analysis April 4 Hello
It's a Bitcoinguide.
If you have a "follower"
You can receive comment notifications on real-time travel routes and major sections.
If my analysis is helpful,
Please would like one booster button at the bottom.
Here is the Nasdaq 30-minute chart.
There are indicators released at 9:30 and 12:00.
First of all, Nasdaq reached a very important point on the chart
yesterday morning.
In a situation where there is no particular movement due to Trump's tariff policy,
it continues to flow downward.
As far as I remember, the US is a country with a lot of showmanship.
I've experienced it a lot while analyzing charts.
There are two indicators released today,
The Bollinger Band monthly central line touches on the chart + two indicators released,
so there is a very high possibility that Nasdaq will go up.
In the end, it's an action and a play on words to pick up and put down the ants,
and it won't be operated to the point where the US is destroyed.
Since there is a stop loss, we proceeded very aggressively.
As you can see, in the indicator announcement time zone,
the blue finger is short->long
or the red finger is long.
The rebound from the bottom is a condition for a sweep when looking at the chart upside down, so if successful, a surge can occur.
I just applied it to Bitcoin.
This is a 30-minute Bitcoin chart.
I marked the daily closing section for each flag,
and the purple flag on the far right is next Monday.
The purple finger on the lower left
is connected to the 81,404.4 dollar entry point yesterday, April 3.
Because it is touching the center line of the Bollinger Band 12-hour chart,
you need to hold on until 9 o'clock when additional candles are created to go up more.
*One-way long position strategy when the red finger moves
1. 83,568 dollar long position entry point / stop loss price when the green support line is broken
2. 86,871.5 dollar long position 1st target -> Top 2nd target
After that, target price in order.
If the strategy is successful, the 1st section that returns
You can use the long position re-entry section
The movement within the 1st section at the top and the 2nd section at the bottom is a sideways market.
If there is a crash in Nasdaq
It can drop below the bottom
And it can drop to 79.7K 3 times over the weekend, so please take note.
Up to this point, my analysis
Please just refer to and use it
I hope you operate safely with principle trading and stop loss prices.
You worked hard this week too.
Thank you.

Btc Current Posible scenario
Please note that cryptocurrency markets are highly volatile, and prices can change rapidly. It's advisable to consult multiple sources and stay updated with the latest market trends before making any investment decisions.

BTCUSD READY TO FLY 1450 POINTS UPSIDE POSSIBLEBTCUSD strong zone above only 82940
There is no resistance upto 84400...
wait for active zone
Buy above 82940
Stoploss 82700...........240 points
Target1.............83200.....260 points
Target2..............83400.....460 points
Target3.... Risk...84400.......1460 points
Disclaimer - This level only for education and papertrade purpose. Do ur own analysis
