BTC Trading Recommendation (2nd Short Position)BTC Trading Recommendation (2nd Short Position)
📌 Pair: BTC/USD
📌 Timeframe: 15-Minute (M15)
📌 Exchange: (Hidden as requested)
Technical Analysis
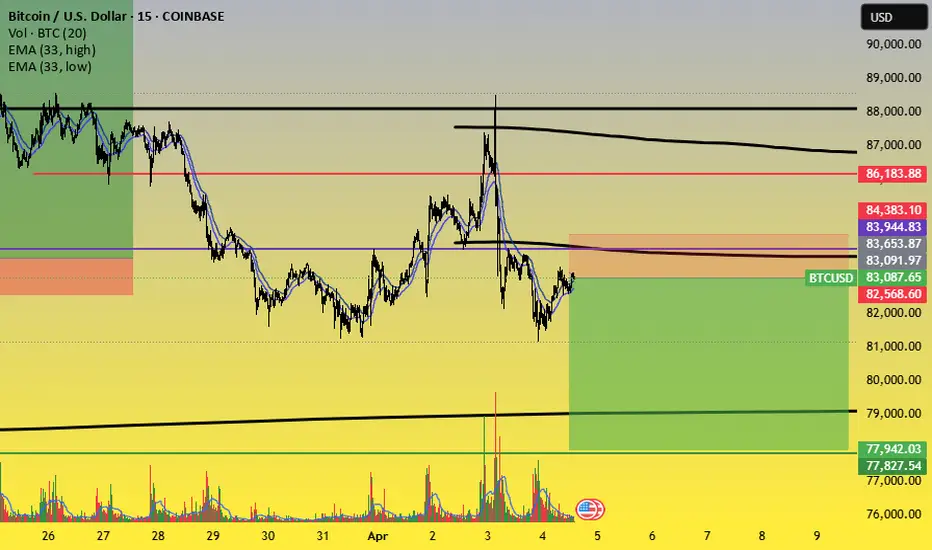
Key Resistance Levels:
83,944 - 84,383 USD (Orange Zone)
86,183 USD (Strong Resistance)
Key Support Levels:
82,568 USD
77,827 - 77,942 USD (Strong Support)
EMA Indicators:
Price is currently hovering near EMA 33 and EMA 89, indicating a consolidation phase before the next move.
Trading Volume:
Slight increase but no clear breakout direction yet.
Trading Strategy
🔻 2nd Short BTC Recommendation: Enter a sell position when the price approaches 83,944 - 84,383 USD (minor resistance zone).
🎯 Target Prices (Take Profit - TP):
TP1: 82,568 USD
TP2: 77,827 - 77,942 USD
🚨 Stop Loss (SL):
Place SL above 84,400 USD to avoid stop-hunting.
📊 Risk-Reward Ratio (R:R) is favorable (~3:1) if price follows the plan.
⚠️ Note: Manage risk properly and observe price action at resistance zones before executing the trade.
1-BTCUSD
Bitcoin (BTC/USD) Price Analysis: Bearish Breakdown Ahead?🔥 Bitcoin (BTC/USD) 1-Hour Chart Analysis 🔥
🔹 Trend Analysis:
🟡 Price was moving in an ascending channel 📈 but has broken below the trendline.
🟠 A retest of the broken trendline is happening, suggesting a potential drop 📉.
🔹 Trade Setup:
🔽 Short Entry: Expected rejection from the trendline.
❌ Stop Loss: $85,671 - $85,710 (Above resistance).
✅ Take Profit Target: $81,386 - $81,347 (Bearish target 🎯).
🔹 Indicators & Confirmation:
📊 EMA (9) at $84,254 → Acting as resistance 🚧.
🔄 Break & Retest Pattern → Typical for a bearish continuation 🛑📉.
🔹 Conclusion:
⚠️ Bearish Bias: If the price rejects the trendline, it could drop towards $81,386 🎯.
🚨 Invalidation: If the price breaks above $85,710, the short setup is canceled ❌.

BTCUSD READY TO FLY 1400 POINTS ..ONESIDE UP CHANCE Btcusd strong zone above 82400
strong above 82400 there is no resistance upto 83800
wait for active mode
Buy above 82400
Stoploss.......81950....450 points
Target1........83000....600 points
Target2........83800.....1400 points
Disclaimer- This level only for educational purpose only . Do ur own analysis

BTCUSD STRONG ABOVE 81776 TARGET 440 POINTSBTCUSD STRONG ZONE ABOVE ONLY 81776... there is no resistance upto 82215
wait for active
buy above 81776
stoploss 81530
Target1.......81950...
Target2.......82215....440 points
Disclaimer - This level only for education purpose only

Bitcoin Breaks Key SupportBTC has just broken down from an important support level, which is now likely to act as resistance around the 84,000 area. The price currently at 81,415, indicating a relatively significant breakdown.
What's particularly concerning here is that we've not only dropped below that horizontal support zone (now resistance), but we've also broken below the green ascending trendline that had been supporting price action since early March. This double breakdown (horizontal support + trendline support) strengthens the bearish case in the near term.
The chart shows that Bitcoin had been trading within a rising channel, but this recent move suggests we might be seeing a shift in market structure. Note how price already attempted a recovery after the initial breakdown but was rejected right at the underside of that previous support zone, confirming it's now acting as resistance.
Looking at the bigger picture, there's still that major resistance zone sitting around 93,000-95,000 that capped previous rallies. For longer-term bulls, the substantial support zone around 72K-74K (marked by the green horizontal area) could be the level to watch if this current weakness continues.

BTCUSD 1000 POINTS CHANCE UP STRONG ABOVE 83640 TO 84640BTCUSD strong above only 83640
current mkt price 84110
waiting for active
Buy above 83640
Stoploss 83175...465 points
Target 84640.....1000 points
Disclaimer - This level only for education purpose and paper trade . Do ur own analysis

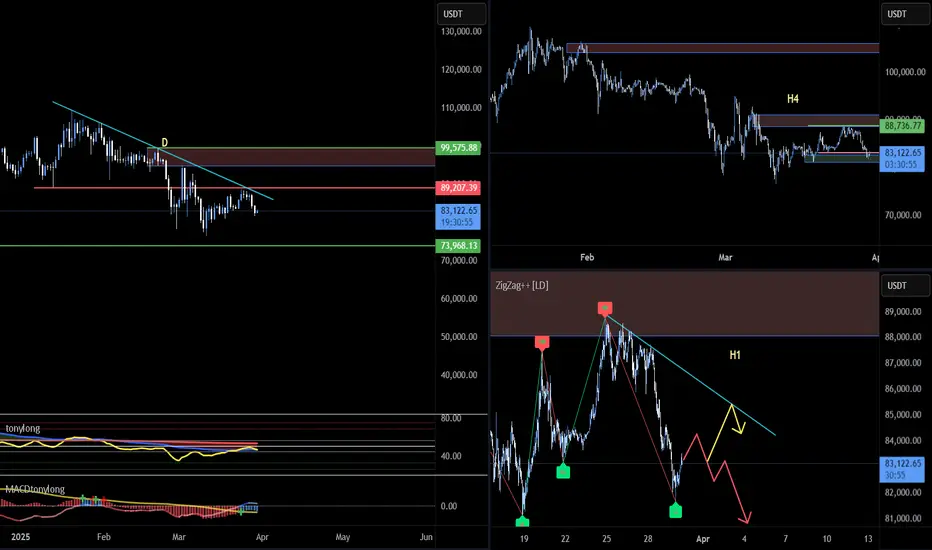
BTC23: BTC falls again. Testing support or finding a new bottom?📊 BINANCE:BTCUSD continued to decrease again in the past 2 days. Let's evaluate and look for opportunities through the multi-timeframe perspective below BINANCE:BTCUSDT :
🔹 **D Frame**: Before the price decrease in the past 2 days, we can see that although BTC had a recovery phase before, the fake decrease structure has not been broken yet.
🔹 **H4 Frame**: The keylever zone has been broken as marked on the chart, however, this is the first decrease after the increase wave in the past days, so it will need clearer confirmation.
🔹 **H1 Frame**: Currently, the price is reacting to the support zone of 81~83k. However, the price is still in a downward wave if looking at the price structure.
🚀 **Trading plan:*
📌 At the present time, we can look for a SELL position in line with the main trend in diagonal resistance areas to look for a trading position in line with the main trend. The current price is at an important support area, so it is no longer suitable to SELL at this time. BUYing in this area is not recommended when the downtrend has not shown any signs of ending. We will have to wait for a clearer signal from the price structure to properly assess the effect of the current support area.
💪 **Wishing you success in making a profit!**
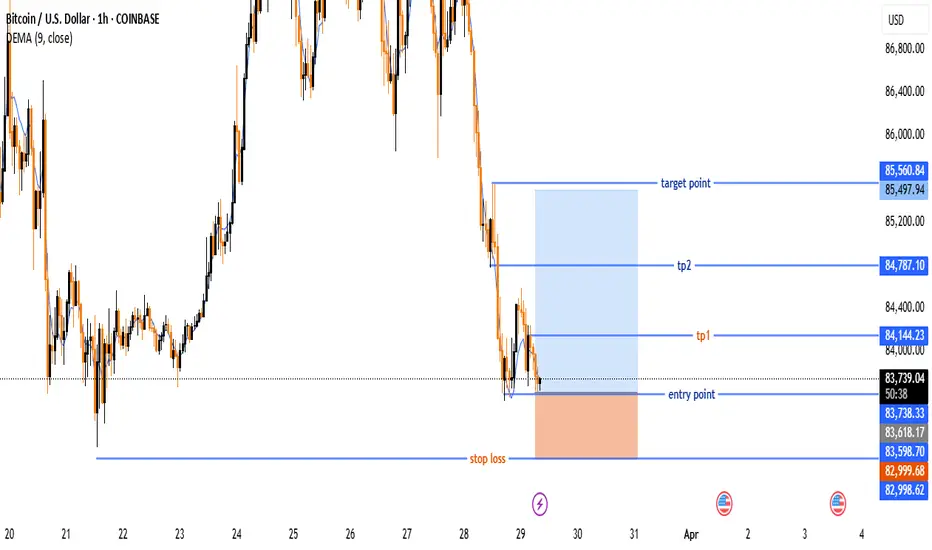
Bitcoin (BTC/USD) Trade Setup – Potential Reversal &Target Leves🔵 Entry Point:
🔹 Around $83,678.04 – The suggested buying zone.
🛑 Stop Loss:
🔻 $82,998.62 – The price level where the trade will be exited if it moves against the plan.
🎯 Target Points:
✅ TP1: $84,144.23 – First profit target.
✅ TP2: $84,787.10 – Second profit target.
🏆 Final Target: $85,560.84 – The ultimate goal for the trade.
📈 Technical Overview:
🔹 The price is at a support level, with a potential reversal to the upside.
🔹 Risk-Reward Ratio is favorable, with a clear uptrend target.
🔹 DEMA (9) at $83,776.52 indicates a possible trend shift.
Bitcoin Bybit chart analysis March 26Hello
It's a Bitcoinguide.
If you have a "follower"
You can receive comment notifications on real-time travel routes and major sections.
If my analysis is helpful,
Please would like one booster button at the bottom.
This is a 30-minute Bitcoin chart.
There is no Nasdaq indicator announcement today.
With the purple finger on the left,
I connected the long->short switching section in the existing strategy.
4-hour chart MACD dead cross imprint released.
The short-term pattern is broken and Nasdaq is moving sideways.
*Long position strategy when the red finger moves.
1. 87,141.5 dollars long position entry section / cut-off price when the green support line is broken
2. 89,177.2 dollars long position 1st target -> Top 2nd target
For those who are maintaining a short position,
Check if it breaks through the pink resistance line
The 1st section at the top and the 2nd section at the bottom are sideways sections. In particular, the first section at the top is the resistance line section of the Bollinger Band daily chart, and since it is pressed, adjustments can occur when touched.
Therefore, even if a rebound occurs at the red finger 87.1K,
if the daily candle is created tomorrow,
it should touch the first section 89.1K at the top to open the resistance line,
so that it can safely rise to the top section, right?
Since the mid-term pattern is broken from the green support line deviation,
it must unconditionally succeed in the rebound,
and it would be good to operate while watching the Nasdaq movement.
Up to this point, I ask that you simply refer to and use my analysis,
and I hope that you operate safely with principle trading and stop loss prices.
Thank you.

Ethereum (ETH/USD) – Potential Trade Setup with Attractive R:R📊 Technical Analysis:
Ethereum is moving in an upward channel on the 4H timeframe, with a key support zone at $2,015 - $2,040. Currently, the price is testing the EMA 33, indicating a potential bounce if this zone holds.
🎯 Trade Setup:
Entry Zone: $2,000 - $2,010
Take Profit (TP1): $2,150 (+6.7%)
Take Profit (TP2): $2,253 (+11.8%)
Stop Loss (SL): $1,963 (-2.6%)
Risk-to-Reward Ratio: 2.6 (TP1) and 6. (TP2)
📌 Reasons to Buy:
✅ Price retracing to a strong support level + EMA 33.
✅ Uptrend remains intact with higher lows.
✅ Attractive R:R ratio – low risk compared to potential reward.
✅ Improved market liquidity signals a return of buying momentum.
📢 Risk Management:
💰 Maximum risk per trade: 1-2% of total capital.
🚀 Don’t miss this opportunity!
📌 Follow me now for more high-quality trade ideas and insights!

Bitcoin (BTC/USD) 4H Chart Analysis: Bullish Breakout Ahead?📈 Ascending Channel:
🔹 The price is moving upward within a parallel trend channel.
🔹 Blue arrows (🔵) indicate resistance points where the price struggled.
🔹 Red circles (🔴) highlight support areas where the price bounced.
🟦 Fair Value Gap (FVG) Zone:
🔸 The blue-shaded area (FVG zone) suggests a possible retracement before a bullish move.
🔸 If the price dips into this zone, it may find liquidity and bounce back up.
📊 Projected Price Movement:
⚡ Expected pullback → into FVG zone (🔽), then a bullish push (🚀) towards $90,686.72 🎯.
🟡 Yellow arrow shows the anticipated price path.
📉 Support & Resistance Levels:
✅ Support: Around $86,000 - $86,500 (FVG zone).
🚀 Target: $90,686.72 (next major resistance).
📌 Exponential Moving Average (DEMA - 9):
🔹 The blue line (DEMA 9) at $87,414.57 is acting as dynamic resistance.
🔹 A break above this could confirm further upside movement.
💡 Conclusion:
🔸 Bullish bias remains strong 📈.
🔸 Watch for a dip into the FVG zone before a potential rally 🚀.
🔸 If Bitcoin holds support, it may reach $90K+ soon 🎯🔥.

Bitcoin Bybit chart analysis March 24Hello
It's a Bitcoinguide.
If you have a "follower"
You can receive comment notifications on real-time travel routes and major sections.
If my analysis is helpful,
Please would like one booster button at the bottom.
This is the Nasdaq 30-minute chart.
There is an indicator announcement at 10:35,
The Bollinger Band 12-hour chart is touching the resistance line,
But it has not reached the center line of the daily chart.
A gap section is created at the bottom.
The blue finger is a short->long switching strategy,
And I just applied it to Bitcoin.
Bitcoin 30-minute chart.
*Red finger movement path
Long position strategy
1. $86,837.7 long position entry section / stop loss price when purple support line is broken
2. $90,418 long position 1st target -> Good 2nd target
The 1st section at the top
is the rising wave section for today's strategy to succeed
(Section for utilizing autonomous short section)
From the 1st section touch
The probability of the strategy succeeding increases.
Refer to Nasdaq movement.
The 2nd section at the bottom seems to be around 1+4 sections
The mid-term pattern is broken from the bottom touch.
After that, the possibility of the bottom gap reversal increases, so please note
Today, since it's been a while, I'll leave it as public
and go in.
Up to this point, I ask that you use my analysis as a reference only
I hope that you operate safely with principle trading and stop loss prices.
Thank you.

Bitcoin (BTC/USD) Bullish Momentum: Key Levels and Trade Setupuddy'S dear friend 👋 SMC Trading Signals Update 🗾 🗺️
Technical Analysis:
Timeframe: 4-hour chart
Current Price: $88,244
Trend: Uptrend within an ascending channel
Supply Resistance Zone: $92,721 (Potential reversal area)
Fair Value Gap (FVG) Support Zone: $87,200 - $87,600
200 MA Resistance: Price is approaching the 200 Moving Average, which could act as resistance.
Key Levels:
1. Support:
FVG Zone (~$87,200 - $87,600) – Potential buy zone
Major Support: $86,649
2. Resistance:
$92,721 (Supply Zone) – Key target level
$90,000 Psychological Resistance
3. RSI Indicator:
Currently at 76.37, indicating overbought conditions.
A potential pullback could occur before further upside.
Mr SMC Trading point
Risk Management Strategy:
Long Entry: Near FVG Zone (~$87,200 - $87,600) if price retraces.
Stop Loss: Below $86,649 to limit downside risk.
Take Profit: Around $92,721 for a risk-reward trade.
Market Outlook:
Bitcoin remains bullish, but the RSI suggests a possible pullback before continuation.
A retracement into the FVG Zone may provide a better buying opportunity before the next leg up.
If price breaks below the FVG zone, the uptrend could weaken.
Pales support boost 🚀 analysis follow)

Bitcoin Bybit chart analysis March 19 Hello
It's a Bitcoinguide.
If you have a "follower"
You can receive comment notifications on real-time travel routes and major sections.
If my analysis is helpful,
Please would like one booster button at the bottom.
Here is the Bitcoin 30-minute chart.
There will be a Nasdaq index announcement (FOMC interest rate announcement) at 3 AM soon.
I created today's strategy based on Nasdaq.
*When the red finger moves,
One-way long position strategy
1. 83,451.4 dollars long position entry point / green support line breakaway stop loss price
2. 85,233.8 dollars long position 1st target and after autonomous short -> Top autonomous long
-> Good to up to 94,179.7 dollars long position final target price
(You can check the price if you drag the chart.)
The purple finger section at the top
is the place where you should touch first to have a high chance of success in the strategy. This is a section for autonomous shorts and rising waves,
(If it comes down right away, the safe section in the short-term rising trend is number 2)
If it breaks the 3rd sky blue support line at the bottom,
the rising trend line may break,
and since the previous low is broken from the bottom,
you should open it up to $79,712.8 by the weekend.
(Major rebound section)
Please use my analysis articles for reference only,
and I hope you operate safely with principle trading and stop loss prices.
I will see you next Monday due to personal reasons.
Thank you.

BTC#22: BTC recovers slightly. Is the bear wave over?
In the past few days, BINANCE:BTCUSD has been continuously SW in the 81~85k area. Is this a sign that BTC will rise again? Let's analyze in detail and plan a trade BINANCE:BTCUSDT :
1️⃣ **Fundamental analysis:**
📊 The IMF has included Bitcoin and other digital assets in the framework of the global economic report for the first time. This shows that BTC is being recognized as a real asset.
🚀 The probability that the US government will buy Bitcoin in 2025 is 30% with information that the Trump administration may use profits from Gold to increase Bitcoin reserves
2️⃣ **Technical analysis:**
🔹 **Frame D**: the bear wave has not shown any signs of ending. The price has been anchored in the 80~85k area for a long time, but there has been no significant fluctuation and the sign of recovery is still unclear.
🔹 **H4+H1 frame**: The current short-term price structure is temporarily increasing with the appearance of higher peaks and higher bottoms. However, the price has not surpassed the important key zone to change the main trend.
3️⃣ **Trading plan:*
📌 At the present time, the current price has no clear signs when BTC is still fluctuating continuously in the SW area. Currently, the price is in a recovery phase with the nearest target being the resistance area of 88~91k. The current area is also not good for seeking profit from BUY positions. We can wait for the price reaction to the resistance area to consider establishing a SELL position. Prioritize trading in accordance with the main trend.
💪 **Wish you success in making profits!**

Lion Indicator bitcoin 1100 points running target5 reachThis lion indicator work well on 3min and 5min and 15 mins timeframes.
Disclaimer - this indicator only for education purpose and paper trade only

A very good buying opportunity in pi network coin.PI coin is in a very good demand zone in daily time frame. Legout of the demand zone is very good. We can target 2.8 level in pi which is a supply zone. Trade has good risk to reward ratio of 1:4. Follow risk management

Bitcoin Price Action Analysis - March 20, 2025Bitcoin Price Action Analysis - March 20, 2025
Current Market Status
- Successfully closed above the resistance zone (84000-85000), which is now acting as support
- Currently in a consolidation phase after recovering from the recent drop
- The broken support trendline has been retested as resistance, with price action showing signs of strength
Technical Observations
- The yellow rectangle zone (84000-85000) has been reclaimed and is now functioning as support
- Price is forming a potential higher low pattern after the sharp decline
- The diagonal resistance line (previous support turned resistance) is still a key technical factor
- Volume patterns suggest accumulation after the recent sell-off
Updated Projections
Primary Scenario (Bullish Breakout)
- With price having closed above the 84000-85000 zone and holding it as support, the short-term outlook is turning bullish
- Next target is the 94000-95000 resistance zone (red rectangle area)
- This would represent a significant recovery and potentially signal the continuation of the larger uptrend
- The blue arrow path indicates the most likely trajectory in this scenario
Cautionary Scenario
- If price fails to hold above the 84000-85000 support zone, a retest of lower levels could occur
- The 73000 major support zone (green rectangle) remains a key level to watch if bearish pressure returns
Key Levels to Monitor
- Immediate support: 84000-85000 (yellow rectangle, now confirmed as support)
- Major support: 73000 (green rectangle, strong historical support)
- Near-term resistance: 89000-91000 (previous trendline resistance area)
- Target resistance: 94000-95000 (red rectangle area)
Trade Considerations
- Long entries near current levels with stops below 83500 offer favorable risk/reward
- The reclaimed support zone provides a logical stop-loss level
- Partial profit-taking at 91000 would be prudent, with remaining position targeting 94000-95000 or 100K level.
The successful reclaiming of the 84000-85000 zone is a significant technical development that shifts the short-term bias to bullish. If bulls can defend this newfound support, the path toward 94000-95000 becomes increasingly probable, following the blue arrow trajectory shown on the chart.

When to Buy This Bitcoin Dip - My Technical Take on current PAOn BTC ,Yesterday's bounce is worth noting, but I'm approaching it with caution. The recently broken support trendline (now visible as a diagonal resistance) will likely act as resistance in the 89-91K zone, also we have a Horizontal resistance at 83-85K which is previous support now becomes resistance .
For potential entries, I'm watching two key scenarios:
Bullish Case 1: If BTC can reclaim and close above the broken trendline (89-91K), it would suggest the breakdown was a fakeout. This could set up a potential move back toward previous highs.
Bullish Case 2: If price continues lower to the 73K major support zone (marked by the green rectangle), this could provide an excellent buying opportunity with a favorable risk/reward ratio. A strong bounce from this level could signal the end of the correction and the start of a new uptrend.

Bitcoin Bybit chart analysis March 14Hello
It's a Bitcoinguide.
If you have a "follower"
You can receive comment notifications on real-time travel routes and major sections.
If my analysis is helpful,
Please would like one booster button at the bottom.
This is the Bitcoin 30-minute chart.
There is no Nasdaq indicator announcement
It is not visible on the chart screen,
but in the analysis article on March 11,
I connected today's strategy while maintaining a long position of $79,188 at the long position entry point.
Also, there was a recent booster manipulation and the participation rate was low,
so I kept the analysis article private for the past few days,
but how was the difference compared to other analysis articles?
I wonder if you felt the gap in my analysis article.
It was not a mistake to make the analysis article public today,
but I think it would be good to see it as a small gesture of goodwill because new people supported me yesterday and today.
It is currently moving sideways after a slight upward touch,
and compared to Tether dominance, I created an aggressive strategy. The important part today is that NASDAQ only needs to move sideways
If it crashes or breaks the previous low
Be careful because Bitcoin will definitely follow
I'll summarize it very simply and briefly.
*When the red finger moves
Long position strategy
1. 82407.5 dollars long position entry section / cut-off price when the green support line breaks
(It can be pushed up to section 2 at most.)
2. 84965.5 dollars long position 1st target -> Top 2nd target
Currently, the top section is roughly the center line of the Bollinger Band daily chart.
Rather than touching this section and switching short positions
It would be better to try to re-enter after long liquidation. (The mid-term pattern is broken based on Tether Dominance)
Today, the second sky blue support line
is a safe zone where the upward rebound can be maintained
From the bottom section deviation, the next support line
is the previous low point section marked below, 77,611 dollars.
Up to this point, please use my analysis as a reference only
I hope you operate safely with principle trading and stop loss prices.
Thank you for your hard work this week.

Bitcoin Looking good here for short termBitcoin Looking good here for short term, If bulls able to hold price above 80K then we can expect a good bullish rally for short to mid term towards 95k and then 100K.

BTC#21: Fear Index Rising. Will BTC Continue to Fall? 💎 💎 💎 BINANCE:BTCUSDT BTC's decline has somewhat slowed down in recent days with a recovery from 78k. We will plan for BINANCE:BTCUSD next 💎 💎 💎
1️⃣ **Fundamental Analysis:**
📊 The Fear and Greed Index dropped to 30 today, and the level is still fear
🚀 Cumulative net inflows into US spot Bitcoin ETFs have dropped to their lowest level since January 2
📌 The market is still in a pessimistic phase about BTC's bullish outlook. The outflow of money from the market is not only due to BTC's decline but also due to concerns about an economic recession due to Trump's unstable policies.
2️⃣ **Technical analysis:**
🔹 **D frame**: BTC's downtrend has shown signs of slowing down, but the main trend in frame D is still down. We will still need to wait for the price reaction in the resistance area to confirm.
🔹 **H4 frame**: The price trend is still down. The price reaction in the support area of 78K is not as strong as before, showing that market sentiment is still leaning towards the bears.
🔹 **H1 frame**: we are in a short-term correction. The target for this correction is the resistance area of 88-91K as you can see on the chart
3️⃣ **Trading plan:*
As you can see from the multi-frame perspective, the main trend is still down, but we are in a short-term correction. We can choose to wait for the price to return to the resistance area to trade in line with the main trend or if the price has a slight recovery, set up BUY to seek profit. However, because the main trend is down, we need to stop loss fully and not be greedy when the price hits resistance because the price can return to the main trend at any time.
💪 **Wish you success in achieving profits!**

BTC AT CRITICAL LEVEL – BREAKOUT OR PULLBACK?🚀 BTC/USD – KEY BREAKOUT LEVELS AHEAD!
📌 Market Overview
Bitcoin (BTC/USD) is currently trading around $84,593, rebounding strongly from support. The price is approaching a major resistance zone at $87,049 - $89,748, where a crucial reaction is expected.
Overall sentiment remains influenced by market psychology, institutional activity, and macroeconomic factors. BTC is still trading within a descending wedge pattern, signaling that the corrective phase is not over unless a breakout occurs.
📈 Technical Analysis – Key Levels to Watch
🔹 Major Resistance Levels:
🔺 $87,049 - $89,748: A strong supply zone; a breakout here could trigger a bullish move toward $92,000+.
🔺 $90,005 - $92,000: The next target if BTC successfully clears resistance.
🔻 Major Support Levels:
🔹 $82,000 - $80,000: A short-term support zone where buyers might step in.
🔹 $78,935 - $78,000: A critical support area—losing this level could lead to a sharp sell-off.
📌 Key Observations:
If BTC fails to break $87,000, a retracement toward $80,000 - $78,000 is likely.
A confirmed breakout above $87,000 - $89,000 could signal further upside momentum toward $92,000 or higher.
🌍 Fundamental Analysis – What’s Driving BTC?
🔥 1. Institutional Demand & Market Sentiment
Market sentiment remains positive, but BTC needs stronger institutional buying to sustain further gains.
On-chain data indicates whales are accumulating BTC at lower price ranges, but resistance remains strong at $87,000.
Bitcoin ETFs are seeing steady inflows, providing fundamental support for long-term bullish momentum.
📊 2. Macroeconomic Factors & USD Impact
The DXY (US Dollar Index) is weakening, which is generally bullish for BTC.
The Federal Reserve’s monetary policy remains a key factor—interest rates are expected to stay high until mid-2025, which could slow BTC’s momentum.
Recent CPI and PPI data indicate persistent inflation concerns in the US, boosting demand for BTC as a hedge.
💰 3. Whale Activity & Institutional Moves
On-chain data reveals significant BTC withdrawals from exchanges, signaling long-term accumulation.
If large buyers continue accumulating, BTC could push above $90,000.
However, if whales take profits near resistance, BTC may retrace toward $80,000 - $78,000 before another move higher.
⚡ Trading Scenarios
✅ Scenario 1: Bullish Breakout Above $87,000
If BTC closes above $87,000 with strong volume, expect a rally toward $90,000 - $92,000.
A further push could target $95,000 if bullish momentum sustains.
❌ Scenario 2: Rejection at $87,000 - $89,000
If BTC faces resistance, expect a pullback toward $82,000 - $80,000.
A deeper correction could test $78,000, where strong support lies.
📢 Conclusion – Watch for a Critical Breakout!
📌 BTC is testing a major resistance zone ($87,000 - $89,000)—a breakout could fuel further upside.
📌 Market sentiment remains positive, but a rejection could trigger a pullback toward $80,000 - $78,000.
📌 Monitor Fed policies, institutional activity, and on-chain trends for better trade positioning.
📌 Traders should wait for confirmation before committing to a breakout or short position.
💬 Do you think BTC will break above $87,000, or is a deeper pullback coming? Share your views below! 🚀🔥
