Bitcoin (BTCUSD) Rejection – Bearish Move Incoming?📉 Key Observations:
Resistance Zone (Purple Box): Price has tested this area and faced rejection.
Bearish Projection (Gray Box & Arrow): The chart anticipates a drop towards the $76,800 - $77,000 range.
Liquidity Grab? Price might consolidate before a sharp decline.
⚠️ Possible Scenarios:
Rejection Confirmation 🔻: If BTC fails to reclaim $84,470, selling pressure could increase.
Breakout Fakeout? 🤔: A deviation above resistance followed by a dump remains a risk.
🎯 Levels to Watch:
Resistance: $84,470 - $85,078
Support: $80,000 and $76,825
🔥 Final Take: If BTC struggles below resistance, a short setup could play out. Confirmation is key!
1-BTCUSD

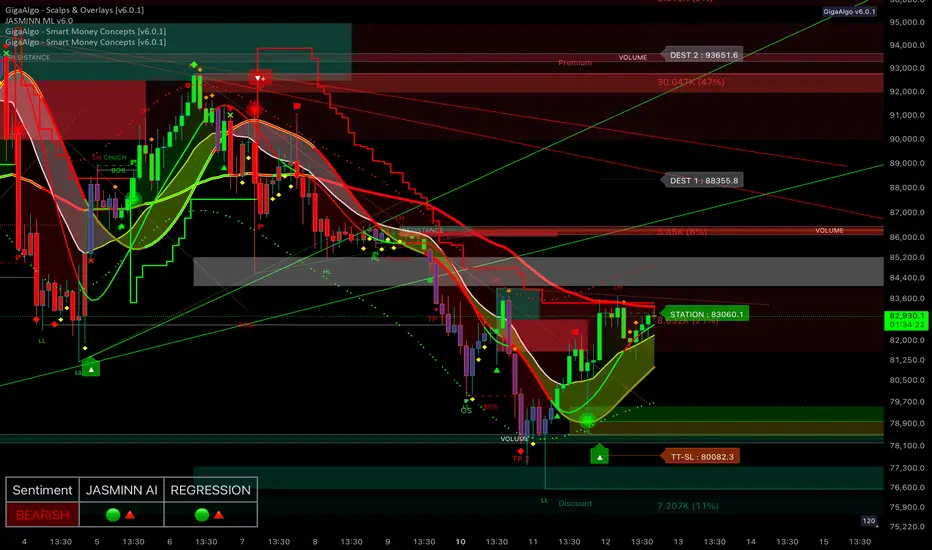
Bitcoin (BTC/USDT) 2-Hour Chart Analysis
Bitcoin is showing signs of recovery on the 2-hour chart after forming a local bottom at a key support zone. The price has bounced from a strong demand area, supported by increased buyer activity, and is currently attempting to push higher within a rising channel. The formation of higher lows (HL) and higher highs (HH) suggests that bullish momentum is building in the short term.
Despite this upward movement, the overall trend remains bearish, indicated by the dominance of red moving averages and the presence of strong resistance overhead. A major resistance zone sits above the current price level, marked by significant volume and selling pressure. The sentiment remains bearish, as confirmed by the red signal on the sentiment panel, although JASMINN AI and regression tools are showing early signs of potential upward strength.
If the price manages to break above the resistance zone and hold, the next upside target lies near the destination levels identified on the chart. However, failure to maintain upward momentum could result in a pullback toward the previous support zone, where buyers are likely to step in again. The key to further upside will be a decisive break and close above the resistance, supported by rising volume and bullish momentum. The overall market outlook remains cautiously bullish in the short term but within a larger bearish trend.
Bitcoin Bybit chart analysis March 11Hello
It's a Bitcoinguide.
If you have a "follower"
You can receive comment notifications on real-time travel routes and major sections.
If my analysis is helpful,
Please would like one booster button at the bottom.
This is the Bitcoin 30-minute chart.
There will be a Nasdaq indicator announcement at 11 o'clock shortly.
As long as the Nasdaq doesn't crash,
it will continue to crash + forced coupling,
so it is not easy to analyze.
In this case, it is recommended to operate with a tight stop loss,
and since Bitcoin broke its previous low with yesterday's movement,
I created a strategy based on the major rebound section of 75,459.5 dollars at the bottom this week.
*When the blue finger moves,
it is a two-way neutral long->short switching strategy
The section from 1 to 83,529 dollars at the top is an autonomous short section.
You can operate based on the center line of the 4-hour chart that will be additionally created at 9 o'clock shortly.
For example, if a rebound is connected before 9 o'clock, it is the purple finger.
If a rebound occurs after 9 o'clock, it is the 1st section.
If it comes down immediately without touching, it is good to operate the long position waiting until the 2nd section at the bottom.
1. 80365 dollar long position entry section / stop loss price when the purple support line is broken
(If it comes down immediately without touching the short position entry section at the top, 83529 dollar long position 1st target -> short position autonomous section)
2. 84965 dollar long position target price -> 83529 dollar autonomous long position operation section
(Since it is the center line of the 6-hour chart, if it reaches this section, it is highly likely to continue to rise.)
After that, the target price is in the order of Gap9 -> Good -> Great,
but short position switching is done from the touch of the center line of the daily chart.
If it comes down right from the current position,
2 -> Look at Bottom
From Gap7, the previous low is broken again
It is good to operate it as a major rebound section up to $75,459.5 this week.
More than anything else, Nasdaq is the problem.
Since Bitcoin has a fast turnover rate
As long as Nasdaq doesn't crash/crash/crash, it's fine.
Please use my analysis up to this point as a reference only
I hope you operate safely with principle trading and stop loss prices.
Thank you.

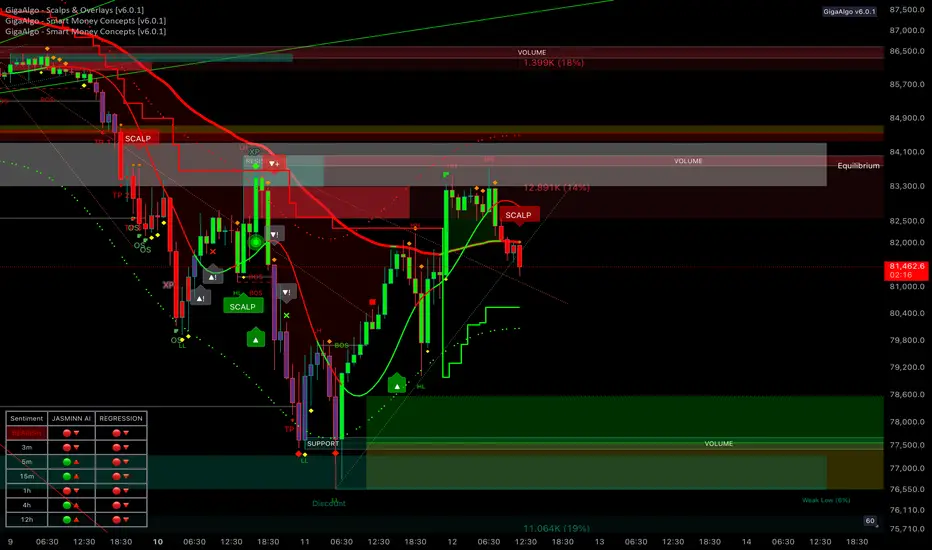
Bitcoin (BTC/USDT) 1-Hour Chart Analysis
Bitcoin is showing signs of bearish pressure on the 1-hour chart after a recent rejection from a key resistance zone. The market structure reflects a mixed trend, with signs of higher and lower lows indicating ongoing volatility. A recent break of structure and expansion suggest that the market is at a turning point.
There’s a clear resistance zone where sellers have stepped in, creating strong selling pressure. On the other hand, a support zone below shows signs of buyer interest, which could act as a floor if the price continues to decline. The equilibrium point near the middle of this range represents a potential decision area for future price movement.
Market sentiment remains bearish across multiple timeframes, reinforcing the downside bias. If the price continues to reject resistance, it could drop toward the support zone, with further downside possible if buyers fail to hold the level. Conversely, a breakout above resistance could signal renewed bullish momentum and lead to higher levels. The current outlook remains bearish, with selling pressure dominating near resistance and moderate buyer interest at support.
Very good shorting opportunity in btc. Setup explained Btc is falling from 1hour supply zone. It has failed rmed M pattern also. Good risk reward trade. Manage risk

BTC/USD Breakdown! Bearish Target: $78K🔍 BTC/USD 30-Minute Chart Analysis
📉 Market Structure:
The chart displays an ABCDE corrective pattern, likely a descending wedge or contracting triangle, which has now broken to the downside.
Price action shows a breakout below the wedge, leading to further bearish momentum.
The 200-period moving average (red line) is acting as resistance, reinforcing the downward trend.
📊 Current Price: ~$83,057
🔻 Bearish Target: $78,049 (marked as the potential support level)
🛑 Key Observations:
Rejection from wave E indicates a lack of bullish strength.
Lower highs and lower lows confirm a continuation of the bearish trend.
Potential retest of ~$85,000 before dropping further.
🚀 Trading Insights:
Bearish Bias: Short opportunities on pullbacks toward resistance.
Bullish Reversal? Look for price action near $78,049—if buyers step in, a potential bounce could occur.
⚠️ Watch out for:
Sudden Bitcoin volatility (news-driven moves).
A fake breakdown (if buyers reclaim above ~$85,000).

Bitcoin Bybit chart analysis March 10Hello
It's a Bitcoinguide.
If you have a "follower"
You can receive comment notifications on real-time travel routes and major sections.
If my analysis is helpful,
Please would like one booster button at the bottom.
This is the Bitcoin 30-minute chart.
There is no Nasdaq indicator announcement today.
The trend has been brought forward by one hour due to the application of US Daylight Savings Time.
If only the Nasdaq low is not broken and
It moves sideways, there will be no crash in Bitcoin.
I created today's strategy based on the Gap9 section retracement at the top.
*When the blue finger moves,
It is a two-way neutral strategy.
1. 81826.5 dollars long position entry section / stop loss price when the blue support line is broken
2. 86234 dollars long position target price
After that, from section 1 -> 87428.5 dollars -> Great
As indicated, it would be good to use short->long switching.
Up to this section, it seems more advantageous to liquidate long and then re-enter long than short. (Tether Dominance 4+6+12 MACD Dead Cross Possibility)
The center line of the Bollinger Band daily chart
is the final short position switching point.
(Approximately $90,418)
If the Bottom section is broken today according to the movement of Nasdaq,
Bit will also break the previous low point
and it may fall strongly to 3 -> Gap7.
For those who can check the drawing section,
I have marked today's major rebound section near Gap7, so please refer to it.
Up to this point, please use my analysis as a reference only
Please operate safely with principle trading and stop loss price.
Thank you.

BTCUSDTBINANCE:BTCUSDT
As you can see in BTCUSDT was consolidation upto 1day so either side breakout we can take a trade and expect up to 5% movement. Takr retest entries to avoid falls breakouts and plan your trade accordingly.

Bitcoin Bybit chart analysis March 7Hello
It's a Bitcoinguide.
If you have a "follower"
You can receive comment notifications on real-time travel routes and major sections.
If my analysis is helpful,
Please would like one booster button at the bottom.
Bitcoin 30-minute chart.
There will be a Nasdaq index announcement at 10:30 in a little while,
6-hour chart MACD dead cross is in progress.
*Red finger movement path
Long position strategy
1. 88,624 dollars long position entry section / cut-off price when purple support line is broken
2. 1st section at the top 1st target -> Top 2nd -> Target in order during the weekend
1st section at the top pink resistance line / green support line sideways to 3rd section
There is a possibility of additional decline from bottom breakout
Please check 4th section at the bottom -> 80,118.5 dollars
Thank you.

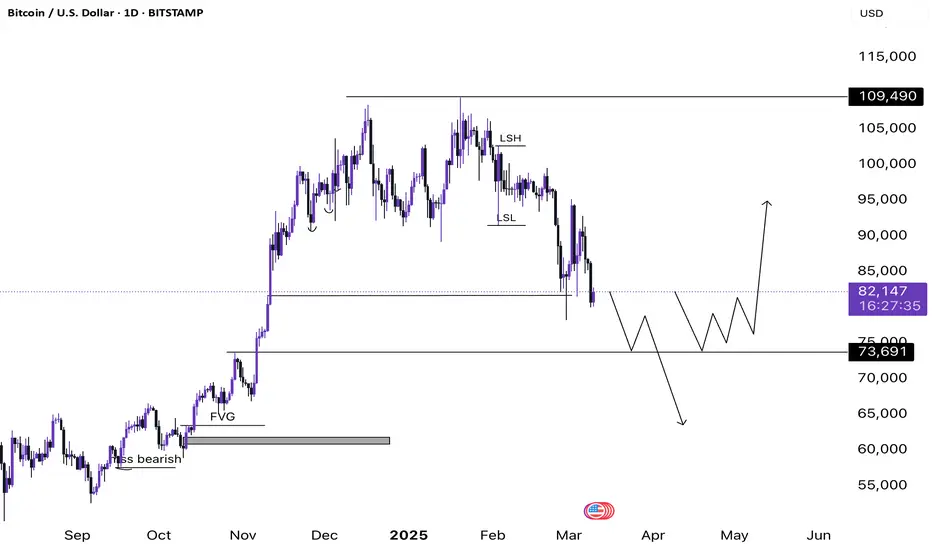
Bitcoin 1D Bear Market Technical Analysis - Bitcoin is currently trading at 82,249$
- Bitcoin has so far erased 24.98% from its All Time Highs and especially after Trump's presidency.
- Market Structure shift looks completely bearish, unless we flip above 96,000$ on a daily timeframe
- We have many inefficiencies left until 73,691$ and I have drawn those paths as well.
- The first path shows price filling the inefficiency and then taking out more liquidity to fall further and clear the fair value gap sitting at about 63,329$
- The second path shows we might not not fall below 73k after filling the inefficiency rather we start building a base before moving towards the upside.
- Market doesn't look good from a structure perspective be very selective when it comes to punching trades.
BTC USD Trading & Investing [Status Update --- Not an Advise]BTC USD Trading & Investing
We get into the current status and take a look at what is happening in the Crypto world, especially BTC coin.
Checked on Weekly and Daily.

Possible Elliott Waves Counts of BITCOINHello friends, today we're analyzing the Bitcoin chart based on Elliott Wave Theory. We're using a 4-hour chart, where we can clearly see that we've completed the intermediate degree 3rd, 4th, and 5th waves means the completion of the primary degree ((3)) wave marked in black. After that, we completed another primary degree ((4)) wave marked in black.
Currently, we're moving upwards, which should be the primary degree ((5)) wave, containing five sub-divisions marked in blue as (1), (2), (3), (4) and (5) We've almost completed the (1) sub-division and are nearing the completion of the (2) sub-division.
According to Elliott Wave Theory, if the recent low wave ((4)) at around $70,200 holds and doesn't break below, the price has the potential to reach new highs towards $110,000 to $120,000. This analysis is entirely based on Elliott Wave Theory and its structure.
In this study we used Elliott Wave Theory & Structures, here we have plotted possible wave counts on daily time frame chart of DXY Dollar Index, it involves multiple possibilities, and the analysis presented focuses on one potential scenario. The provided information is for educational purposes only, not trading advice. There's a risk of being completely wrong.
I am not Sebi registered analyst.
My studies are for educational purpose only.
Please Consult your financial advisor before trading or investing.
I am not responsible for any kinds of your profits and your losses.
Hope this post is helpful to community
Thanks
RK💕
Disclaimer and Risk Warning.
The analysis and discussion provided on in.tradingview.com/u/RK_Charts/ is intended for educational purposes only and should not be relied upon for trading decisions. RK_Charts is not an investment adviser and the information provided here should not be taken as professional investment advice. Before buying or selling any investments, securities, or precious metals, it is recommended that you conduct your own due diligence. RK_Charts does not share in your profits and will not take responsibility for any losses you may incur. So Please Consult your financial advisor before trading or investing.

BTC#20: BTC Analysis: Price SW In Triangle – Next Direction?💎 💎 💎As analyzed in the previous article, BINANCE:BTCUSDT gave a bad price reaction when touching the old resistance area of 95~96x. The current price is SW in the triangle. Let's analyze the next plan BINANCE:BTCUSD : 💎 💎 💎
1️⃣ **Fundamental analysis:**
📊President Donald Trump signed an executive order to establish a Strategic Cryptocurrency Reserve that includes 200,000 BTC seized in criminal or civil cases. It will be held as a reserve asset and not sold. In addition, the Government will not purchase additional assets for the reserve.
🚀The Treasury and Commerce Departments may consider budget-neutral Bitcoin purchases. Agencies must provide full accounting books of digital assets to the Ministry of Finance. Regulatory crackdowns on crypto assets are ended
📌 From the above information, it can be seen that BTC and the top 5 coins in the market have been officially recognized as an asset. The legal framework will take time to complete. However, BTC will receive more attention and attention when the US government makes any purchase moves to hoard. This will lead to a huge demand for BTC in the near future.
2️⃣ **Technical analysis:**
🔹 **D Frame**: The price structure is still bearish, we have had a recovery phase to retest the resistance area and give a bad price reaction. It is entirely possible that BTC will go down to the support zone below
🔹 **H4 Frame**: We can see the price reaction more clearly. The continuous reaction of lower peaks in this area shows that the market sentiment is still dominated by the bears even though BTC has been recognized as a reserve asset.
🔹 **H1 frame**: The price is still SW in the triangle area in recent days. The price range is gradually narrowing as shown on the chart
3️⃣ **Trading plan:*
⛔ At the present time, it is no longer suitable to wait for a BUY position. The price has tested the resistance area and reacted badly, so there is a high possibility that there will be a correction below the support area below at any time.
✅ The top priority is to trade in accordance with the main trend in the SELL direction. Although the information about the Reserve Fund has given a positive response, the government not buying more assets for the reserve is also a sign that short-term cash flow will be difficult to push into BTC, especially when tariff policies are giving negative reactions to the economy.
💪 **Wishing you success in achieving profits!**

BTC/USD TECHNICAL ANALYSIS – WHAT’S NEXT?📌 Timeframe: 2H
BTC/USD is currently trading within a symmetrical triangle pattern, signaling a phase of accumulation before a potential major breakout.
📈 TREND ANALYSIS & KEY PRICE LEVELS
1️⃣ Current Trend
BTC is trading around $86,301, moving within a narrowing price channel.
Price is caught between the ascending trendline support and the key resistance zone at $90,000 - $92,000.
A breakout above this zone could trigger a strong bullish move towards $98,000+.
Conversely, a failure to hold support may push BTC down to $82,764, with further downside potential towards $78,000 - $80,000.
2️⃣ Key Levels to Watch
🔺 Major Resistance Levels:
$90,000 - $92,000: Strong resistance; a breakout here could lead to a rally.
$98,000: The next target if BTC successfully breaks above resistance.
🔻 Major Support Levels:
$82,764: Closest support; a breakdown could trigger further downside.
$78,000 - $80,000: A strong demand zone that could provide a solid bounce if BTC dips further.
📉 POTENTIAL TRADING SCENARIOS
📌 Scenario 1 – Bullish Breakout 🟢
If BTC breaks above $90,000 - $92,000, it could confirm a bullish trend continuation toward $98,000+.
Watch for strong volume confirmation and a clear close above resistance.
📌 Scenario 2 – Bearish Rejection 🔴
If BTC fails to break $90,000 - $92,000, it could retrace to $82,764.
A further break below this level could send BTC down to $78,000 - $80,000 before finding strong support.
⏳ CONCLUSION – PREPARE FOR A BIG MOVE!
📊 BTC is in a critical accumulation phase, setting up for a major breakout soon.
📈 If BTC clears $90,000 resistance, the bullish trend will likely continue toward $98,000+.
📉 If BTC rejects and drops below $82,764, a deeper correction to $78,000 is possible.
⚠ Traders should wait for a clear breakout signal & manage risk carefully ahead of the big move!
📢 Do you think BTC will break out or correct further? Share your thoughts below! 🚀🔥

Bitcoin Bybit chart analysis March 6Hello
It's a Bitcoinguide.
If you have a "follower"
You can receive comment notifications on real-time travel routes and major sections.
If my analysis is helpful,
Please would like one booster button at the bottom.
This is the Bitcoin 30-minute chart.
There will be a Nasdaq index announcement at 10:30 in a little while.
At the bottom left is the long position entry point on March 5th.
The purple finger is connected to $88,407.
*Red finger movement path
One-way long position strategy
First wave check in section 1 at the top
1. Long position entry section of $90,698 / Stop loss price when purple support line is broken
2. Long position 1st target of $94,236.5 -> Gap8 2nd target
(Today's 4-hour chart, 12-hour chart resistance line section is $94,236.5
Since we don't know how much the adjustment will come out, it's okay to use a short position.)
3. After long profit cut, section 1, $91,884.5 long position utilization section
After that, long position target price in order of Top -> Good section.
Section 1 at the top
If there is an adjustment after the touch, a short->long movement will occur in NASDAQ
and it is more advantageous to wait for a long than a short,
and Section 2 at the bottom is a safe long position entry section where a short-term pattern is maintained.
From Section 3, there may be an additional decline,
so it would be good to check Bottom -> $83449.5 as indicated.
My waist and shoulders are not so good
I will enter early here today
Please use my analysis article as a reference only
Don't forget the 6 principles of trading and the essential stop loss price
and operate safely
Thank you.

BTCUSD: Trendline Support vs. Key Resistance - What's Next ?Previous Support Turned Resistance: The 91,000-93,000 range that previously acted as support has now flipped to resistance, confirming a classic price action principle.
Diagonal Trendline Support: Currently, price is respecting an upward diagonal trendline (marked by the red lines on the chart), providing short-term support.
Market Structure:
Bitcoin experienced a sharp drop from the 96,000 level in late February
Price found a bottom around the 80,000 mark before forming the current ascending trendline
Recent price action shows a series of higher lows along this trendline, suggesting potential bullish momentum building
Trading Outlook:
As long as price remains above the diagonal trendline support, we can expect a continued move higher
Immediate target would be a retest of the 91,000-93,000 resistance zone and if price sustain above this then more upisde possible.
A successful break above this resistance could signal a resumption of the larger bullish trend
However, a break below (Close on daily) the trendline support would invalidate this bullish scenario

Bitcoin trade Idea #BTC 📌 Trading Plan (Bearish Bias Near Resistance)
Based on current price action , I am bearish near resistance ($94,500-$97,000) and looking for a short setup if BTC shows signs of rejection. However, I will also consider a long on a dip if BTC pulls back into a bullish order block.
---
1️⃣ Primary Setup: Short Near Resistance (Bearish Bias)
📉 Bias: Bearish at $94,500-$97,000 (Key Liquidity Zone & Bearish OB)
✅ Entry: $94,500-$97,000
🎯 Target 1: $92,500 (Liquidity Pool)
🎯 Target 2: $90,500 (Bullish OB & Prior Breakout Zone)
🛑 Stop-loss: Above $98,000 (-1R)
📊 Risk-to-Reward (R:R): 2R to 5R, depending on exit.
Reasoning:
Buy-side liquidity sits above $94,500-$97,000, making it a prime area for smart money to distribute and reverse.
Bearish Order Block (OB) could act as resistance.
If DXY finds support, BTC could struggle to break higher.
---
2️⃣ Alternative Setup: Long on Dip (Only If Retest of Bullish OB)
📈 Bias: Bullish only on a retrace to demand zone.
✅ Entry: $90,500-$91,000 (Bullish OB)
🎯 Target 1: $94,500 (Liquidity Target)
🎯 Target 2: $97,000 (Major Resistance)
🛑 Stop-loss: Below $89,500 (-1R)
📊 Risk-to-Reward (R:R): 3R to 6R, depending on exit.
Reasoning:
Bullish OB at $90,500-$91,000 is a high-probability long zone.
If DXY stays weak, BTC could push higher before rejecting.
Liquidity grab below $91,000 could fuel a rally to $94,500+.
---
🔥 Execution Plan
✅ Main Focus: Shorting near resistance ($94,500-$97,000) unless BTC shows strong continuation.
✅ Secondary Plan: If BTC pulls back first, I will consider a long at $90,500-$91,000 for a move up.
✅ Stop-Loss Discipline: Cutting trades quickly if invalidated to protect capital.
---
📌 Final Thoughts
Primary Bias: Bearish near resistance.
Waiting for confirmation (e.g., rejection wicks, market structure shift) before shorting.
Long setup is only valid if BTC dips into demand first.

Bitcoin Bybit chart analysis March 5Hello
It's a Bitcoinguide.
If you have a "follower"
You can receive comment notifications on real-time travel routes and major sections.
If my analysis is helpful,
Please would like one booster button at the bottom.
This is the Bitcoin 30-minute chart.
There is an indicator announcement at 12 o'clock on Nasdaq.
Yesterday, based on Tether Dominance, the 4-hour chart was maintaining a thin line above the center line,
so it is rebounding strongly as expected, coupled with the Nasdaq rebound.
It is very difficult to make an entry point again today.
Yesterday, Nasdaq touched the Bollinger Band weekly chart support line, so I judged this week to be a major rebound section.
(It is good that the support line is supporting it.)
At least, Bitcoin followed the trend according to the possibility of a sideways movement without a plunge.
*Red finger movement path
Long position strategy
1. $88,407 long position entry section / cut-off price when purple support line is broken
2. $96,005 1st target -> Top section 2nd target
After liquidation, bottom section 1 long position re-entry section / cut-off price autonomous
Today's long position entry section is
30-minute support + 1-hour central pattern that returns.
(Today's first wave)
I explained most of the key points of the strategy yesterday.
The reason I focused on the long position today is
The daily chart MACD golden cross is in progress,
*In the case of Tether dominance, it is a daily central line + 12-hour chart support line pattern,
but since the mid-term pattern is broken and the daily chart central line is the second touch, I thought it was highly likely to be pushed by force.
Section 1 at the top and section 2 at the bottom are sideways.
Because the downward direction is open from the bottom section,
it can flow up to section 3.
Up to this point, I ask that you simply use my analysis for reference and use only,
and I hope that you operate safely with principle trading and stop loss prices.
Thank you.

BTC Down Side expected moveBTC move bellow the mark line , wait for candle close for entry.
must use SL for further trades in future.
📉🔻🔻🔻

Bitcoin Bybit chart analysis March 4Hello
It's a Bitcoinguide.
If you have a "follower"
You can receive comment notifications on real-time travel routes and major sections.
If my analysis is helpful,
Please would like one booster button at the bottom.
This is the Bitcoin 30-minute chart.
There is no Nasdaq indicator announcement.
In the analysis I left today,
I would be grateful if it moves sideways without breaking the green support line.
Today's two main points of view are
Whether the 12-hour chart MACD dead cross is in progress
and
The Tether Dominance 4-hour chart center line is above
The thin section of the cloud (possibility of a crash).
I thought it would be complicated if I explained it in both directions,
so I approached it very simply.
It is an ambiguous position before the decline in Tether Dominance (tail section when taking a short position in a plunge)
Bitcoin also touched the support line of the 2-hour Bollinger Band chart today
(additional downtrend or sideways section)
Since there was no short position entry position today,
we proceeded with the final sweep (plunge) of Tether Dominance in line with the 12-hour chart MACD dead cross imprint from 9 PM to 9 AM when the 12-hour candle is created.
If you don't understand, please read it repeatedly.
*When the blue finger moves,
it is a short position strategy
short->long switching strategy.
1. $85,584.5 short position entry section / stop loss price when breaking through the pink resistance line
(The pink resistance line section is the center line of the 4-hour Bollinger Band chart based on Tether Dominance,
but since it is the order of the 4-hour chart MACD dead cross and the positive cloud is maintaining thin,
you should be careful because it can rise strongly when breaking through this section.)
2. $80,103 long position switching section / stop loss price when breaking through the blue support line
(A strong rebound before and after breaking through the blue support line is sweeping through Tether Dominance -> a crash condition.)
3. $86,935.5 long position 1st target
-> After the 12-hour chart MACD dead cross is imprinted, the 2nd target price is the top section
Currently, in Tether Dominance, the 6+12 pattern has touched the daily center line, so the mid-term pattern It's broken.
From reaching the top section, continue to maintain a long position
If the condition is Tether Dominance
Based on the recovery of the 12+ daily pattern
You can see the resistance line of the Bollinger Band 12-hour chart -> near the daily central line.
(Here, take profit and final short switching depending on the situation)
If there is no rebound in the bottom section today
You should look at the 2nd section from Gap7 at the bottom
And if it continues to fall, this week's major rebound section
I will organize it again later.
Please use my analysis article for reference and use only
I hope you operate safely with principle trading and stop loss prices.
Thank you.

M2 Money Supply 45 Day adjusted - BTCM2 Money Supply 45 Day adjusted BULLISH!!!!! If you adjust the M2 money supply by 45 days, it can possibly predict the future price action of Bitcoin and crypto.

BTC#19: “Cryptocurrency Reserves” and trading plants💎 💎 💎 After Trump posted about his plan to put BTC into the national cryptocurrency reserve, BINANCE:BTCUSDT BINANCE:BTCUSD had a meteoric rise back to 93~95x. Let's plan to trade BTC: 💎 💎 💎
1️⃣ **Fundamental Analysis:**
📊 The current market is dominated by “US crypto assets”.
🚀 Trump: Will put BTC into the national reserve, this will help the crypto sector break out. However, it is also important to note that the US lacks budget support and crypto reserves are just empty words at present.
📌 The probability of the Fed keeping interest rates unchanged in March is 93%.
It can be seen that the current cash flow injected into the market is not really significant because interest rates have not yet decreased and the US tariff policy is still waiting to cause an economic war. Current news plays a role in restraining the downward momentum and fear in the recent past.
2️⃣ **Technical analysis:**
🔹 **Frame D**: it can be seen that the price is looking for an important resistance area. Note that the current price structure is decreasing, so the price can still turn around at any time when it touches the diagonal resistance zone.
🔹 **Frame H4**: It is clear that yesterday's increase has not yet had any technical recovery to be able to break through the current resistance zone.
🔹 **Frame H1**: Temporarily, the price is still in an upward trend influenced by yesterday's positive news. The previously broken trendline will act as an important support for the price to break out in the near future
3️⃣ **Trading plan:*
⛔ The current area is no longer ideal for establishing a trading position, if the price still has no recovery, we can consider looking for a SELL position when the price reaches the diagonal resistance area when a price structure appears on a smaller time frame. BUY should only be made if the price recovers and accumulates in the old resistance area and an increasing price structure appears on a smaller time frame.
✅ On the D and H4 time frames, the price structure is still bearish, besides, H1 has increased strongly without any technical recovery due to the influence of positive news. So we can completely wait for a trading opportunity when the price finds an important resistance and support zone.
💪 **Wishing you success in achieving profits!**

BTCUSD SHOWING A GOOD DOWN MOVE WITH 1:10 RISK REWARD BTCUSD SHOWING A GOOD DOWN MOVE WITH 1:10 RISK REWARD
DUE TO THESE REASON
A. its following a rectangle pattern that stocked the market
which preventing the market to move any one direction now it trying to break the strong resistant lable
B. after the break of this rectangle it will boost the market potential for break
C. also its resisting from a strong neckline the neckline also got weeker ald the price is ready to break in the outer region
all of these reason are indicating the same thing its ready for breakout BREAKOUT trading are follws good risk reward
please dont use more than one percentage of your capitalfollow risk reward and tradeing rules
that will help you to to become a bettertrader
thank you
