Bitcoin Analysis (30 Minutes Time Frame)This article analyzes potential future price movements for Bitcoin. My analysis indicates that a breach of the $94,000 support level would likely trigger a downward trend, with the next support zone anticipated at $92,500.
1-BTCUSD

BITCOIN NEXT POSSIBLE MOVE (30 MINUTES CHART ANALYSIS)This article analyzes potential future price movements for Bitcoin. My analysis indicates that a breach of the $94,000 support level would likely trigger a downward trend, with the next support level anticipated at $92,500.
Note: I am not a certified trader. Use this analysis on your own risk.

Building Emotional Intelligence in Trading: Your Edge for 2025
Emotional intelligence (EQ) is often the unsung hero of successful trading. It involves understanding your emotions and those of others to enhance decision-making, manage stress, and navigate the often tumultuous financial markets. Here's how to leverage EQ to improve your trading outcomes in the coming year:
1. Self-Awareness - Know Your Emotional Triggers:
Concept: Recognize what emotions drive your trading decisions. Are you prone to fear, greed, or overconfidence?
Application: Keep a trading diary where you note not just your trades but your emotional state before, during, and after each transaction. This can reveal patterns in how emotions affect your trading.
2. Self-Regulation - Control Impulsive Reactions:
Concept: Manage your reactions to market movements to avoid knee-jerk trades.
Application: Set pre-defined rules for when to trade and when to step back. Use techniques like deep breathing or stepping away from the screen to calm down during high volatility.
3. Motivation - Stay Driven by Your Goals:
Concept: Use intrinsic motivation to keep your focus on long-term goals rather than short-term gains or losses.
Application: Define clear, long-term trading objectives and remind yourself of these goals when facing setbacks. Celebrate small wins to maintain motivation without becoming complacent.
4. Empathy - Understand Market Sentiment:
Concept: Gain insight into how others perceive the market, which can be as crucial as technical analysis.
Application: Monitor market sentiment through news, social media, and community discussions. This broader perspective can help you anticipate market moves based on collective behavior rather than just individual analysis.
5. Social Skills - :
Concept: Build and leverage relationships with other traders for mutual growth and support.
Application: Engage in trading communities, share your insights, and learn from others. Networking can provide emotional support, new strategies, and a sense of belonging which is vital during tough market conditions.
Practical Steps for Enhancing EQ in Trading:
Regular Reflection: Dedicate time weekly to reflect on your emotional responses to trades. What went well emotionally? What could be improved?
Mindfulness Practices: Incorporate mindfulness or meditation into your routine. This can aid in maintaining focus and managing stress, both critical in trading.
Emotional Check-ins: Before making a trade, do a quick emotional check. Are you feeling pressured, excited, or calm? Adjust your approach accordingly.
Scenario Planning: Visualize different market scenarios and your emotional responses to them. This mental preparation can help in real-time decision-making.
Continuous Learning: Read about behavioral economics or psychology related to trading. Books like "Thinking, Fast and Slow" by Daniel Kahneman can offer profound insights.

Bitcoin - testing Support again at 93KBTC is still in megaphone pattern and once again testing the lower side of the pattern for confirmation of the support. if this second time holds good chances of BTC to make more upside moves Bitcoin and all other cryptos are very volatile, risky and great profit giving asset to be bought for short, medium or long term great profits. For trading one need to have enough margins to handle any volatility. For trading use only 40% for taking positions and use 60% to hold for any volatile movements.

BTCUSD SHOWING A GOOD UP MOVE WITH 1:6 RISK REWARD BTCUSD SHOWING A GOOD
UP MOVE WITH 1:6 RISK REWARD
DUE TO THESE REASON
A. its following a rectangle pattern that stocked the market
which preventing the market to move any one direction now it trying to break the strong resistant lable
B. after the break of this rectangle it will boost the market potential for break
C. also its resisting from a strong neckline the neckline also got weeker ald the price is ready to break in the outer region
all of these reason are indicating the same thing its ready for breakout BREAKOUT trading are follws good risk reward
please dont use more than one percentage of your capitalfollow risk reward and tradeing rules
that will help you to to become a bettertrader
thank you

BTC - 102, 104 ?In my opinion BTC is still Bullish and expecting a parabolic up move anytime soon. one news or other coming and loose hands booking profits while big hands slow silently buying and not in a hurry. In chart shown the false breakout of resistance line which I think is for grabbing liquidity.
Still price is inside loudspeaker lines price will keep rising and falling till anyone of this line breaks.

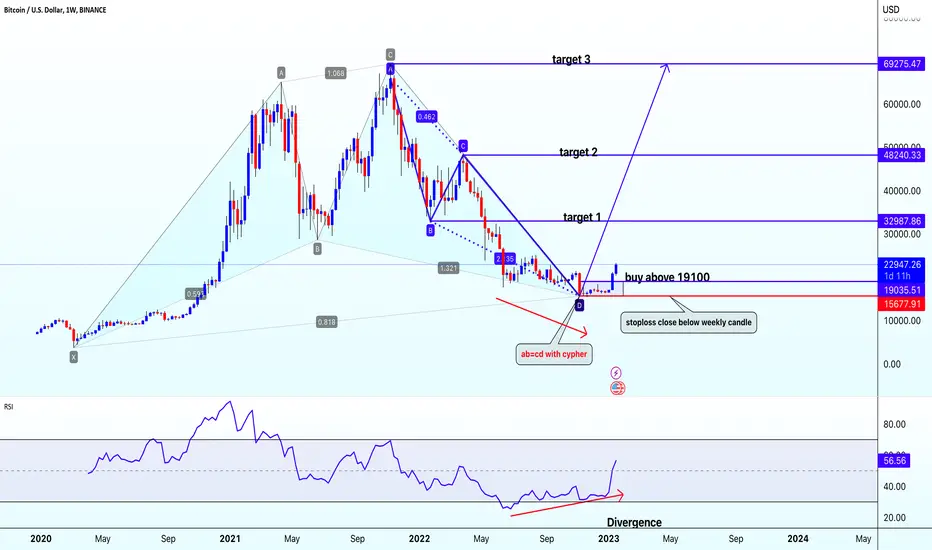
BTCUSDBtcusd
creating cypher harmonic pattern with ab=cd on chart with divergence @ bottom .chart also breakout inside candlestick pattern on daily chart
buy btcusd abpve 19100
closing sl below 15677
target=32980-48240-69275-100000
BTC - T1 - 104000Previous prediction of taking support from lower side of the loudspeaker pattern worked out well. V shaped recovery and showing Cup & Handle pattern now. Breakout of neckline is also coinciding with resistance line of the current fall Hope current pattern take out the resistance and move up to the immediate target of 104K first.

BTC - Buy BTC is in Bullish trend and is in loudspeaker chart pattern. Price is at over sold zone and lower side of the loudspeaker pattern. Even if price drops its good to go long in Bitcoin. If traded in derivatives have enough margin to hold longs in case of any spikes.

Bitcoin Bybit chart analysis December 19 Hello
It's a Bitcoinguide.
If you have a "follower"
You can receive comment notifications on real-time travel routes and major sections.
If my analysis is helpful,
Please would like one booster button at the bottom.
This is Bitcoin's 30-minute chart.
In a little while, at 10:30 and 12:00, there will be a Nasdaq indicator announcement.
As I explained,
Nasdaq and Bitcoin both reached the center line of the Bollinger Band daily chart,
but Nasdaq is recovering the 12+ daily pattern,
and Bitcoin has touched the center line of the daily chart alone, so the mid-term pattern is broken.
Even if it succeeds in bouncing back from the current position,
it is a problem,
but today, at least in Nasdaq, there is a higher possibility of a sideways movement rather than a plunge,
so we proceeded with trend following.
*Red finger movement path
One-way long position strategy
1. 101796.5 dollars long position entry section / When the green support line is broken
or when section 2 is touched, stop loss price
2. 104828.5 dollars long position 1st target -> Good 2nd -> Great 3rd
If the strategy is successful, the daily chart ends. The 1st section of the red finger is
a long position re-entry attempt and stop loss price autonomous section.
Today, the 15-minute Bollinger Band center line
has not been touched even once, so the strategy is to play at 5+15 or even 15+30 even if it is pushed.
With a strong upward condition, the success rate is approximately less than 5%.
From the 1-hour chart center line touch,
it can be dangerous because it is open downward, right?
Also, I marked the purple finger at the top.
In order to succeed in today's strategy,
you must first touch 102.7K to increase the probability,
and the long position switching position can change from the 1st section touch consecutively.
If the adjustment comes out immediately without touching the purple finger at the current position,
a long position entry position can come out once within the purple support line near the center line of the 30-minute chart,
and it becomes a dangerous section from the 2nd section touch.
You can see the movement within the convergence section of the orange resistance line of the 1st section and the sky blue support line of the 2nd section at the top as a sideways market.
I drew a gray rising trend line in the 3rd section,
and if it doesn't deviate from this section depending on the movement this week,
it can continue to rise.
If the 3rd section touches today, it seems like it will be a double bottom condition,
but I don't recommend it. Bottom is the place where the 12+ daily pattern can be restored, but if a strong rebound does not occur, the candle may deviate from the center line of the daily chart, so additional declines may occur.
Up to this point, I ask that you simply use my analysis for reference and use,
and I hope that you operate safely with principle trading and stop loss prices.
Thank you.

BTCUSD Friday Analysis Bitcoin chart update
If we gave bitcoin yesterday the level we gave, then we gave a move of 3900 points from there, today that level is broken and the side is coming down.
Below is again a support level
#btcusd #bitcoin

Bitcoin Bybit chart analysis December 18Hello
It's a Bitcoinguide.
If you have a "follower"
You can receive comment notifications on real-time travel routes and major sections.
If my analysis is helpful,
Please would like one booster button at the bottom.
Above is the 30-minute Tether Dominance chart.
Roughly, it should proceed as the blue finger moves,
and the beat should move in the opposite direction, right?
If I explain it, it may take all night,
so please refer only to the drawing section and major price ranges.
This is the Bitcoin 30-minute chart.
The FOMC US interest rate announcement is at 4 a.m.
Since the no-questions-asked decline yesterday,
the mid-term pattern has also been broken, so there have been a lot of turning points.
The strategy is going to be one-way,
but I don't know how to explain the mid-term turning point.
The secret section at the bottom is the Gap8 section,
and when I draw it, it seems impossible if it doesn't fall right away from the current position.
To summarize,
*The blue finger movement path is a two-way neutral
short->long switching strategy.
1. $106,394 short position entry section / red resistance line breakthrough or top section
touching is the stop loss price
2. $104,310.5 long position switching / stop loss price when the green support line is broken
After the final long position switching,
I don't know how it will move. Long target price is Top and I'd like to talk again tomorrow.
The purple support line drawn from the current position basically has to be maintained for the strategy to succeed, so please watch closely.
Orange resistance line breakthrough -> Purple support line must be damaged or separated.
... It's hard to explain.
Also, the movement within the convergence section of the orange resistance line in section 1 and the green support line in section 2 marked above and below is a sideways movement.
If it falls right from the current position or falls after section 1,
the section 2 at the bottom becomes the final long position entry section.
(section 1 is the first short position entry section of today)
section 3 is the support line of the 4-hour Bollinger Band.
It's around section 4+6 where the mid-term pattern is restored.
It becomes today's major support line,
and the bottom section is the center line of the 12-hour Bollinger Band chart.
Overall, if only the green support line is maintained,
it would be best for a long position.
I marked a thin gray line below the bottom,
which is a mid-term trend line.
Since the low point continues to rise,
if this position is not broken,
the uptrend can continue.
Up to this point, please use my analysis as a reference and only
I hope you operate safely with principle trading and stop loss prices.
Thank you.

BTC 129KThe current target of 108k has been achieved. With retracement and rebalancing underway, fluctuations are already occurring, indicating the potential to reach the next target range of 112k to 116k.

UPDATE - Rates Rises and Cuts since 2021 and effect on BTC PAThere it is, the entire effect of FED Rate Cuts, Effects on influential companies and banks and the unstoppable RISE of Bitcoin to Corporate recognition and Adoption and the arrival of ETF's
And now, with a more Global acceptance of Crypto, whats next ?
what is certain is how BTC is gaining on GOLD's previous title as the Safe haven and Stor of Value
The BTCXAUT ( Gold) chart shows this rise as it has begun, ready to take over >
Currently, ONE BTC = 39 ounces of Gold, down slightly from the 42
Over 100 is expected by 2030 at the very latest
It is simply Bad financial advice to suggest people SELL Bitcoin.

Bitcoin Bybit chart analysis December 17Hello
It's a Bitcoinguide.
If you have a "follower"
You can receive comment notifications on real-time travel routes and major sections.
If my analysis is helpful,
Please would like one booster button at the bottom.
Here is the Bitcoin 30-minute chart.
The Nasdaq indicator will be announced at 10:30 in a little while.
Today, I made a strategy through a very fair vote.
If the strategy fails, there is a possibility of sideways movement and additional adjustments after tomorrow, so
please note.
Today, I will start the strategy for a 5% probability vertical rise.
*When the red finger moves
Long position strategy
1. 106,891 dollars long position entry section / When the purple support line is broken
or when section 1 is touched, stop loss price
2. 108,784.5 dollars long position 1st target -> Good 2nd -> Great 3rd
107,843.5 dollars in the middle
is a textbook-like autonomous long position section
If the purple parallel line support line is maintained until the daily candle is created
Is it valid?
Also, rather than proceeding aggressively today,
all patterns were restored after the report was updated,
and since the 15-minute Bollinger Band support line has not been touched even once,
we tried to enter the rising pattern and decided the game.
On the other hand, there is a possibility of a vertical decline in Tether Dominance.
From the touch of the 1st section at the bottom,
the short-term pattern is broken, and there is a possibility of additional adjustment after tomorrow,
so if the strategy succeeds within the purple parallel line support line today,
it is definitely good.
The 2nd section at the very bottom
is the 1+4 section,
so if the strategy fails today,
keep it open until 2.
As explained in the video,
when Bitcoin is in an upward trend, it will go together with the major altcoins,
and after the adjustment, there is a high possibility of a cyclical pumping from the minor altcoins in the rebound.
Since you have been spreading it hard, it is time to reap it now, right?
Up to this point, I ask that you simply use my analysis for reference and use only.
I hope that you will operate safely with the principle of trading and cut-off price.
Thank you for reading.

BTCUSD - Channel BO - WKLYThe chart displays Bitcoin's price action (BTC/USD) over a weekly timeframe, suggesting a large channel BO.
Key insights:
1. **Resistance Zone**: Around ~$65,000, which acted as a historical peak during earlier bull runs.
2. **Breakout Target**:
- The measured move of ~$54,840.25 (approximately a 72.17% rise post-breakout) suggests a price target near **$131,176.66**.
3. **Volume**: Noticeable increase in volume during the breakout, signaling strong buying momentum.
4. **Current Price**: Bitcoin is trading near ~$107,367.64, consolidating above the breakout resistance.
The chart anticipates a bullish continuation toward the projected target (~$131,000) if the breakout holds, in line with historical price structure.

BTCUSD SHOWING A GOOD UP MOVE NOW WAIR FOR TRAD LINE BREAKOUT A. its following a rectangle pattern that stocked the market
which preventing the market to move any one direction now it trying to break the strong resistant lable
B. after the break of this rectangle it will boost the market potential for break
C. also its resisting from a strong neckline the neckline also got weeker ald the price is ready to break in the outer region
all of these reason are indicating the same thing its ready for breakout BREAKOUT trading are follws good risk reward
please dont use more than one percentage of your capitalfollow risk reward and tradeing rules
that will help you to to become a bettertrader
thank you

(Spicy) Bitcoin Bybit chart analysis December 12Hello
It's a Bitcoinguide.
If you have a "follower"
You can receive comment notifications on real-time travel routes and major sections.
If my analysis is helpful,
Please would like one booster button at the bottom.
Above is the Nasdaq 30-minute chart.
There will be an indicator announcement at 10:30 shortly.
*Red finger long position strategy.
The Nasdaq has touched the 30-minute resistance line,
but the 2-hour chart MACD dead cross is in progress,
so I judge that a vertical rise is difficult.
Since it is breaking out of the 30+1 section,
the short-term pattern is breaking a little bit,
but I followed the trend for a strong rise.
As a risk factor,
there is a possibility of being swept away if the orange resistance line above No. 1 is broken, so you should be careful.
Also, since there was no reversal after the vertical rise in CPI yesterday,
an adjustment may come right away, so please take note.
If we just maintain the green support line today,
and move sideways, Bitcoin will be free.
This is the 30-minute Tether Dominance chart.
Since the downward trend is open due to yesterday's movement,
and Bitcoin is in an upward trend,
I tried to enter the short position operation method in reverse.
If it fails to break through the pink resistance line,
it will be a vertical decline,
but if you look at the candle shape on the left,
since a full candle is in place,
the short position entry point is at 3.96%
It is roughly the 30-minute resistance line + the 1-hour chart resistance line.
Since the topmost point is a textbook-like position for a 3.99% short position,
if it fails to break through the red resistance line today,
it seems very likely to fall.
This is the Bitcoin 30-minute chart.
Nasdaq is renewing its all-time high,
but Bitcoin has not yet broken through its all-time high.
Therefore, the possibility of a sweep condition seems low,
and based on the Nasdaq strategy and the Tether Dominance short position entry point,
we proceeded with the strategy with a strong upward condition.
For reference, Bitcoin also touched the center line of the 1-hour Bollinger Band chart alone, so the short-term pattern is broken,
and the 2-hour MACD dead cross pressure is in progress,
so the vertical rise looks low.
Today, the 1+4 section looks dangerous,
and the match was decided at the middle point, the 30-minute support + 1-hour support line of the Bollinger Band pattern.
*Red finger movement path
One-way long position strategy
1. $99780.5 long position entry section / When the green support line is broken
Or when section 2 is touched, stop loss price
2. $103,718 long position 1st target -> Good 2nd target price
If the strategy is successful, section 1 is the long position operation section.
Since it can rise without adjustment,
It seems advantageous to re-enter the long position without operating a short position.
The stop loss price is
The green parallel line support line at the bottom -> sky blue autonomous depending on the remaining drawing.
Since there was no resistance line touch on the 30-minute chart today,
You should be careful because it can end as a slight adjustment or sideways movement in section 1 at the top.
The orange resistance line at the top and the sky blue support line at the bottom
are sideways movement sections.
Section 2 is a textbook short position <-> BIT can be a long position entry point compared to Tether Dominance, which moves in the opposite direction.
If the green support line is maintained today,
it seems that there will be no problem in the upward trend,
and I have drawn the support line and checked the price from below Section 2.
And, I have been giving you a hint recently.
I explained that you don't need to worry too much about BIT movement.
I wonder if you had fun with minor altcoins in the Bitcoin rebound yesterday.
Depending on the movement today,
the sideways movement may continue,
so it would be good to aim for minor altcoins at the same time
until the red resistance line top section is broken -> the new high price is updated.
This was a very spicy hellfire analysis article.
I don't know if you liked it.
I am a person who does it if I have to. The quality can be adjusted as much as I can within my capabilities, so
Please refer to it,
and please use my analysis articles only for reference and use,
and I hope you operate safely with the principle of trading and stop loss.
Thank you always.

Bitcoin chart updateBitcoin in range
For long and short entry wait for break out
If range break you can plan your entry
Otherwise ignore because of Sunday low volume

BTCUSD/BITCOIN 1D SELL LIMIT PROJECTION 14.11.24Reason For Bearish Setup
1.RisingWedge Pattern Formed
2. Obet previous ATH & Trendline Resistance

Bitcoin bullish View HereBitcoin now sustain at 100000 level i
Now wait for resistence
If face resistance its can touch support level and going up

BITCOIN LONG IDEAI'm just analysing BITCOIN in case of an alternative to equity market worstcase scenario.
BITCOIN chart shows flag formation. It looks like ready to breakout of channel.
Target may be Long-term Channel midline.

Crypto TOTAL Market Cap:CRYPTOCAP:TOTAL
It has smashed through its previous ATH and is now sitting pretty at a staggering 3.5T. Expect a period of consolidation as we build a solid foundation for the next explosive leg up.
If everything aligns perfectly, I’m setting my sights on an exciting target range of $4.5T to $5.0T, and who knows, maybe we'll even touch $6.0T in this bull run. Let’s go, #Crypto fam! #cryptocurrency
