Bitcoin – Breakdown from the Ascending TriangleBitcoin just slipped below the ascending triangle support on the 4-hour chart, signaling a potential shift in short-term momentum. The structure had been forming higher lows toward the $115K resistance zone, but sellers stepped in hard near the top, breaking the trendline that’s been guiding the uptrend since mid-October.
The move comes amid broader weakness across the crypto market — BTC has shed about 3.7% this month, while altcoins like XRP and ETH are also struggling. Despite the pullback, Bitcoin still holds an impressive 18% gain for the year, so the bigger picture remains constructive.
Macro pressure seems to be weighing on sentiment — investor caution around interest rates, inflation, and the Fed’s next move is keeping volatility elevated. If upcoming data tilts toward another rate cut, we could see renewed upside momentum. But for now, price action suggests a possible retest of lower zones before bulls can re-establish control.
Overall, a clean technical breakdown in the near term, but the broader trend isn’t broken yet. Let’s see if bulls can reclaim that triangle support in the next few sessions.
DONT FORGET TO CHECK MY PROFILE BELOW 👇👇👇
1-BTCUSD
BTC - Buy - Price @ Support areaBTC is testing the W support area as per SMC retest. Interest Rate cut is super bullish for BTC and markets in general

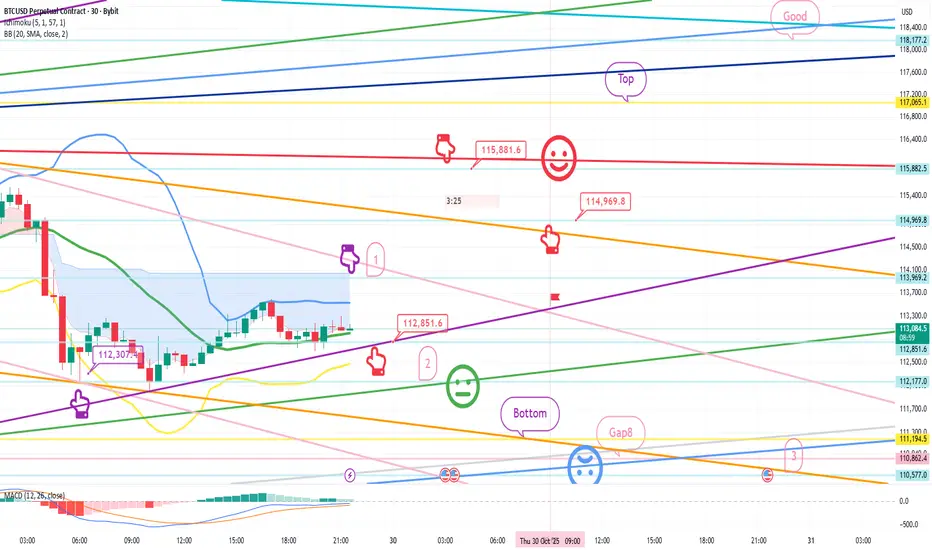
Bitcoin Bybit chart analysis October 29 (FOMC)Hello
It's a Bitcoin Guide.
If you "follow"
You can receive real-time movement paths and comment notifications on major sections.
If my analysis was helpful,
Please click the booster button at the bottom.
Here's a 30-minute Bitcoin chart.
Shortly, at 11 AM, there will be Nasdaq data releases.
At 3 AM, the FOMC releases data.
Unfortunately, yesterday's BTC move, which involved long and short positions, led to a strategy failure, so today's analysis will be completely public.
I ask for your support.
On the left, the purple finger connects yesterday's final long position entry point, the third section at $112,307.4.
While the interest rate cut is fundamentally positive,
I calculated the Nasdaq price fluctuations and implemented my strategy.
While there may be significant movements early in the morning,
BTC has many important elements, so I recommend reading carefully.
*Conditional Long Position Strategy: When the Red Finger Moves
1. After confirming that the purple finger touches the first section at the top,
the red finger marks the entry point for a long position at $112,851.6.
/ If the green support line is broken, set a stop loss price at $115,881.6.
1st target for a long position: $115,881.6 -> Target price at Top, Good, in that order.
If the strategy succeeds until the first target is touched, $114,969.8 is the point where the long position can be re-entered.
If the red resistance line is broken,
an uptrend could immediately resume.
If the price fails,
there's a possibility of another strong correction.
If the top section is touched before tomorrow's daily candlestick formation,
since this is the resistance line on the daily Bollinger Band chart,
a strong correction is likely,
it would be a good idea to enter a short position and then wait for a long position.
From the first section at the top to the orange resistance line,
a strong rebound is possible, so I don't recommend shorting.
If the price drops immediately without touching the first section,
then I recommend waiting for a final long position in the second section. If the green support line is broken,
then a pullback to the Gap 8 section at the bottom is highly likely.
Please note that if the green support line is broken,
then a pullback to the Gap 8 section at the bottom is highly likely.
Up to section 3 is open,
but this section is connected to the medium-term uptrend line,
so long positions should be held at all costs.
Yesterday's move also broke the first and fourth sections without any support,
breaking the medium-term pattern.
Since the 12-hour MACD dead cross isn't yet considered risky,
I proceeded as safely as possible, as the Nasdaq's movements were in line with it.
Please use my analysis to this point for reference only.
I hope you operate safely, adhering to principled trading and a stop-loss system.
Thank you.
Bitcoin Bybit chart analysis October 28Hello
It's a Bitcoin Guide.
If you "follow"
You can receive real-time movement paths and comment notifications on major sections.
If my analysis was helpful,
Please click the booster button at the bottom.
This is Bitcoin's 30-minute chart.
There's a Nasdaq indicator release coming up at 11:00 AM.
Bit has broken its short-term pattern by touching the center line of the 3-hour Bollinger Bands chart.
On the left, the purple finger indicates the entry point for the long position at $114,507.8, which we entered yesterday.
I've followed the same strategy. *Red Finger Movement Path:
Long Position Strategy
1. Confirm that the purple finger touches the first section at the top.
Red finger: $113,799.4 is the entry point for a long position.
/ If the green support line is broken, set a stop loss.
2. $117,065.1 is the first target for a long position. Target prices are set at Top and Good in that order.
If the strategy is successful, 115.9K is the point where the long position can be re-entered.
If the good section is reached before tomorrow's daily candlestick formation,
a correction may occur at the daily Bollinger Band resistance line.
A short position switch can be made.
If the price touches Section 1 at the top and rebounds strongly,
or if Section 2 is touched and rebounds within the purple support line,
a vertical rise is expected.
When the green support line breaks,
I've marked the support line from Bottom to up to Section 3.
Those who entered long yesterday at 114.5K should follow the same stop-loss order today when the green support line breaks.
I hope you'll continue to operate effectively, starting with Section 1 above.
By organizing this,
those who are long, those without a position, and those who are short
will all be able to utilize it.
Please use my analysis to this extent for reference only.
I hope you operate safely, adhering to principled trading and stop-loss orders.
Thank you.

Bitcoin Bybit chart analysis October 23
Hello
It's a Bitcoin Guide.
If you "follow"
You can receive real-time movement paths and comment notifications on major sections.
If my analysis was helpful,
Please click the booster button at the bottom.
This is Bitcoin's 30-minute chart.
There's a Nasdaq release coming up at 11:00 AM.
At the bottom left, with the purple finger,
I've linked the strategy to yesterday's long position entry point, $107,146.8.
The Nasdaq is correcting after its medium-term pattern has broken,
and Bitcoin is on track for a golden cross on the 4-hour and daily MACD charts.
XAUUSD is losing strength in gold,
and yesterday, there was some decoupling on the Nasdaq.
It will be important to see whether Bitcoin gains strength.
*When the red finger moves,
I'm considering a one-way long position strategy.
1. $108,136.7 long position entry point / Stop loss price if the green support line is broken
2. $110,837.9 long position primary target -> Top, Good, in that order.
If the strategy is successful, 110.2K is the long position re-entry point.
If a successful rebound occurs within the purple support line of the first section above, a vertical rise is possible, so please keep this in mind.
Due to the Nasdaq correction today,
we will operate a little more safely.
If the bottom section is pushed today,
the mid-term uptrend line will also break,
which is not good for a long position.
Since points 2 and 3 are both double bottoms, they can be risky.
Since a touchdown could trigger a variable,
we recommend utilizing a 5-minute trend reversal.
Please note that my analysis so far is for reference only.
I hope you operate safely, adhering to principled trading and stop loss orders.
Thank you.

XAGUSD (Silver vs USD) on the 1-hour timeframeXAGUSD (Silver vs USD) on the 1-hour timeframe, here’s what can be inferred:
The price has clearly broken below the ascending trendline.
It also broke down through the Ichimoku cloud, confirming a bearish signal.
There’s a sharp rejection candle followed by continuation below previous structure support (around $52.00–$51.80).
My marked a “target point” on your chart — roughly near $47.50, which seems to be aligned with the next major support zone from earlier price action (likely a demand area or Fibonacci retracement level).
🧭 Technical Breakdown:
Current Price: ~$51.81
Immediate Resistance: $52.30–$52.45 (bottom of the cloud)
Support/Target:
Short-term: $50.80
Medium-term: $49.50
Major target (as on your chart): $47.50
🎯 Expected Target:
If bearish momentum continues and the price stays below the $52.00 resistance, your target of $47.50 looks reasonable as a swing target.

Bitcoin – Buying the Trendline, Not the HypeBitcoin (BTCUSD) continues to respect its rising trendline structure , showing consistent demand on every retest. This type of price action often reveals where smart money is quietly adding positions, not chasing, but accumulating near support.
Each of the highlighted points shows how price has respected this trendline multiple times, forming a clean series of higher lows. As long as this level holds, the broader direction remains bullish.
Currently, BTC is testing this key support once again. I’m positioning near the trendline because the risk is clearly defined , and the potential reward toward 111K+ remains wide open.
Short-term volatility can still appear, but structure beats emotions . As long as buyers defend this zone, we may see another impulsive leg forming soon.
Disclaimer: This analysis is for educational purposes only. It’s not investment advice. Always do your own research before trading.

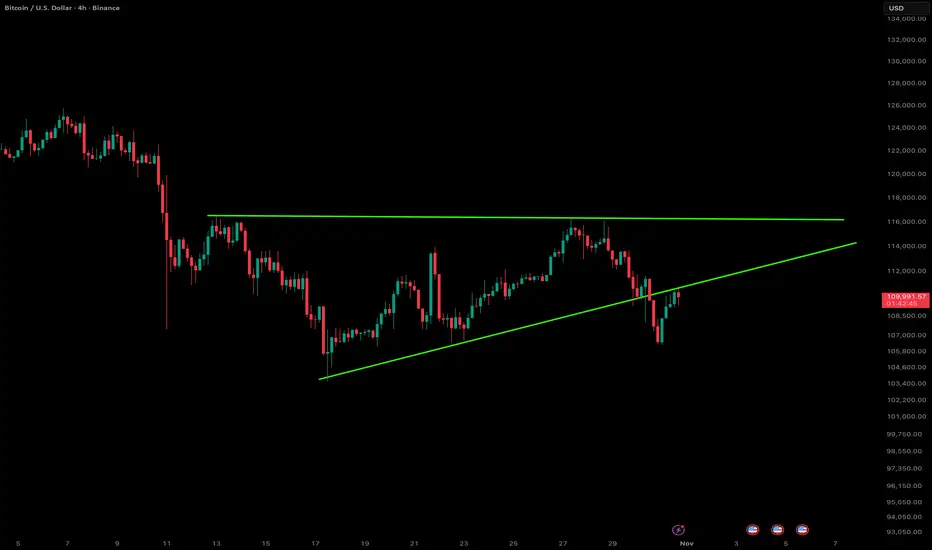
BTCUSD SHOWING A GOOD UP MOVE WITH 1:10 RISK REWARD BTCUSD SHOWING A GOOD
UP MOVE WITH 1:10 RISK REWARD
DUE TO THESE REASON
A. its following a rectangle pattern that stocked the market
which preventing the market to move any one direction now it trying to break the strong resistant lable
B. after the break of this rectangle it will boost the market potential for break
C. also its resisting from a strong neckline the neckline also got weeker ald the price is ready to break in the outer region
all of these reason are indicating the same thing its ready for breakout BREAKOUT trading are follws good risk reward
please dont use more than one percentage of your capitalfollow risk reward and tradeing rules
that will help you to to become a bettertrader
thank you

XAU USD SELL OFF Good sell off in Xau USD from top level .it's falling from 4331. Now at support near 4200. If crossed below 4200 then again good sell off . Or may take support here and then fall again after taking retracement. Let us see what may happen further. Support 4200 Round level . If fall then 4167 possible.
For more visit my Tradingview Profile

BTC Market Update: Bulls Regain ControlBitcoin has stabilized after a sharp corrective phase, forming a consolidation structure around the $111,000 area. Recent sessions indicate that sellers are losing dominance while buyers are quietly re-accumulating within the current range. This type of price action often appears before a potential short-term recovery move.
Market volume remains steady, and the structure shows compression—suggesting liquidity buildup below the current level. If this consolidation sustains without breaking lower, a breakout toward the $115,000–$116,000 region appears likely. A clean move beyond this zone could invite stronger bullish continuation as sidelined traders re-enter.
However, the broader trend remains cautious, as macro conditions and dollar strength could still limit momentum. Short-term traders may look for entries near the range lows with clear invalidation below $108,000. Proper risk management remains essential, targeting gradual exits around mid-range levels and scaling profits near projected resistance zones.

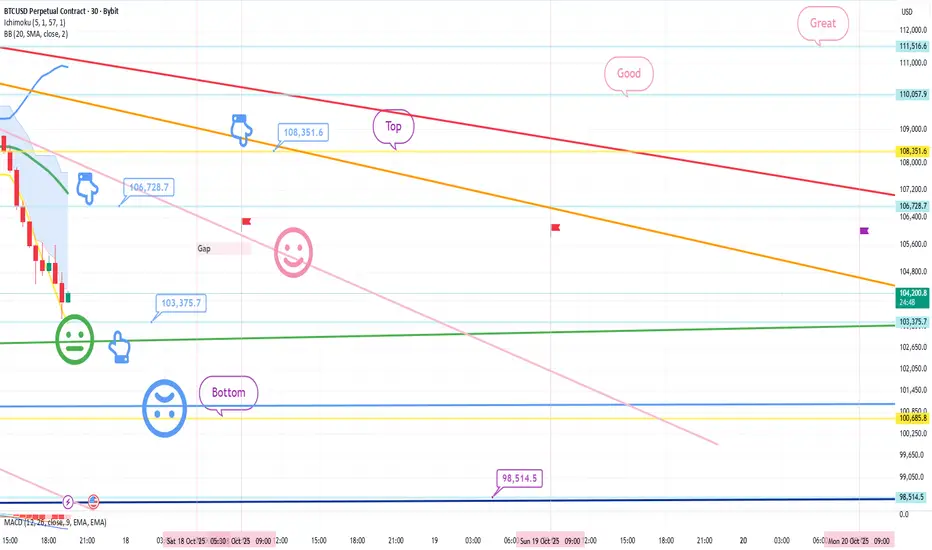
Bitcoin Bybit chart analysis October 17Hello
It's a Bitcoin Guide.
If you "follow"
You can receive real-time movement paths and comment notifications on major sections.
If my analysis was helpful,
Please click the booster button at the bottom.
This is Bitcoin's 30-minute chart.
There are no Nasdaq data releases today.
Bit has been falling sharply since yesterday and today, as it has been coupled with the Nasdaq.
I've been thinking a lot about the possibility of further declines.
*When the light blue finger moves,
Bidirectional neutral
Short->Long switching or final long position strategy
1. $106,728.7 short position entry point / Stop-loss price upon breaking the pink resistance line
2. $103,375.7 long position switching / Stop-loss price upon breaking the green support line
3. Long position target prices, starting from the top section at the top
If the price falls immediately without touching the short entry point at 106.7K,
the final long position is at the bottom section at the bottom.
The bottom section is a double bottom, where the previous low is broken.
Because the lower tail may be pushed to $98,514.5, indicated at the bottom,
rather than placing a limit order,
we recommend switching long positions after confirming a trend reversal on the 5-minute chart.
More importantly, the Nasdaq movement appears to be the most important. It's frustrating that Bitcoin is coupled with the Nasdaq, which plummets at crucial moments, but it seems the coin market has never been easy.
At least if you're trading in real time, in a market where some people lose money while others make money, giving up would only hurt you.
In times like these, it's crucial to stay focused and practice principled trading and stop-loss orders.
Thank you for your hard work this week.
BITCOIN DECLARED DEAD... AGAIN (498th TIME)BITCOIN DECLARED DEAD... AGAIN (498th TIME)
You know what happened the first 497 times?
It came back stronger. Every. Single. Time.
Meanwhile:
✅ Countries buying it
✅ Institutions loading bags
✅ Miners refusing to sell
But sure, THIS time it's different 😂
The graveyard is full of Bitcoin doubters. Don't be next 💀
CRYPTOCAP:BTC #Bitcoin
Note: NFA & DYOR

Bitcoin Market Preparing for Upside MoveBitcoin is currently stabilizing after a sharp corrective phase.The market is showing early signs of demand re-entry near the liquidity base,indicating potential exhaustion of selling pressure.Recent structural reactions hint that buyers are preparing to reclaim control,which could initiate a short-term recovery leg toward the mid-range inefficiency zone.If momentum sustains,Bitcoin may expand higher,confirming a potential buy phase aligned with institutional accumulation signals.Overall,the outlook remains cautiously bullish as long as the market holds above its newly formed demand area.

BTC - S & R levels. Buy some long qty now at support nowBTC is at support and profit booking and weak hands giving up qty. I have not see any big players stopped accumulation..... price is at good or reasonable buy levels for atleast one to 3 months i expect price to see new ATH again. few groups booking profits at every new ATH for buying back at support and safer levels.... Buy now for good investments with atleast 2 weeks to 2 months time period for great profits or else book profits as u wish

BTC forming wonderful scenarioBTC is forming good scenarios for bullish and subsequently bearish trade. It has created ABC pattern and retracing back to bullish FVG. We need to wait for price getting into right zones. We may also see a sell side trade once reaches to bearish FVG.
1. Currently price has broken ABC pattern neckline and retracing towards 1h FVG.
2. We may also see a sell side trade once price tap into bearish FVG and shows reversal pattern.
3. Most probably price will take liquidity of FVG and create MSS/CISD/TS/iFVG in LTF.
4. Price should show rejection/reversal in LTF (5m,1m) at FVG zone.
5. Take the trade only once clear entry model i.e. turtle soup. iFVG break, CDS or MSS happens on LTF
All these combinations are signalling a high probability and ~4R trade scenario.
Note – if you liked this analysis, please boost the idea so that other can also get benefit of it. Also follow me for notification for incoming ideas.
Also Feel free to comment if you have any input to share.
Disclaimer – This analysis is just for education purpose not any trading suggestion. Please take the trade at your own risk and with the discussion with your financial advisor.

Nifty 50 (2-hour timeframe) chart... Nifty 50 (2-hour timeframe) chart
from TradingView — here’s what can be inferred visually:
Current Nifty price: ≈ 25,323
You’ve drawn:
A horizontal resistance zone around 25,450–25,500 (highlighted in green)
A rising trendline from lower lows (support line)
A projected “target point” arrow pointing toward that rising support line, intersecting around the 24,700–24,750 zone
📊 Interpretation
My chart setup suggests a potential short-term pullback from the resistance zone (25,450–25,500) toward the support region.
🎯 Likely Target Zone
Target: Around 24,700 ±50 points
Stop Loss (if short): Above 25,500
Support levels:
24,900 (minor Ichimoku support)
24,700 (trendline + target point)
⚠ Note
The Ichimoku cloud is providing near-term support around 24,950–25,000, so expect consolidation before any deeper correction.
If Nifty breaks above 25,500 with volume, this bearish setup invalidates and could open upside toward 25,800–26,000.

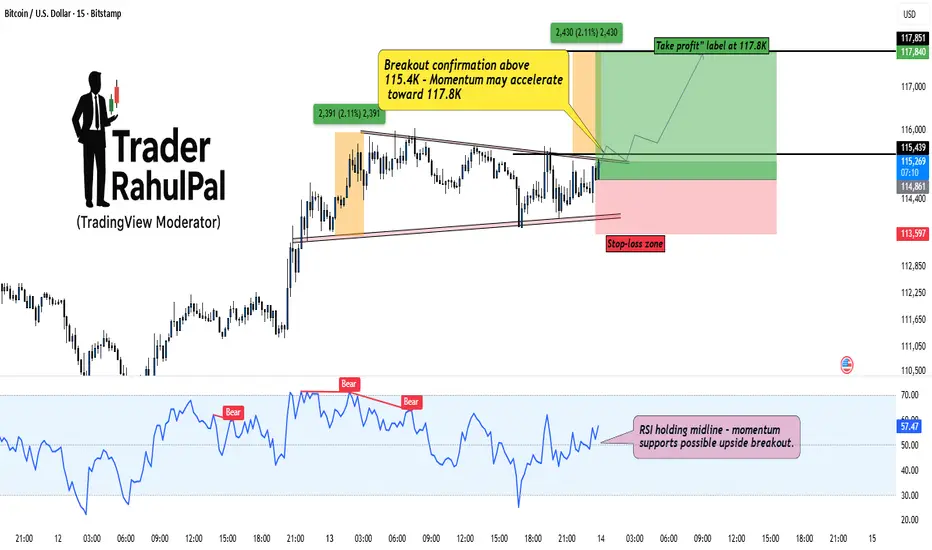
BTC – Building Discounted Longs Before the Breakout?Bitcoin (BTCUSD) is currently consolidating within a tight compression zone, showing signs of accumulation near 114.8K–115.4K . The market is coiling up right under resistance, hinting that a potential breakout could be around the corner.
As seen on the chart, structure remains bullish with a well-defined base and higher low formation. The key breakout confirmation lies above 115.4K , which could trigger a momentum push toward 117.8K , aligning with previous swing projections.
However, I’m personally building a small discounted entry position even before the confirmed breakout. The reason? When momentum starts expanding, it rarely gives clean entries, so catching early positioning near support provides better R:R potential.
RSI is holding above the midline, reflecting sustained buyer strength, while volume compression suggests a volatility expansion phase ahead. If price manages to sustain above the upper trendline, expect quick upside continuation.
Stop-loss remains below 113.6K to stay protected against fakeouts.
Rahul’s Tip:
Smart money often positions early when the crowd hesitates — timing matters, but conviction matters more.
Analysis By @TraderRahulPal (TradingView Moderator)
If this helped you spot the setup early, like and follow for more real-market insights.
Disclaimer: This analysis is for educational purposes only and should not be taken as financial advice. Please do your own research or consult your financial advisor before investing.
BTC - Long1. The colored horizontal areas show Fibonacci retracement levels, which traders use to spot possible support and resistance zones where the price might reverse or continue its move.
2. The 0% level is at the top (115,943) and the 100% level is at the bottom (109,523).
3. The price is currently near 113,207 and close to the 50% (112,732) and 61.8% (111,975) retracement levels.
4. Volume bars at the bottom show how much Bitcoin is being traded at each time.
5. If price bounces from the 50% or 61.8% levels (these are green and blue zones), traders can consider buying (long entry), hoping the price will go up. Always watch for a reversal candle or increased volume at these levels before entering.
6. Place your stop-loss just below the 61.8% level. For example, below 111,975.
7. Set your first target near the 38.2% level (113,490) and second target near the 23.6% level (114,428).
8. If price breaks below the 61.8% level with strong volume, avoid buying and look for a sell setup instead.
9. This setup uses common trading concepts like Fibonacci, support and resistance, and volume confirmation. Remember to wait for confirmation signals and manage risk with stop-loss orders.

BTCUSD-Trading below 116,478, can retest the low of 105,617Trading below 116,478, can retest the recent low of 105,617. Any 1 hour close above 116,911 is short exit. Cross over can happen anytime form now and it can push down further.

Bitcoin Bybit chart analysis October 2Hello
It's a Bitcoin Guide.
If you "follow"
You can receive real-time movement paths and comment notifications on major sections.
If my analysis was helpful,
Please click the booster button at the bottom.
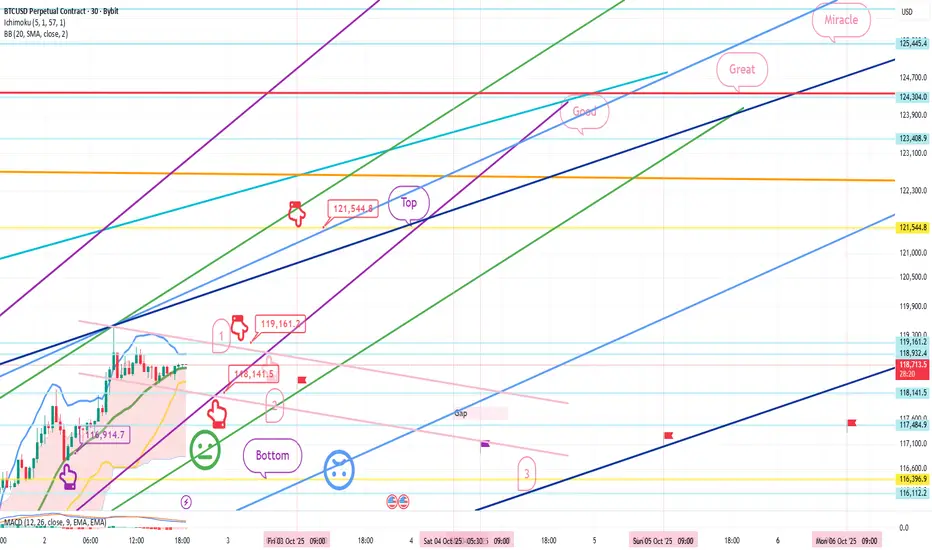
This is a 30-minute Bitcoin chart.
The bottom left shows yesterday's long position re-entry point, $116,914.7, indicated by a purple finger.
We will continue with the trend-following strategy.
*Red finger movement path:
Long position strategy
1. $118,668.2 long position entry point / Stop loss price if the green support line is broken
2. $119,161.2 long position primary target -> Target prices in order from the top to the miracle level
If the strategy is successful, the first section is the long position re-entry point,
and a new high is reached after the great breakout.
The second section is the final long position entry point.
If the green support line is maintained until the second section,
it will become an upward sideways market.
If the light blue support line holds through the weekend and next week,
it could continue to rise as it's a mid-term uptrend line.
Please keep this in mind.
Bottom -> I've left up to three sections.
You can check the prices of the major support and resistance lines above and below the section I've left or by dragging.
Please use my analysis as a reference only.
I hope you operate safely, with a principled trading strategy and stop-loss orders in place.
Have a nice holiday until next Friday.
I'll be back on Friday.
Thank you.
Bitcoin Faces Sudden Shakeout After Weeks of CalmBitcoin Volatility Returns as Market Momentum Resets
Hello Traders,
The Bitcoin market experienced a sudden burst of volatility in the recent session, ending a period of relative calm. On the 4H timeframe (Binance), intense selling pressure drove prices from near $117,000 down to roughly $109,000 before stabilizing around the $112K region. The swift decline marked a clear shift in short-term momentum, showing that buyers are beginning to lose dominance as broader market sentiment cools.
This pullback unfolded against a backdrop of renewed global uncertainty. A series of trade-related policy headlines reignited risk aversion, while continued strength in the U.S. dollar added additional stress to crypto markets. Institutional flows briefly reversed, signaling reduced confidence in near-term upside potential. The result was a wave of forced liquidations, magnified by leverage, as traders rushed to adjust exposure during the drop.
Despite the intensity of the move, market conditions remain structurally healthy. On-chain data shows that long-term holders are largely unmoved, suggesting this phase is more of a short-term repricing than a major cycle reversal. Derivative markets, however, have cooled significantly — open interest has thinned, and funding rates have normalized, indicating a temporary reset in speculative participation.
In the coming days, Bitcoin’s behavior will likely depend on liquidity dynamics rather than new macro data. With upcoming U.S. economic reports delayed and the dollar holding firm, volatility may persist as traders respond to headlines and reposition ahead of the next policy developments.
For now, the market appears to be in a state of balance after rapid liquidation. Whether this forms a new accumulation base or precedes deeper correction will depend on how quickly momentum returns. The broader sentiment remains cautious but stable — a waiting phase, as the market tests its conviction once more.
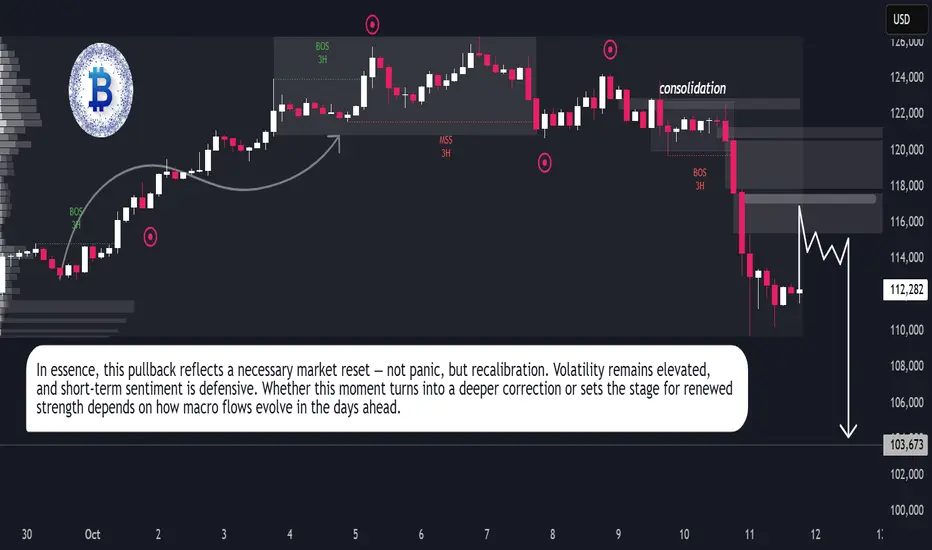
My Analysis Perfect 100%Analysis of the Price Action
Based on the image, the market experienced a significant and rapid downward movement, indicated by the long red candle (often called a 'sell-off' or 'wick' depending on how the candle closes) around the area you've highlighted.
• Before the Drop: The price was trading in a relatively high range, hovering around the 120,000 to 122,000 USDT mark, following a strong uptrend from late September to early October.
• The Drop: The price crashed through multiple key support levels (the horizontal white, yellow, and red lines, as well as the green/red zones you have drawn) in a very short period.
• The Volume: This massive price drop was accompanied by a huge spike in selling volume (the very tall red bar in the volume indicator at the bottom), which confirms a strong and sudden selling event.
• The Low: The price wick reached a low around 101,668.1 USDT before bouncing slightly.
Interpreting "My Target is Done"
Since I don't know the specifics of your trading strategy, "My target is done" could mean a few things:
1. Stop-Loss Hit: If you were long (betting on the price going up) and had a stop-loss set somewhere in the zone where the price fell, this sudden move would have triggered your stop-loss, closing your position for a loss (a target for your risk management).
2. Take-Profit Hit (Short Position): If you were shorting (betting on the price going down) and had a take-profit target set in the lower price ranges (perhaps around 110,000 or 105,000 USDT), this drop would have executed your take-profit order for a gain. This is the most common interpretation if you are celebrating a target being done during a crash.
3. Target for Entry: If you were waiting to buy the dip, the price hitting the very low levels (the wick) might have triggered a buy limit order you had placed, meaning your target for a new entry was achieved.
Given the nature of the move, if you were short, congratulations! If you were long, this looks like a painful liquidation or stop-loss event.

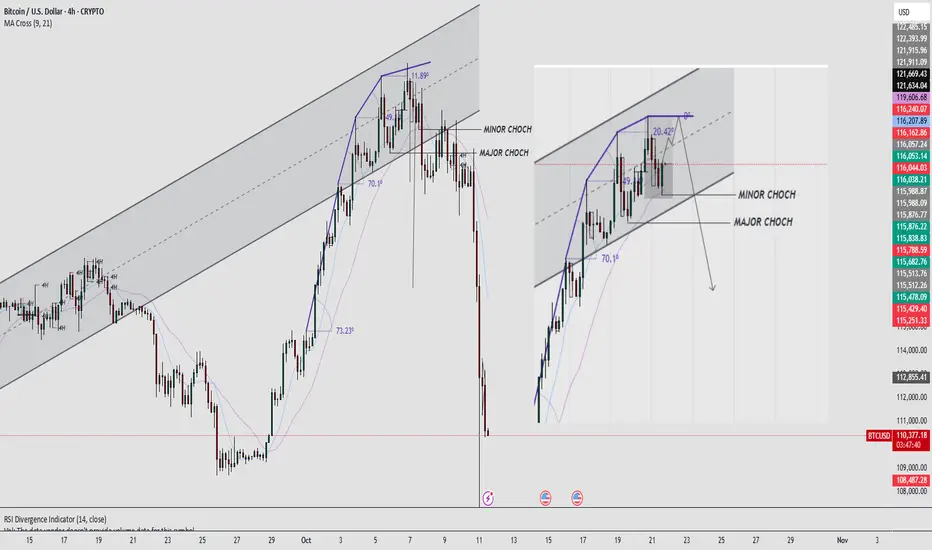
BTC/USD – Structure Played Out Perfectly | Major CHoCH ConfirmedAs marked in the previous analysis (shown on the right), BTC/USD respected the channel structure and delivered the expected downside move after confirming both Minor and Major CHoCH (Change of Character) levels.
Price reacted beautifully within the ascending channel, failing to hold the upper trendline resistance and then showing a clear structure shift — confirming bearish momentum.
This move validates the power of multi-timeframe structure + CHoCH confirmation, which provided an early sign of the reversal.
✅ Bearish CHoCH confirmation at the channel top.
🔹 Strong rejection from upper trendline resistance.
📉 Price broke structure and followed the projected path precisely.
⚙️ Next major support zone sits near 108,500 – 109,000 USD.
🧭 Possible short-term consolidation before continuation.
#BTC #PriceAction #SmartMoneyConcepts #CHoCH #TechnicalAnalysis #CryptoTrading #HenishMavani