BTC Short Now that it's confirmed that BTC is consolidating in a triangle pattern, I hope you all have made some profit. I predicted the formation of this triangle pattern way earlier.
The CME gap between 62,000 and 64,000 will sooner or later fill.
The target prices for this trade are as follows:
- 69,601
- 69,011
- 68,111
- 66,111
- 65,111
- 64,111
Stop loss (SL) at 71,251.
Currently, it's consolidating in a triangle pattern. I anticipate a significant move on Monday. For today, consider booking profits on the lower trendline and initiating short positions from the upper trendline or resistance levels indicated on the chart at 70,111 and 70,464.
1-BTCUSD

BTC SHORT LONGI am still holding a short position, but if it closes above 70,150 , I will close the short and open a long position for 2 or 3 hours. Eventually, it will come down for sure. If you can take the risk, hold your short. The CME gap between 62,000 and 64,000 will sooner or later fill.

AMB weekly looks bullish$BINANCE: AMBUSDT
looks good in the weekly time frame making like a double bottom and already breakout and retest already so we can see an upside target in the coming days

ARUSDT Cup & Handle formation and verge of breakoutBINANCE:ARUSDT
- It's forming a bullish pattern and looks solid here if it breakout this cup & handle pattern and hold above this then it can go to 60$ in coming days

Swing Trade ideas and Forex Ideas for 28 March Markets I make educational content videos for swing / positional trading

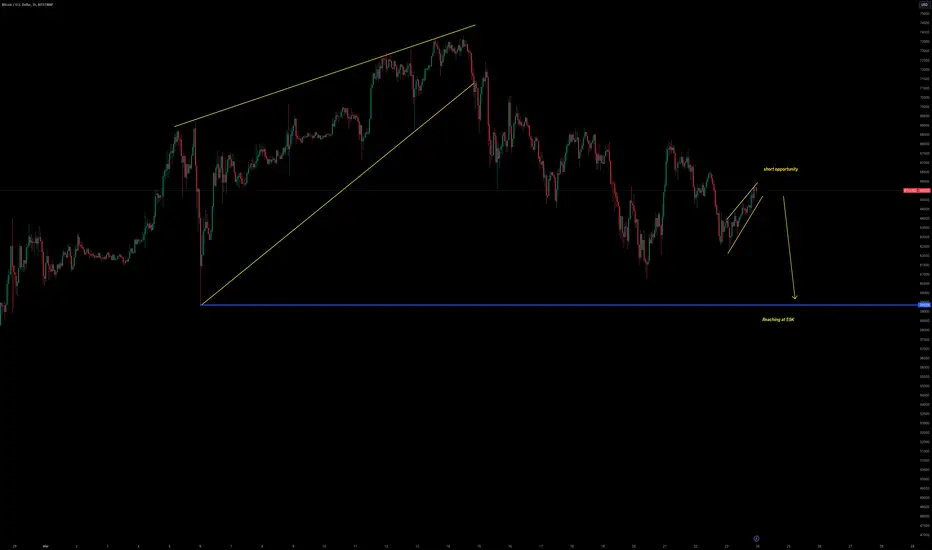
Looking for ShortBTCUSD is forming a movement to the downside & expecting to reach at 59316 for the sell side


Movement to downsideBTCUSD is looking for short after making ascending channel & has clear formation to the downside.
Is BTCUSD ready to blast💰BTCUSD make or break level, BTCUSD is at important level Forming a Channel Pattern Let's see this sustain or not. what is your view please comment it down. We are NISM Certified. All views shared on this channel are my personal opinion and is shared for educational purpose and should not be considered advise of any nature.


BTCUSD important levelBTCUSD make or break level, BTCUSD is at important level Forming a Channel Pattern Let's see this sustain or not. what is your view please comment it down. We are NISM Certified. All views shared on this channel are my personal opinion and is shared for educational purpose and should not be considered advise of any nature.

Movement to the downsideBTCUSD is looking for downside after forming ascending channel on the left side waiting for conformation. Expecting target 57K

BTCUSD important levelBTCUSD Which is showing a great opportunity BTCUSD is at important level. what is your view please comment it down. We are NISM Certified. All views shared on this channel are my personal opinion and is shared for educational purpose and should not be considered advise of any nature.

BITCOIN Target as per Elliot Waves ExpectatiomBiotcoin Target as per Elliot waves. It's just a projection. further targets and retracements levels we have to wait and see the moves.
If this monthly closing is above the previous high then the targets mentioned in the chart are confirmed.
We don't predict the market but based on the retreat and levels that targets are confirmed.
let's go with the flow

BTCUSD at important levelBTCUSD Which is showing a great opportunity BTCUSD is at important level. what is your view please comment it down. We are NISM Certified. All views shared on this channel are my personal opinion and is shared for educational purpose and should not be considered advise of any nature.

Solana market dominance This price action shows the dominance of solana in crypto market
So its breaking out is all time high dominance.. solana can be bought for long term investment

FTM Bullish cup & handle patternBYBIT:FTMUSDT.P
FTM is forming 1day bullish pattern called cup and handle and it will give good return on breakout it can pump to 200% more on pattern breakout

Btc short term setupAs btc is in clear uptrend and it did a break of structure that i have marked BOS on chart.And as bos done there is a demand zone which is our poi. There are three liquidity zones that i have marked onto the chart as well. And trendline liquidity is also marked. Perfect entry and exit zones are given on the chart.
What is your idea?

Intellect Design There is a one more stock Which is showing a great opportunity in this type of market showing great strength, stock is now at a resistance in Intellect Design. what is your view please comment it down. We are NISM Certified. All views shared on this channel are my personal opinion and is shared for educational purpose and should not be considered advise of any nature.

Bitcoin: Navigating the Future of FinanceIn the ever-evolving landscape of digital currencies, Bitcoin remains at the forefront, reshaping traditional notions of finance. Its decentralized nature, coupled with technological innovation, continues to redefine economic paradigms, presenting both opportunities and challenges for investors and policymakers alike. Understanding Bitcoin's potential and its impact on the future of finance is essential in navigating this dynamic landscape.


RSR LONG analysis for short term RSR is hanging in trendline in 1h analysis, soon it it expected to catch uptrend movement.

Bitcoin PredictionBINANCE:BTCUSDT is expected to increase by 200% from its current level. While there may be some turbulence, it's a sure shot for a 200% gain. Consider SIP.
