Gold Neowave Bulletin| 10/10/2025
Namaskaram Everyone
Welcome to intelligent investor, we provide market insights by synchronising and combining all the price action waves from different time frames and gives you single trend.
Here are all our previous gold analysis, with this you will understand how with Neowave Theory you will have an edge in the market.
Previous Neowave Bulletin
09/12/2025
07/10/2025
01/10/2025
30/09/2025
29/09/2025
OANDA:XAUUSD FOREXCOM:XAUUSD FX:XAUUSD VANTAGE:XAUUSD MCX:GOLD1!
1-BTCUSD

Bitcoin – Rising Higher, But the Real Battle Is Yet to Begin!Bitcoin continues to trade inside a rising structure , respecting both its long-term support and resistance channels. The trend remains healthy as long as price holds above the 116,000–116,500 support zone , which has been tested multiple times with strong buying reactions.
Currently, BTC is approaching a major resistance confluence zone . The chart clearly shows that every previous rejection near this zone has led to profit-booking, but this time the structure looks different, buyers are more confident, and momentum is building from the base levels .
If Bitcoin manages to sustain above the minor resistance area , the road opens towards 131,500 levels and beyond . However, traders should remember, such breakouts demand patience, not prediction. The stronger hands will always think in cycles, not candles .
The psychology of the market here is simple: every pullback to the rising support attracts accumulation by smart money , while emotional traders exit too early. This phase often separates investors from speculators.
Rahul’s Tip : Don’t fear the dips. Fear missing the structure that defines the entire bull leg. If the support holds, this could be the foundation of the next major BTC wave.
Disclaimer: This analysis is for educational purposes only and should not be taken as financial advice. Please do your own research or consult your financial advisor before investing.
Analysis By @TraderRahulPal (TradingView Moderator) | More analysis & educational content on my profile
👉 If you found this helpful, don’t forget to like and follow for regular updates.

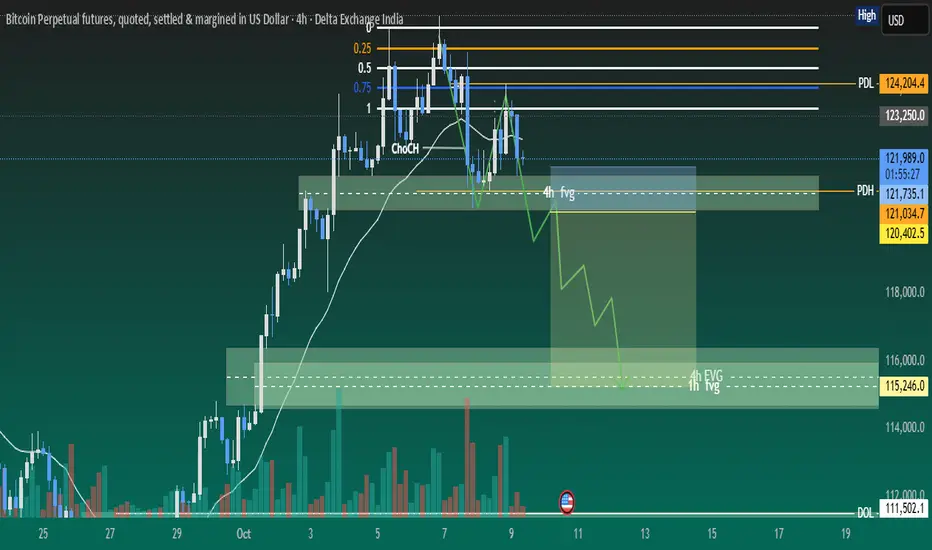
BTC is developing ~4R down side tradeBTC has done MSS on 4h time frame and showing rejection at 4H FVG after displacement. We can see a good downside trade once below FVG is mitigated and changed to iFVG. We need to wait for price getting into right zones.
1. Currently price is moving inside 4H FVG after displacement and showing rejection as well.
2. Price should break below FVG and retest.
3. There are several SIBIs which may be target for it and further buy side reversal trade.
4. RSI has already shown bearish divergence. Which support coming down move.
5. Most probably price will take liquidity of FVG and create MSS/CISD/TS/iFVG in LTF.
6. Price should show rejection/reversal in LTF (5m,1m) at FVG zone.
7. Take the trade only once clear any of the entry model i.e. turtle soup. iFVG break, CDS or MSS happens on LTF
All these combinations are signalling a high probability and ~4R trade scenario.
Note – if you liked this analysis, please boost the idea so that other can also get benefit of it. Also follow me for notification for incoming ideas.
Also Feel free to comment if you have any input to share.
Disclaimer – This analysis is just for education purpose not any trading suggestion. Please take the trade at your own risk and with the discussion with your financial advisor.
BTC/USD: Structure Shift Confirmed - Bearish CHoCH Break"The previous analysis highlighted the Minor and Major CHoCH levels as key lines in the sand for the recent uptrend. The market has now decisively broken BELOW both levels.
This action confirms a Bearish Change of Character in the market structure (on the chart), signaling a failure of the current bullish order flow.
Minor CHoCH Break : Confirmed the initial weakness and short-term pullback.
Major CHoCH Break : Confirms the structural shift, indicating that the corrective move is likely to be deeper than a simple consolidation.
We should now anticipate a shift in price action: making Lower Highs and Lower Lows . The previous support levels may now act as resistance. Looking for the next key demand zones for a potential bounce, but the immediate bias is now BEARISH ."

Beautiful 6R BTC trade scenariosBTC is forming both buy and sell side trades as the price is in critical zone. BTC will possibly give us both side good trades. We need to wait for price getting into right zones.
1. Currently price is moving around daily and 4H gradient levels.
2. 125275 level is creating a gradient cluster of both 1d and 4h time frame. Which may give us a good sell side trade if price show clear reversal signals.
3. There is an 1hour iFVG if price takes liquidity of it, most probably it will touch gradient cluster level and good sell scenario may be confirmed.
4. There are several SIBIs which may be target for it and further buy side reversal trade.
5. Buy side reversal trade may be good trade as overall BTC order flow is upside.
6. Most probably price will take liquidity of FVGs and create MSS/CISD/TS/iFVG in LTF.
7. Price should show rejection/reversal in LTF (5m,1m) at FVG zone.
All these combinations are signalling a high probability and 5.5R trade scenario.
Note – if you liked this analysis, please boost the idea so that other can also get benefit of it. Also follow me for notification for incoming ideas.
Also Feel free to comment if you have any input to share.
Disclaimer – This analysis is just for education purpose not any trading suggestion. Please take the trade at your own risk and with the discussion with your financial advisor.

BTC/USD Analysis: Bullish Continuation in FocusBitcoin continues to demonstrate strength following its recent recovery. After periods of consolidation and controlled retracement, the market shows clear signs of accumulation, with buyers maintaining momentum. Each upward leg has been supported by liquidity absorption, reflecting steady confidence in higher valuations.
The current structure suggests that even if retracements occur, they are likely to serve as a foundation for further expansion. Market behavior highlights resilience, with the broader trend still pointing toward bullish continuation. Bitcoin remains positioned for progressive growth, with sentiment and structure both aligning in favor of buyers.

BTC NEAR LONG TERM UPPER RESISTANT AND CAN FALL SHARPLYINDEX:BTCUSD can fall sharply if resistance and any downside pattern emerge from here

BTC/UsDT Short sideHere is a description of the downside scenario as depicted:
1. The Short Entry Point: The short trade is set up to begin at the approximate current price level, which is around $122,000 to $123,000. This suggests a trader is anticipating that the current strong bullish move has reached its peak and a reversal is imminent.
2. The Stop-Loss (Risk):
• The top boundary of the red box, which extends into the red area above the entry, represents the stop-loss level.
• This red area is relatively small compared to the profit target, suggesting a favorable Risk/Reward ratio.
• The stop-loss price appears to be around $126,864.5 (the highest point in the image is $126,864.5). If the price moves above this level, the trade would be closed for a manageable loss.
3. The Take-Profit (Reward/Target):
• The lower boundary of the red box, which extends significantly downwards, represents the take-profit or target area for the short trade.
• The profit target line appears to be around the $108,500 to $108,800 level, which is a key low from late September.
• This is where the trader would expect to close the trade for a profit if the anticipated downside move materializes.
4. The Context: The "downside chart" fundamentally represents a trade where the trader is betting on a significant price decline back toward the prior support levels after the large recent rally.
In summary, the downside chart (the red box) illustrates a hypothetical short position where a trader is risking a small amount of profit from the recent rally to potentially capture a much larger drop in price, targeting the strong support zone established just before the recent V-shaped recovery.
The term "downside chart" in this context refers to the short trade setup that has been drawn on the chart, which is visualized using the large red shaded box.
This setup represents a trader's prediction that the price of BTCUSDT will reverse and fall significantly from its current high.
Here is the breakdown of the downside trade setup:
• Entry Point (Current Price): The trade is initiated for a short position (selling) near the current market price, which is around $122,379.1. This is the belief that the recent powerful rally is exhausted and a reversal is starting.
• Stop-Loss (Risk): The area above the entry point, colored in the brighter red on the chart, represents the Stop-Loss level.
• The stop-loss price appears to be around $126,864.5 (the high shown in the top right).
• This is the level where the trade would be automatically closed to limit the loss if the price continues to rise against the short position.
• Take-Profit (Reward/Target): The large green shaded area below the entry represents the Take-Profit or profit target for the short trade.
• The target price is set significantly lower, near the prior support/lows from late September, likely around the $108,500 to $108,800 range.
• This is where the trader expects to close the short position to realize a profit.
• Risk/Reward Ratio (R:R): By comparing the distance from the entry to the stop-loss (the risk, in red) versus the distance from the entry to the take-profit (the reward, in green), the trade demonstrates a favorable Risk/Reward ratio. The reward (green box) is visually much larger than the risk (top red portion), suggesting the trader is attempting to risk a small amount to potentially gain a large profit.
In summary, the downside chart is the visual representation of a bearish trading strategy, expecting a move down from over $122k to the support area near $108k.

All The Target DoneHere's a breakdown of what the chart shows and why "target done" is applicable:
• The Movement: The chart displays a significant V-shaped recovery and surge starting around September 27th or 28th and continuing up to the current date (October 4th).
• The Target Area: The large green shaded box highlights the upward trajectory and covers the area where the price has been moving. The upper limit of this green box and the price levels around the $122,000 to $123,000 mark appear to be the region of the achieved target.
• Current Price Action: The current price is displayed as $122,506.9, which is at the upper end of the recent upward movement and well into the highlighted green zone.
• Inferred Trading Context: In a trading context, it suggests that a long (buy) position was likely entered near the bottom of the V-shape, perhaps around the $110,000 to $112,000 area, with a profit target set near the current price level. Since the price has reached or exceeded that upper range, the objective has been met, hence "target done."
In short, the chart clearly illustrates a successful, powerful move to the upside, indicating that the profit goal (target) for that particular trade setup has been achieved (done).

BTCUSD - Any new high is going to sell-off due to divergenceClear Divergence in Daily timeframe. Unless we break above the divergence line we can expect another sell-off. The Bands have tightened

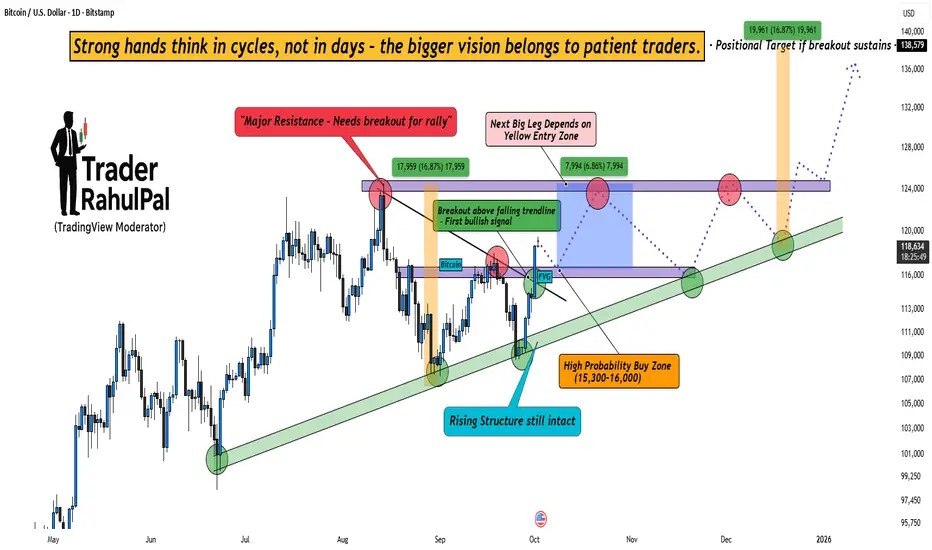
Bitcoin Cycle Play – The Setup That Could Change the Game!Bitcoin is currently showing clear bullish intent , but the real game lies in patience. The chart highlights a decisive breakout above the falling trendline , which is the first bullish signal after weeks of uncertainty.
At the same time, the rising structure is still intact , reminding us that the bigger trend remains strong. Smart money never chases candles – instead, it waits for the high probability zones . In this case, the 15,300–16,000 range could become the golden buying zone for long-term players.
However, one key hurdle remains – the major resistance overhead . Only if Bitcoin breaks and sustains above this zone, the door opens for the positional target near 138,000+ .
The psychology is simple : weak hands focus on short-term noise, but strong hands think in cycles and structures . Every dip tests conviction, but those who hold the bigger vision are the ones who capture the massive moves.
Rahul’s Tip : Don’t rush behind every breakout. Wait for zones where probability aligns with psychology . That’s where the wealth-building trades lie.
Disclaimer: This analysis is for educational purposes only and should not be taken as financial advice. Please do your own research or consult your financial advisor before investing.
Analysis By @TraderRahulPal (TradingView Moderator) | More analysis & educational content on my profile
👉 If you found this helpful, don’t forget to like and follow for regular updates.
Neowave Forecast| Gold|Bitcoin|Nifty|Bank Nifty|01/10/2025If you have any doubts related to your stocks and portfolio, ask in the comments we will provide you Neowave Chart for that.
Discussed Instruments
#Gold
#Bitcoin
#Nifty
#Bank Nifty
Previous Video Analysis 30/09/2025

Bitcoin Under Pressure: Bearish Momentum BuildsBitcoin recently transitioned from a corrective decline into a consolidation phase, where price activity showed reduced volatility and market indecision. The breakout from this range has introduced renewed momentum, highlighted by strong bullish candles and a clear shift in trend dynamics. This move reflects fresh capital entering the market, suggesting growing investor confidence and positioning for potential continuation.
Despite this momentum, the structure also shows signs that rapid acceleration could invite short-term profit-taking, which may create phases of corrective retracement before the broader trend direction is reestablished. The market remains sensitive to global financial sentiment, liquidity cycles, and broader adoption narratives, meaning volatility should be expected even within an upward bias.
Overall, current conditions reflect a shift toward renewed optimism, with momentum favoring buyers while maintaining the likelihood of temporary corrections as part of a healthy market cycle.

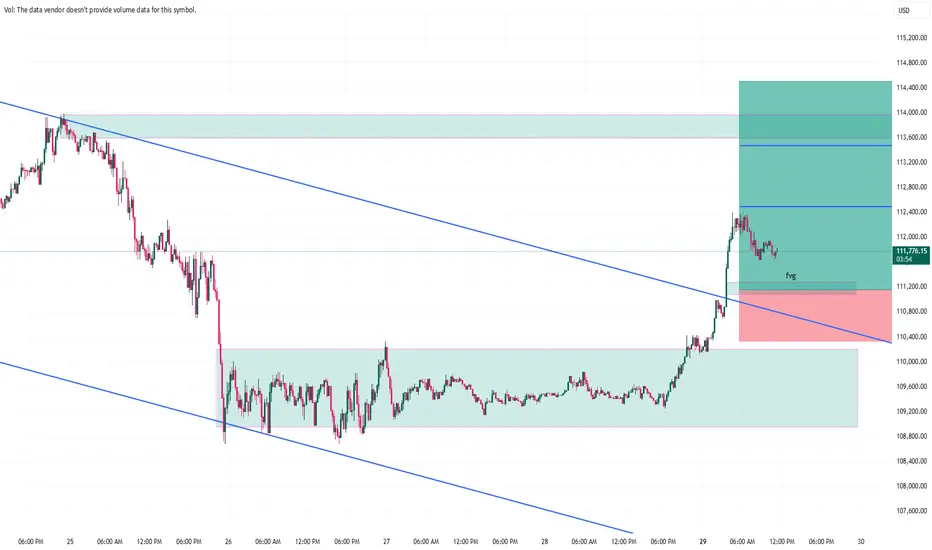
Bitcoin – Let’s Play the Resistance Game at 114,500Bitcoin on the 1-hour chart has entered a critical resistance zone around 114,200–114,500. Price has rallied strongly from the recent lows near 113,000, but now faces a major supply area. The structure suggests that BTC could face rejection here and move back toward the support zone near 112,600 if sellers step in.
As long as price stays below 114,500, this resistance remains valid. A clean breakout above this level with strong momentum would invalidate the bearish view and open the path for higher levels. On the downside, holding support near 112,600 will be key for buyers to maintain control.
Disclaimer: This analysis is for educational purposes only and should not be taken as financial advice. Please do your own research or consult your financial advisor before investing.
Analysis By @TraderRahulPal (TradingView Moderator) | More analysis & educational content on my profile
👉 If you found this helpful, don’t forget to like and follow for regular updates.

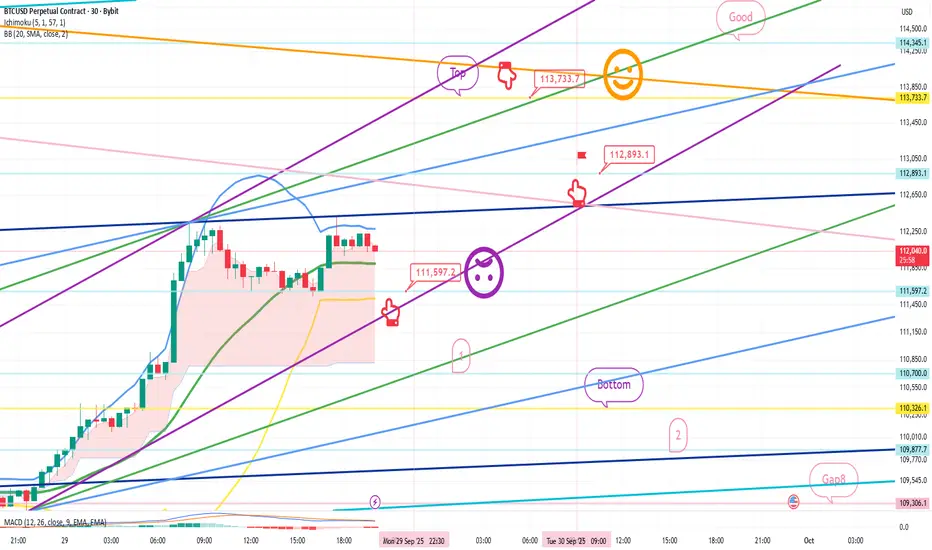
September 29 Bitcoin Bybit chart analysisHello
It's a Bitcoin Guide.
If you "follow"
You can receive real-time movement paths and comment notifications on major sections.
If my analysis was helpful,
Please click the booster button at the bottom.
This is a Bitcoin 30-minute chart.
There are no Nasdaq indicators released today.
I developed a strategy based on the rising pattern.
*Red finger movement path:
One-way long position strategy
1. $111,597.2 long position entry point / Stop loss if the purple support line is broken
2. $113,733.7 long position first target -> Good second target
If the strategy is successful, the 112,8K level indicated
can be used as a long position re-entry point.
Up to the first section below, the price is moving sideways to the right.
From the bottom section touch, there's a high probability of a decline to the Gap 8 retracement level.
Please check the bottom support line and section 2 indicated below.
Up to this point,
I ask that you use my analysis for reference only.
I hope you operate safely, with a focus on principled trading and stop-loss orders.
Thank you.
Neowave Forecast| Gold|Bitcoin|Nifty|Bank Nifty|30/09/2025If you have any doubts related to your stocks and portfolio, ask in the comments we will provide you Neowave Chart for that.
Discussed Instruments
#Gold
#Bitcoin
#Nifty
#Bank Nifty
Yesterday Video-

BTC Market Update – Bullish Trend RebuildingBTC Market Update – Bullish Trend Rebuilding
The market structure on Bitcoin highlights a sequence of expansion, consolidation, and sharp corrective phases. After reaching a peak around 115,000, the price shifted into a prolonged sideways phase, where liquidity built up before a decisive breakdown. This breakout introduced stronger bearish momentum, driving price toward lower ranges.
Currently, Bitcoin is stabilizing around 109,500 after the decline, with price action suggesting a potential extension into deeper liquidity zones near the lower range before regaining upward momentum. The projected flow reflects a scenario where downside movement acts as a liquidity sweep, providing the conditions for buyers to re-engage.
The broader outlook remains constructive. Even with short-term pressure favoring the downside, the long-term structure still supports recovery potential. A strong reaccumulation phase could lift Bitcoin back toward the 115,000 zone, aligning with the market’s tendency to reclaim imbalance after periods of sharp displacement.

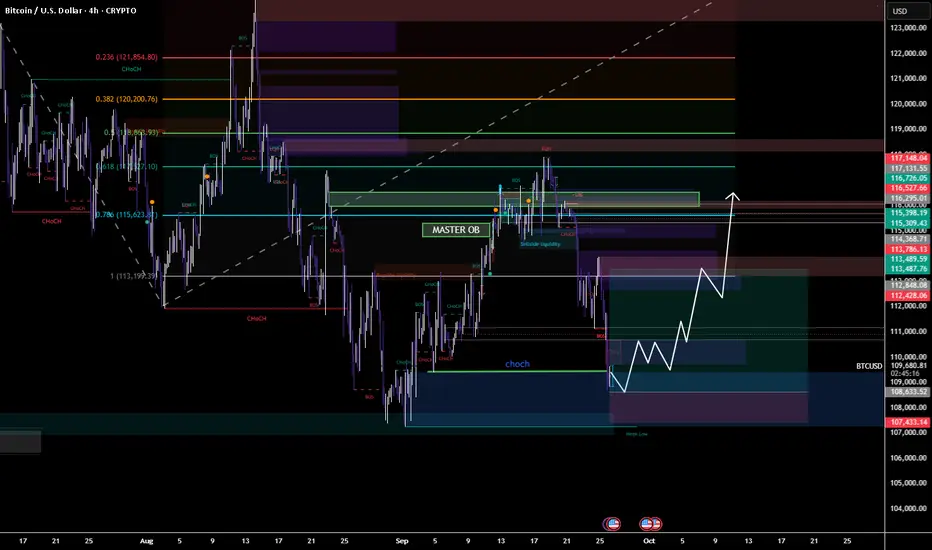
BTC Bulls Eyeing a Reversal From Liquidity SweepBTC Bulls Eyeing a Reversal from Liquidity Sweep”
📌 Description:
Bitcoin swept downside liquidity near 108k, tapping into a demand zone. If this level holds, expect a strong recovery toward the 113.5k–116.5k supply zones, with the Master OB acting as a key magnet for price.
📈 Trade Plan (4H BTCUSD)
🔹 Entry Zone (Long):
108.0k – 109.0k (liquidity sweep + demand zone).
🔹 Stop Loss (SL):
Below 107.0k (weak low / invalidation).
🔹 Take Profit (TP):
TP1: 112.4k (minor FVG close)
TP2: 113.8k – 114k (OB retest zone)
TP3: 115.5k – 116.2k (major supply / Master OB)
🎯 Risk-to-Reward (approx):
Entry: 108.5k
SL: 107k (≈ -1.5k / -1.3%)
TP1: 112.4k (≈ +3.9k / +3.6%) → RR ≈ 1:2.7
TP2: 114k (≈ +5.5k / +5%) → RR ≈ 1:3.8
TP3: 116.2k (≈ +7.7k / +7.1%) → RR ≈ 1:5.2
⚡ Clean long setup: liquidity sweep → bullish CHoCH → push into OB/supply above.
Title: BTCUSD – Breakout from Falling Channel | Long SetupDescription:
Bitcoin has broken out of the falling channel with strong bullish momentum.
✅ Clean breakout from the downtrend structure
✅ Retest of the breakout level showing support
✅ Long position aligned with bullish continuation
Bias: Bullish as long as price holds above the channel breakout level.
Note: This is not financial advice. Please do your own research and manage risk accordingly.
Gold | Bitcoin | Nifty | Bank Nifty | Neowave AnalysisNamaskaram Everyone
We have discussed following instruments in this video, if you have any query you can ask in the comments.
#Gold
#Bitcoin
#Nifty
#Bank Nifty
COINBASE:BTCUSD FX:XAUUSD OANDA:XAUUSD NSE:BANKNIFTY NSE:NIFTY

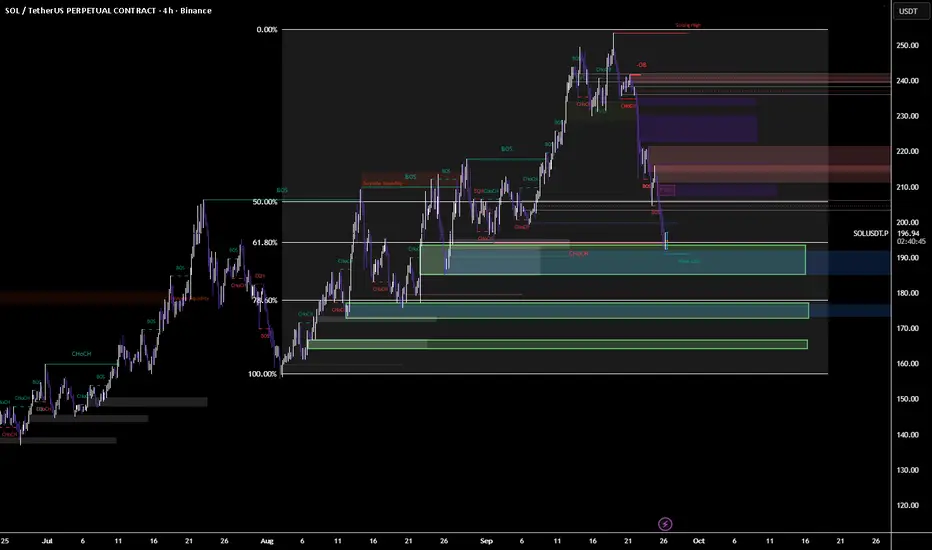
SOL Ready TO Ignite from Demand - Eyeing $240 Supply “SOL Ready to Ignite from Demand – Eyeing $240 Supply”
📌 Description:
Solana swept liquidity into the $192–195 demand zone and is showing signs of strength. As long as $185 holds, bulls may drive price into the $210–240 supply zones. First target sits at $210 (FVG close), with higher objectives at $225 and $240. If demand fails, watch for a rejection short from $210.
Long Setup (Buy Idea)
Entry Zone: $192 – $195 (current demand + weak low + 61.8 retracement support)
Stop Loss (SL): $185 (below demand zone + liquidity sweep area)
Take Profit (TP):
TP1: $210 (FVG imbalance zone)
TP2: $225 (OB resistance zone)
TP3: $240 (supply zone / strong high)
⚖️ Risk–Reward: Around 1:3 to 1:4 if TP2 or TP3 hits.
🔴 Short Setup (Sell Idea, only if rejection occurs)
Entry Zone: $210 – $215 (FVG imbalance / supply)
Stop Loss (SL): $222 (above imbalance zone)
Take Profit (TP):
TP1: $195 (back to current demand)
TP2: $180 (major demand below)
⚖️ Risk–Reward: Around 1:2 to 1:3.
📌 Bias: Currently, price tapped demand and bounced — so long setup looks stronger unless $185 breaks.
USDJPY (Neowave Trading Idea)FX:USDJPY Namaskaram Everyone
Welcome to intelligent investor, we provide market insights by synchronising and combining all the price action waves from different time frames and gives you single trend.
Now Risk Reward is highly favourable
Trading with risk management, that is 1 percent rule with my charts.
How to Read My Charts-

BTC LONG SETUPBTC/USDT – 1H Long Setup Analysis
🔹 Current Price: 111,653 USDT (Bitget Perpetual)
🔹 Trend: After a sharp drop from recent highs, BTC is showing signs of forming a base with a possible rebound setup.
⸻
Key Observations:
1. Support Zone:
• Strong support is visible around 110,744 – 110,747 USDT, marked by previous demand and horizontal structure.
• Below that, deeper support lies near 109,383 – 108,534 USDT.
2. Resistance Levels / Targets:
• TP1: ~115,078 – 115,980 USDT
• TP2: ~117,340 – 118,165 USDT
• Higher extension target: ~119,810 USDT
3. Trend Structure:
• Price broke a rising channel but has bounced back after a correction.
• Current pullback is retesting demand, indicating potential continuation to the upside if bulls defend the base.
4. Indicators:
• EMA 9 (blue) is currently under pressure, suggesting short-term weakness, but if reclaimed, momentum could shift bullish.
• Volume shows increased activity at recent lows, hinting at accumulation.
⸻
Long Trade Plan (Swing Bias):
✅ Entry Zone: Between 111,000 – 111,700 USDT (current price zone, near support)
✅ Stop-Loss: Below 110,744 USDT (to avoid fakeouts)
✅ Take Profit Targets:
• TP1 → 115,078 – 115,980 USDT
• TP2 → 117,340 – 118,165 USDT
• Extended TP → 119,810 USDT
📊 Risk-Reward Ratio: Favorable (approx. 1:3+ if targeting TP2).
⸻
Summary:
BTC is consolidating above a strong support base. If bulls hold the 111K–110.7K zone, upside targets remain valid towards 115K–118K. A break below 110.7K would invalidate this setup and could push price toward 109K or lower.
