Gold Neowave UpdateFX:XAUUSD Namaskaram Everyone
Welcome to intelligent investor, we provide market insights by synchronising and combining all the price action waves from different time frames and gives you single trend.
GOLD & BTCUSD Video Analysis
How To Read My Charts...Click Below
1-BTCUSD

Gold & BitCoin (Neowave Forecast)Namaskaram Everyone
Welcome to intelligent investor, we provide market insights by synchronising and combining all the price action waves from different time frames and gives you single trend.
How To Read My Charts...Click Below

Bitcoin Bybit chart analysis September 23Hello
It's a Bitcoin Guide.
If you "follow"
You can receive real-time movement paths and comment notifications on major sections.
If my analysis was helpful,
Please click the booster button at the bottom.
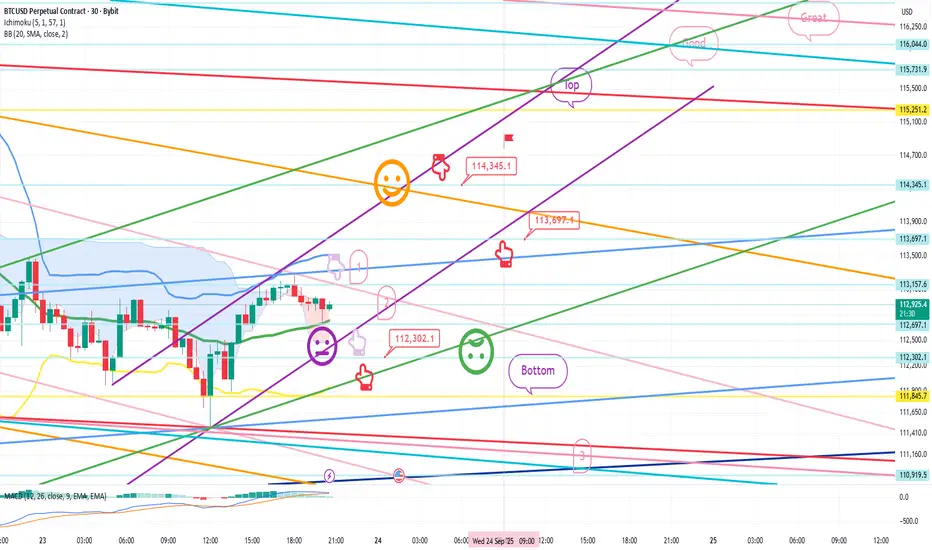
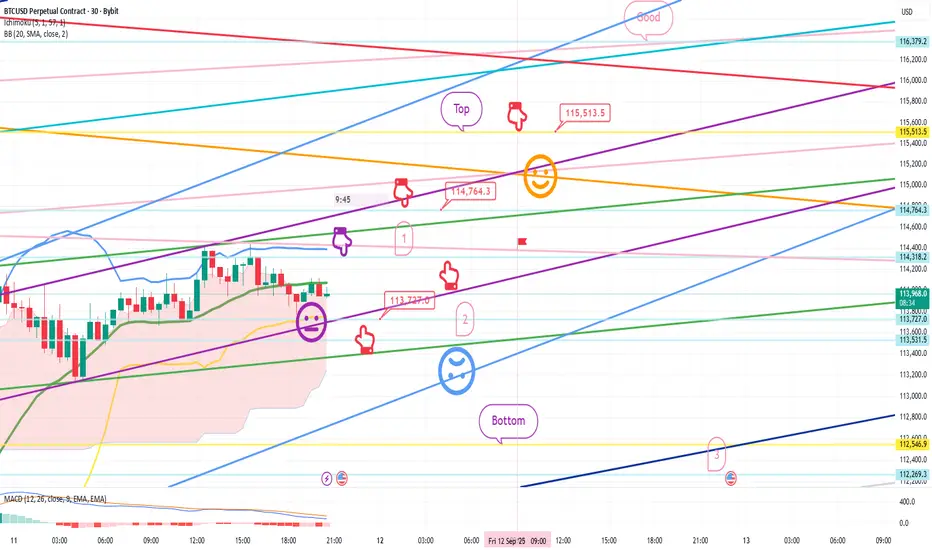
This is Bitcoin's 30-minute chart.
There's an indicator release near 11:00 AM on the Nasdaq,
and I expected a small fluctuation.
I proceeded as safely as possible, considering the current situation.
*When the red finger moves,
One-way long position strategy:
1. Long position entry point at $112,302.1 / Stop loss price if the green support line is broken.
2. Long position initial target at $114,345.1 -> Target prices in order of Top, Good, Great.
After reaching the target price of $114.3K,
you can re-enter the long position at the indicated price of $113.6K.
In the case of 1->2 above,
there's a strong possibility of an upward movement along the purple parallel line. (The 5+15 pattern is still in place.)
The current rebound has already formed a double bottom,
so a drop below the bottom
is not a good move for long positions.
In case of a delay, I've indicated up to section 3 at the bottom.
Thanks to the recent interest from newcomers,
I've made this post publicly available for the first time in a while.
Please use my analysis for reference only.
I hope you operate safely, with a focus on principled trading and stop-loss orders.
Thank you.
BTC Neowave UpdateBTC Intraday Update
Our entry 1 is activated yesterday, so maintain that with stoploss
2nd entry will be created when.....s1 will complete by breaking up of black cycles
Short Term Trend
Learn More about trend here

Bitcoin Market Report – Liquidity Grabs Before Next ExpansionThe market is showing clear signs of engineered volatility, with strong impulsive moves followed by rapid retracements. This behavior reflects liquidity targeting, where price sweeps both sides before resuming its broader path.
Current conditions suggest Bitcoin is in a redistribution stage, with momentum alternating to trap short-term participants. The repeated liquidity grabs signal that larger players are accumulating positions while clearing out weaker hands.
The overall structure points to continued testing of lower liquidity pools before any major directional expansion. Once this phase is complete, the market is likely to enter a more decisive trend, supported by the buildup of institutional flow and reduced volatility pockets.
In short, Bitcoin is cycling through liquidity collection and preparation, positioning itself for a larger move as market balance shifts.

ETHUSD 2.5R sell side trade scenarioETHUSD is forming sell side trades as current bias and draw on liquidity both are at down side. Price has also left SIBIs to attract price upside for a while and then return back to target. In weekend price may have low volatility and trade possibly generate on Monday or later.
1. There is a daily time frame bearish FVG.
2. There is bearish FVG in 4H TF. Now price is approaching it slowly.
3. These FVGs are forming inside OTE zone.
4. Order flow is bearish. And draw on liquidity is also at downside.
5. Most probably price will take liquidity of FVGs and create MSS/CISD/TS/iFVG in LTF.
6. Price should show rejection/reversal in LTF (5m,1m) at FVG zone.
7. BTC is also forming similar scenario.
All these combinations are signalling a high probability and 2.5R trade scenario.
Note – if you liked this analysis, please boost the idea so that other can also get benefit of it. Also follow me for notification for incoming ideas.
Also Feel free to comment if you have any input to share.
Disclaimer – This analysis is just for education purpose not any trading suggestion. Please take the trade at your own risk and with the discussion with your financial advisor.

BTCUSD 3R Sell side trade BTCUSD is forming sell side trade as current bias and draw on liquidity both are at down side. Price has also left SIBIs to attract price upside for a while and then return back to target. In weekend price may have low volatility and trade possibly generate on Monday or later.
1. There is a 4H time frame bearish FVG.
2. There is bearish FVG in 1H and 30m overlapping with 4H FVG. Now price is approaching it slowly.
3. These FVGs are forming inside Fib golden zone.
4. Order flow is bearish. And draw on liquidity is also at downside.
5. Most probably price will take liquidity of FVGs and create MSS/CISD/TS/iFVG in LTF.
6. Price should show rejection/reversal in LTF (5m,1m) at FVG zone.
All these combinations are signalling a high probability and 3R trade scenario.
Note – if you liked this analysis, please boost the idea so that other can also get benefit of it. Also follow me for notification for incoming ideas.
Also Feel free to comment if you have any input to share.
Disclaimer – This analysis is just for education purpose not any trading suggestion. Please take the trade at your own risk and with the discussion with your financial advisor.

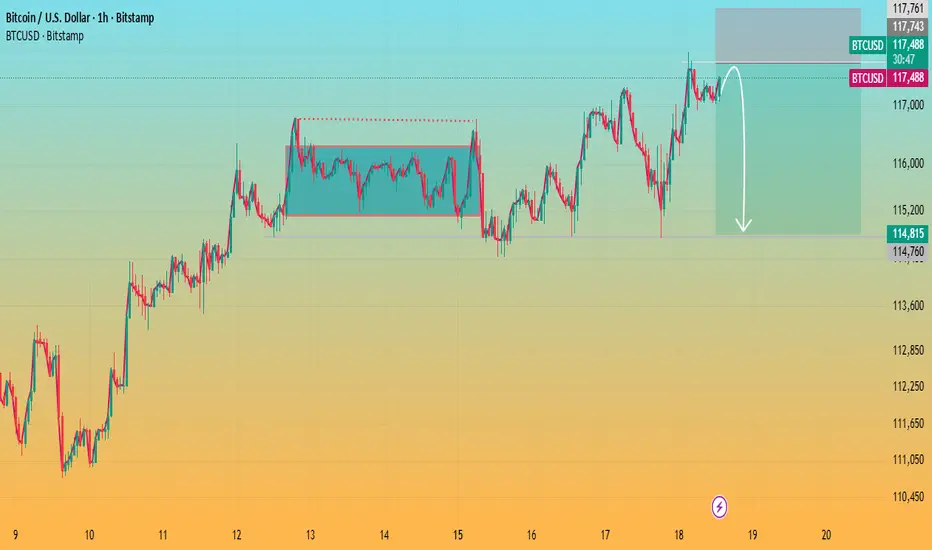
Bitcoin Testing Resistance with Potential Pullback AheadKey observations:
Range Breakout: Earlier, Bitcoin broke out of a consolidation zone (marked box), which triggered the recent upward move.
Resistance Zone: Price is hovering near the 5.15%–5.42% gain zone, where selling pressure has historically emerged.
Pullback Signal: The drawn arrow suggests a possible rejection at this resistance, pointing to a corrective move down toward the 3% zone.
Momentum Check: If BTC fails to hold above this resistance, a retracement is likely. However, a strong breakout could open the door toward 6% gains.
📌 Conclusion:
Bitcoin is at a decision point. Rejection at resistance could bring a pullback toward 2.8%–3.0%, while a breakout above 5.4% would continue the bullish momentum.
Gold Chart Analysis and Price PredictioinGold Chart Analysis and Price Prediction
The Gold Chart is seen to to making Cup and Handle pattern which indicates a bullish sign. Market completely absorbed FED interest cut decisions. Even though in the FED press meet he signed uncertainty in further anticipated rate cuts, Gold is showing bullish sign. A probable break out could be witness after 23 Sepetember'2025.

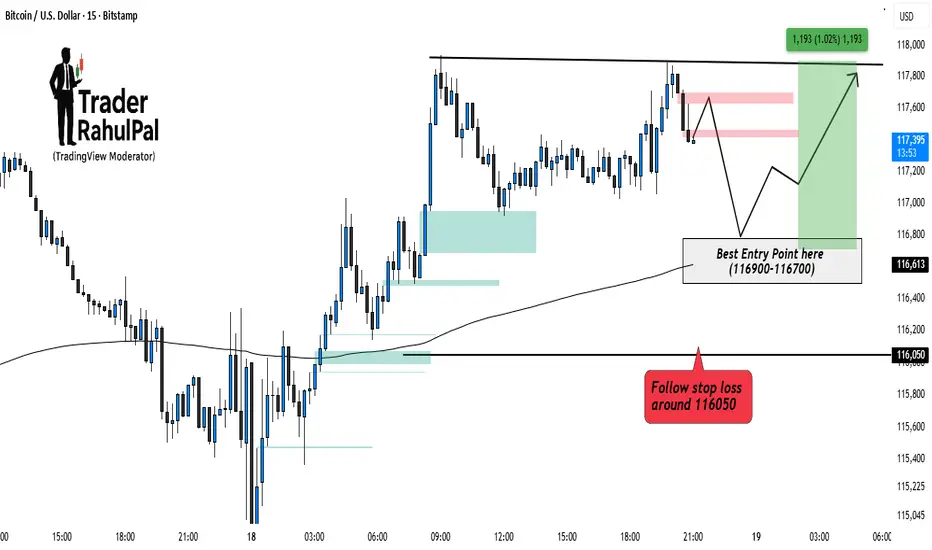
Bitcoin Bullish side Entry Setup Intraday – Key Levels to Watch!Bitcoin is consolidating near its upper resistance zone after a recent bounce. Price action suggests that a pullback into the 116900–116700 range can offer a high-probability entry for buyers. Maintaining a stop loss around 116050 helps to protect against deeper downside risk. As long as this zone holds, the bias remains bullish, with potential upside toward 117800–118000 . Intraday traders should closely watch how price reacts around the entry zone before positioning.
Disclaimer: This analysis is for educational purposes only and should not be taken as financial advice. Please do your own research or consult your financial advisor before investing.
Btc 1H long ideaHere's a detailed description of the information presented:
• Financial Instrument: The chart is for Bitcoin (BTC) priced against USDT (Tether), a stablecoin. The "Perp Perpetual Mix Contract" suggests this is a futures or derivatives contract that doesn't expire.
• Timeframe: The chart is set to 1-hour (1H), meaning each candlestick represents one hour of price movement.
• Trading Position: A long position is currently open, indicated by the green and red boxes. A long position is a bet that the price will increase.
• Entry Point: The white horizontal line marks the entry price at 116,980.2.
• Take-Profit Target: The top of the green box, labeled "Target," is at 119,810.0. The potential profit for reaching this target is 3,517.2 USDT, which is a 3.02% gain.
• Stop-Loss: The bottom of the red box, labeled "Stop," is at 114,658.0. This is the price level where the trade will automatically close to limit losses. The potential loss is 1,646.4 USDT, or a 1.42% drop.
• Risk/Reward Ratio: The text "Risk/Reward Ratio: 2.14" indicates that the potential profit is 2.14 times greater than the potential loss. This is a key metric used by traders to evaluate if a trade is worth the risk.
• Price and Indicators:
• The current price is shown as 117,210.1.
• The chart includes various indicators and tools, such as moving averages (the blue and yellow lines moving with the price) and a volume histogram at the bottom (red and green bars).
• There are also horizontal white lines that likely represent significant support and resistance levels.
In summary, the image provides a clear visualization of a planned crypto trade, outlining the specific entry, stop-loss, and take-profit levels, as well as the associated risk/reward profile.

BTCUSD 4.5R sell side beautiful scenarioBTCUSD is in range from last 5 days but now it is showing Smart Money’s interest. And it appears a down side trade is being developed as it has swept upside liquidity and forming CISD after displacement.
1. It has taken upside liquidity.
2. Formed CISD after displacement.
3. It has formed FVG and BPR on 1h time frame and price is inside POI.
4. POI is created inside OTE zone confirming good RnR.
5. Most probably price will take liquidity of FVG and OTE zone and create MSS/TS in LTF.
6. Price should show rejection/reversal in LTF (5m,1m) at FVG zone.
All these combinations are signalling a high probability and 4.5R trade scenario.
Note – if you liked this analysis, please boost the idea so that other can also get benefit of it. Also follow me for notification for incoming ideas.
Also Feel free to comment if you have any input to share.
Disclaimer – This analysis is just for education purpose not any trading suggestion. Please take the trade at your own risk and with the discussion with your financial advisor.

ETH Setup You Can't Ignore:4k FVG to 5k Seller Zone ⚠️ ETH Setup You Can’t Ignore: 4K FVG to 5K SELLER ZONE!
ETHUSD – Fair Value Gap & Liquidity Sweep Setup
Ethereum is trading within a critical range, presenting a potential ICT-style setup:
Fair Value Gap (4000–4200) – Key demand zone with a “Golden Line” midpoint; price may dip to fill this imbalance before reversing.
Seller Zone (~5000) – Major supply zone where profit-taking or distribution could trigger.
Bias – Expect a sweep of downside liquidity, a reaction within the FVG, and a possible rally toward the 5000 zone if higher timeframe confluence supports it.
⚠️ Always wait for confirmation and manage risk before execution.

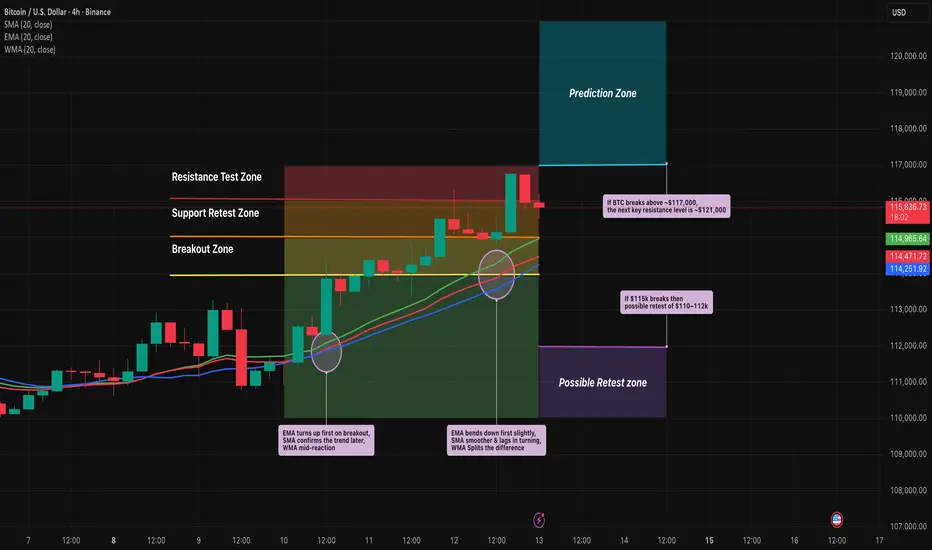
EMA vs SMA vs WMA: Which Moving Average Should You Use?🔎 Intro / Overview
Moving Averages remain one of the most trusted tools in technical analysis. They smooth price action, highlight the trend, and often act as dynamic support or resistance.
In this post, we compare the 20-period SMA, EMA, and WMA on BTCUSD 4H to show how each reacts differently to market moves.
___________________________________________________________
📔 Concept
SMA (Simple Moving Average): Every candle in the lookback is weighted equally → smooth but slower to react.
EMA (Exponential Moving Average): Recent candles carry more weight → reacts faster, hugs price closely.
WMA (Weighted Moving Average): Linear weighting → a balance between SMA’s stability and EMA’s sensitivity.
The difference lies in responsiveness. Faster averages react early but risk false signals, slower averages confirm trends but lag.
___________________________________________________________
📌 How to Use
1️⃣ Plot the 20-period SMA, EMA, and WMA together.
2️⃣ Watch how each responds during pullbacks, rallies, and consolidations.
3️⃣ Use EMA for quicker signals, SMA for smoother long-term view, and WMA if you prefer a middle ground.
4️⃣ Combine with price action or RSI to avoid relying on moving averages alone.
___________________________________________________________
🎯 Trading Plan
Intraday traders: EMA crossovers (e.g., 9 vs 21 EMA) for faster entries and exits.
Swing traders: SMA for identifying trend direction and major support/resistance.
Balanced traders: WMA for medium-term setups where stability and responsiveness matter equally.
Always align the moving average with your trading style and risk appetite.
___________________________________________________________
📊 Chart Explanation
On BTCUSD 4H:
EMA (red) bent upward first during the $114k breakout, SMA (blue) confirmed later, and WMA (green) sat between them.
At the $115k retest, EMA dipped first, while SMA lagged.
At $116.5–117k resistance, EMA whipsawed but SMA stayed smoother.
Notice how these differences become clear during sharp pullbacks, quick rallies, and sideways ranges.
___________________________________________________________
👀 Observation
EMA is quick but noisy ⚡, SMA is calm but late 🕰️, WMA strikes a middle ground ⚖️.
___________________________________________________________
❗ Why It Matters?
Choosing the right moving average impacts how quickly you spot entries, confirm trends, and manage stop-losses. Understanding the differences helps traders adapt strategies to both trending and sideways markets.
___________________________________________________________
🎯 Conclusion
No single moving average is “best.” Each serves a purpose depending on the timeframe and style of trading. The key is consistency — choose one that aligns with your plan, test it, and apply it with discipline.
👉 Which one do you prefer in your trading — EMA, SMA, or WMA?
___________________________________________________________
⚠️ Disclaimer
📘 For educational purposes only ·
🙅 Not SEBI registered ·
❌ Not a buy/sell recommendation ·
🧠 Purely a learning resource ·
📊 Not Financial Advice
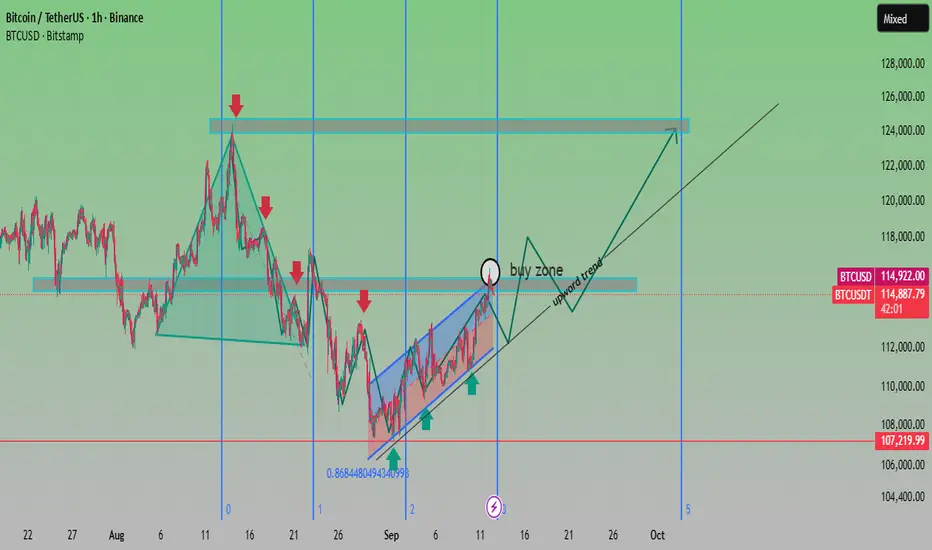
BTC Buy Zone Forming – Potential Bullish Breakout AheadAnalysis:
Trend Structure: After a corrective decline from the $124K resistance area, BTC has rebounded strongly, forming a rising channel (highlighted in blue).
Support Levels: Strong demand observed near $107,200, aligning with the 0.868 Fibonacci retracement, making it a crucial support zone.
Buy Zone: Chart highlights the $114K–$116K range as a buy zone before continuation of the upward trend.
Resistance Levels: Key resistance remains around $124K–$126K, which is the next major target if the bullish momentum sustains.
Outlook: As long as BTC stays above $114K support, the bias remains bullish, with a potential rally towards $120K–$124K. A breakdown below $112K would invalidate the bullish scenario.
✅ Bias: Bullish continuation
🎯 Targets: $120,000 → $124,000
🛑 Invalidation: Break below $112,000
USDJPY Sell entry 1::5 RnRUSDJPY is forming a beautiful day trade for selling side. It can be a very good intraday trade if everything goes as per plan.
1. Price kissed 4H Iceberg Block and showed sniper liquidity and left bearish FVGs at both 30m and 15m.
2. 15m FVG is inside 30m FVG and upper side of OTE area.
3. Now it is moving toward FVG areas after taking reversal from bullish 15m BPR
4. Most probably price will take liquidity of FVG and OTE zone and create MSS in LTF.
5. Order flow confirming bearish bias.
6. Price should show rejection/reversal in LTF (5m,1m) at FVG zone.
All these combinations are signalling a high probability and high Risk and Reward (1:5) trade scenario.
Note – if you liked this analysis, please boost the idea so that other can also get benefit of it. Also follow me for notification for incoming ideas.
Also Feel free to comment if you have any input to share.
Disclaimer – This analysis is just for education purpose not any trading suggestion. Please take the trade at your own risk and with the discussion with your financial advisor.

Bitcoin Bybit chart analysis September 11 (CPI)Hello
It's a Bitcoin Guide.
If you "follow"
You can receive real-time movement paths and comment notifications on major sections.
If my analysis was helpful,
Please click the booster button at the bottom.
This is Bitcoin's 30-minute chart.
The CPI indicator will be released shortly at 9:30 AM.
I implemented the strategy based on Nasdaq movements.
*When the red finger moves,
Long position strategy
Confirm the upward wave by touching the first section above (autonomous shorting)
1. $113,727 long position entry point / Stop loss if the light blue support line is broken
2. $114,764.3 long position 1st target -> Top 2nd -> Good 3rd target
If the daily candlestick forms before 9:00 AM tomorrow,
you can switch to a short position if the top section is touched.
You can also use the first section shown as a long position switching point.
If the price falls immediately without touching the purple finger at the top, the final long position is at the second level. The strategy was to place a stop-loss order from the breakout of the light blue support line until the possibility of a sideways movement.
From the breakout of the light blue support line, the price opens up to the bottom -> level 3, so long positions should be cautious.
Please use my analysis to this point for reference only.
I hope you operate safely, adhering to principled trading and a stop-loss order.
Thank you.
BTC - LONGBitcoin has broken above the 200 EMA, confirming bullish bias.Price is supported by the 10 & 20 EMA crossover (short-term bullish trend). As long as BTC holds above $115,000, upside targets are $117,600 and then $120,000. If it loses $115,000, caution — the bullish setup may fail.

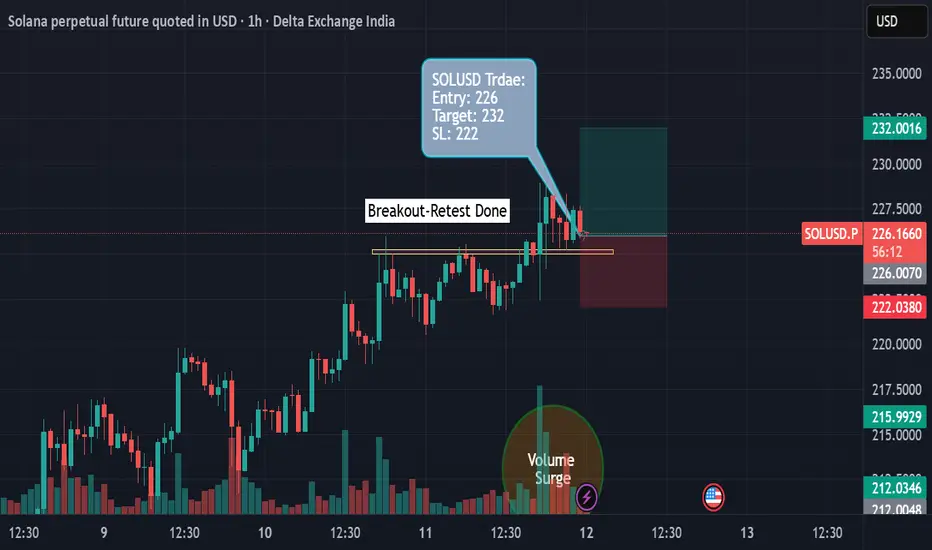
Solana (1H Chart) - Breakout-Retest Long TradeThis is a long trade setup for Solana perpetual futures based on a breakout and retest structure, placed on the 1-hour chart.
Trade Overview
• The chart shows price consolidating near a horizontal resistance zone (yellow line), followed by a breakout above this level and a subsequent retest.
• The entry is taken after confirmation of support at the breakout zone, aiming for a move toward the upper target.
Entry, Target, and Stop-Loss
• Entry: Around 226 USD, following a successful retest of the yellow breakout level.
• Target: 232 USD, marked in green at the upper end of the chart’s risk-reward box.
• Stop-Loss: 222 USD, just below the retest zone, minimizing risk if price reverses.
Trade Logic and Reasoning
• The trade capitalizes on a classic breakout-retest pattern, where price first breaks resistance and then tests it as new support.
• Increasing volume near the breakout supports bullish momentum.
• Risk management is prominent, with a clear stop-loss set below the retest area.
Risk/Reward Profile
This setup offers a favorable risk-to-reward ratio, as visualized by the green/red shaded box indicating potential gain versus loss for the position.
AVAXUSD Good Long @23.4-23 rangeAVAXUSD made a good base around 23 level. It acted as a Strong support from past falls. Now again when some correction happening we will go long on AVAXUSD from 23 range.
Entry - 23.4-23 (Accumulation zone)
Target - 24.3,25,29
SL - 21

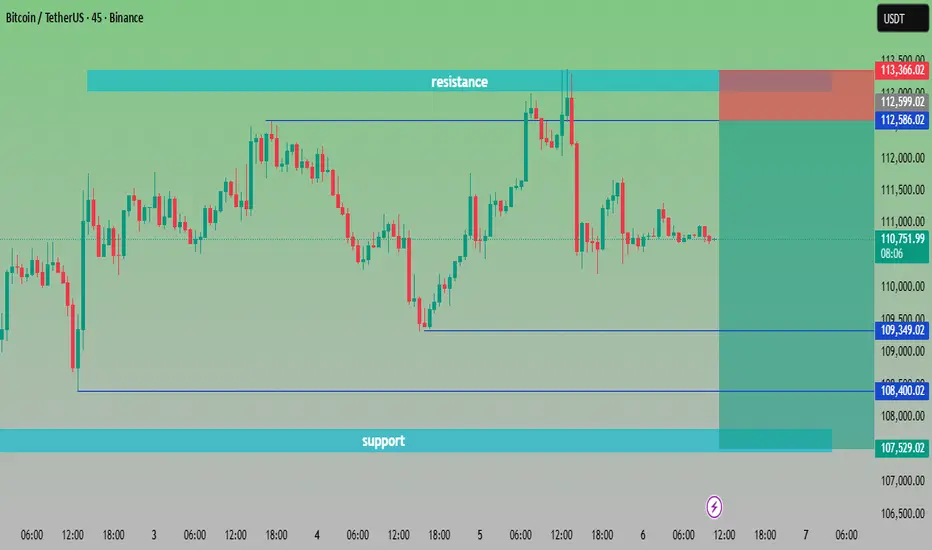
“BTC/USDT at Crossroads | Key Levels to Watch🔎 Chart Analysis – BTC/USDT (45m)
Resistance Zone: Around 112,586 – 113,200 USDT. Price has tested this area multiple times but failed to break out, confirming strong selling pressure.
Support Zone: Around 107,529 – 108,400 USDT. Buyers have consistently defended this zone, making it a key demand area.
Current Price: 110,720 USDT, sitting in the middle of support and resistance.
📌 Scenarios:
Bullish Case 🟢🚀 – If BTC breaks above 112,586 USDT, momentum could push toward 113,500+ USDT.
Bearish Case 🔴📉 – If BTC fails to hold 109,349 USDT, price may retest the deeper support around 107,500 USDT.
⚖️ Trading Plan Idea:
Long Entry: Above 112,600 breakout ✅
Short Entry: Below 109,300 breakdown ❌
Target Zones:
Upside 🎯 → 113,500+
Downside 🎯 → 107,500
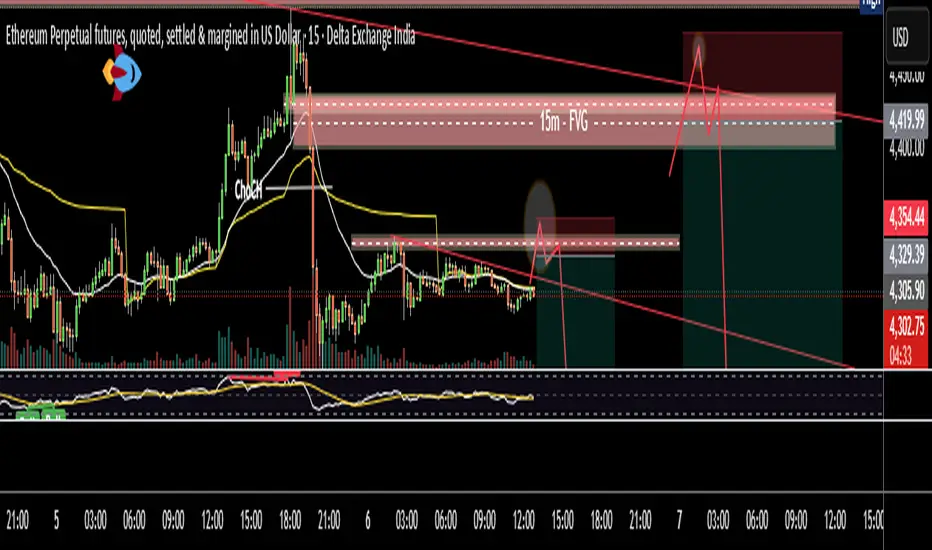
BTC developing a good sell opportunityBTC is moving in range for long time. Now it has shown a displacement after ChoCH and formed a bearish 15m FVG. There may be a good trade at sell side if price approach it. Well there are two trade scenarios are forming.
1. Price moves to 15m FVG and OTE overlap zone.
2. Most probably price will take liquidity of FVG and OTE zone and create MSS in LTF.
3. After breaking trend line it should pullback till FVG/trend line or any newly created OB/FVG.
All these combinations are signalling a high probability and high Risk and Reward (1:8) trade scenario.
Note – if you liked this analysis, please boost the idea so that other can also get benefit of it. Also follow me for notification for incoming ideas.
Also Feel free to comment if you have any input to share.
Disclaimer – This analysis is just for education purpose not any trading suggestion. Please take the trade at your own risk and with the discussion with your financial advisor.

ETH multiple Sell OpportunitiesETH is moving in range for almost a week time. Now it has shown a displacement after ChoCH and formed a bearish 15m FVG. There may be a good trade at sell side if price approach it. Well there are two trade scenarios are forming.
Trade # 1
1. Price is moving around a short term trend line and resistance.
2. If price breaks trend line and take the liquidity of resistance than it may be sell trade.
Trade # 2
3. Price moves to 15m FVG and OTE overlap zone.
4. Most probably price will take liquidity of FVG zone and break trend line.
5. After breaking trend line it should pullback till FVG/trend line or any newly created OB/FVG.
All these combinations are signaling a high probability and high Risk and Reward (1:8) trade scenario.
Note – if you liked this analysis, please boost the idea so that other can also get benefit of it. Also follow me for notification for incoming ideas.
Also Feel free to comment if you have any input to share.
Disclaimer – This analysis is just for education purpose not any trading suggestion. Please take the trade at your own risk and with the discussion with your financial advisor.