BTC/USD Bullish Order Block Setup – Targeting 114,328BTC/USD (1H) Analysis
Trend & Structure: Price has been respecting a rising channel with clear support and rejection lines. After testing the support line, it rebounded and is now consolidating.
EMA Strategy: Price is fluctuating around the 70 EMA (111,081) and 200 EMA (110,902), showing short-term consolidation. A bullish crossover above 70 EMA may confirm further upside momentum.
Order Block (OB) Zone: The marked OB Buying Zone (109,261 – 110,252) is a strong demand area where buyers are expected to step in.
Support & Resistance: Support lies at 109,261, while the next resistance/target is 114,328.
Risk-Reward Strategy: A potential long entry from the OB zone offers a favorable R:R ratio toward the 114,328 target point. Stop loss ideally below 109,246.
Price Action: Recent wicks suggest rejection of lower levels, strengthening the bullish bias.
✅ Signal: Buy from OB Buying Zone (109,261 – 110,252)
🎯 Target: 114,328
🛑 Stop Loss: Below 109,246
Overall Bias: Bullish continuation if price respects the OB buying zone and EMA support.
1-BTCUSD

Bitcoin Bybit chart analysis September 3Hello
It's a Bitcoin Guide.
If you "follow"
You can receive real-time movement paths and comment notifications on major sections.
If my analysis was helpful,
Please click the booster button at the bottom.
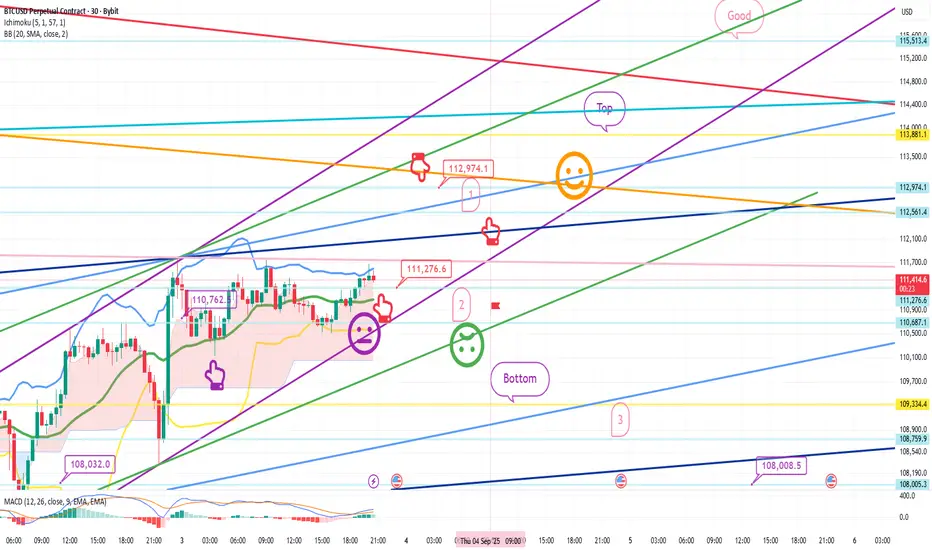
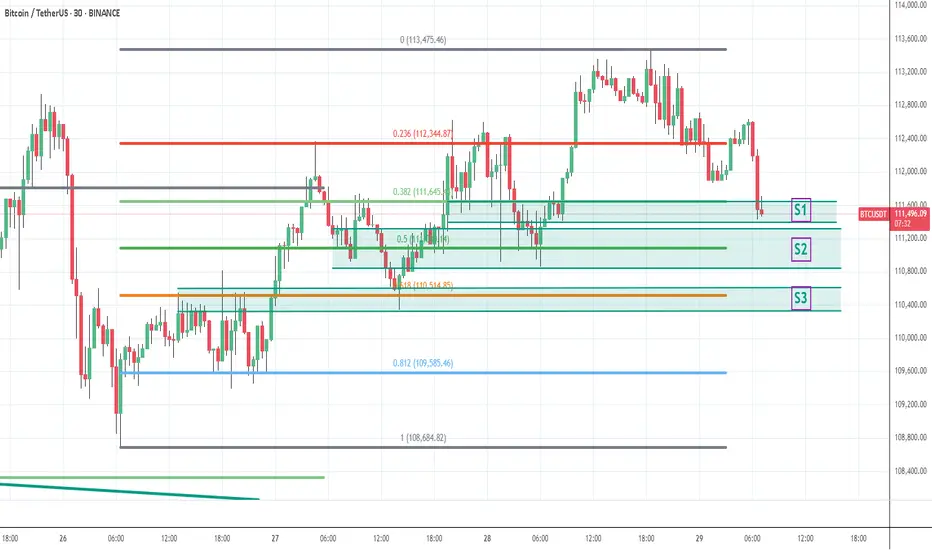
This is a Bitcoin 30-minute chart.
The Nasdaq indicators will be released at 11:00 AM.
At the bottom left is the long position entry point from the 1st, $108.032.
Above that is the purple finger at $110,762.5.
I've linked the strategy to the long position re-entry point.
*If the red finger follows the path,
it's a one-way long position strategy.
1. Long position entry point at $111,276.6 / Stop loss if the green support line is broken.
If the price falls sharply from the current level,
it's a long position waiting point up to section 2.
If the price touches or breaks the green support line,
it breaks the short-term pattern, which is not a good strategy for long positions.
2. Long position at $112,974.1, first target -> top section, second target
When it reaches 112.9K, the first section is the upper section for re-entry into a long position.
The uptrend line is the green support line -> the deep blue support line.
From the second section, it could fall to the bottom -> the third section -> 108K.
From the deep blue support line,
a medium- to long-term correction and sideways trading may follow, so please keep this in mind.
As long as the Nasdaq doesn't crash today, that's fine.
Please use my analysis as a reference only.
I hope you operate safely, with a strict trading strategy and stop-loss orders.
Thank you.
Gold (XAUUSD) forming wonderful sell scenarioGoldUSD price is moving at higher side and showing weakness. It is also forming double top kind of scenario. We may see a good short trade if liquidity sweep is witness at the resistance level with the additional confirmation of higher volume. Overall trend is still upside but buyers seems exhausted. We may find a good sell trade if Liquidity sweeps at resistance and everything goes as we planned.
1. Price is approaching 4H resistance zone. Which may act as a strong supply zone.
2. Buying is slow and weak.
3. Most probably price will take liquidity of resistance zone and break trend line.
4. After breaking trend line it should pullback till resistance/trend line or any newly created OB/FVG.
All these combinations are signalling a high probability and high Risk and Reward (1:8) trade scenario.
Note – if you liked this analysis, please boost the idea so that other can also get benefit of it. Also follow me for notification for incoming ideas.
Also Feel free to comment if you have any input to share.
Disclaimer – This analysis is just for education purpose not any trading suggestion. Please take the trade at your own risk and with the discussion with your financial advisor.

NZDUSD Forming a Great Sell side scenario....NZDJPY is approaching 4H resistance zone, which has already show rejection previously. There is also a steep bullish trend line creating a confluence. There is a valid 4H FVG at upside. All these things signalling a coming very good sell side opportunity. Below are points detailing the same.
1. Price is approaching 4H resistance zone. Which may act as a strong supply zone.
2. Very steep Bullish Trend line developing a confluence at resistance. Steep trend line is always prone for breakout/breakdown.
3. Most probably price will take liquidity of resistance zone and break trend line.
4. After breaking trend line it should pullback till resistance/trend line or any newly created OB/FVG.
5. There are two possible reversal point 1. At nearest resistance. 2. At 4H FVG and higher trendline.
All these combinations are signalling a high probability and high Risk and Reward (1:8) trade scenario.
Note – if you liked this analysis, please boost the idea so that other can also get benefit of it. Also follow me for notification for incoming ideas.
Also Feel free to comment if you have any input to share.
Disclaimer – This analysis is just for education purpose not any trading suggestion. Please take the trade at your own risk and with the discussion with your financial advisor.

BTC/USD – FVG Buy Zone Setup Targeting $113K🔎 Chart Overview (BTC/USD 30m)
Price is currently trading at $110,517.
EMA 70 (111,276) above price → short-term bearish.
EMA 200 (110,598) acting as immediate support zone.
📐 Trend & Channel Strategy
Market is moving inside an ascending channel (support & projection line).
Price recently retraced to the support line → potential bullish continuation.
🎯 Supply & Demand / FVG Strategy
FVG Buying Zone: $109,583 – $110,217 highlighted (strong demand zone).
Entry around this zone expected to trigger a bullish reaction.
📊 EMA Crossover Strategy
EMA70 > EMA200 previously → bullish structure.
Current retest of EMA200 is key → holding above signals continuation to upside.
💎 Price Action Strategy
After strong drop, price tapped into support + FVG zone.
Wick rejection suggests buyers stepping in.
🎯 Target & Risk Management
Target Point: $113,053 – $113,064.
Stop Loss: Below $109,583 (to protect against breakdown).
Risk/Reward ratio looks favorable (approx. 1:3).
✅ Conclusion:
BTC is in an uptrend channel. After retesting the FVG buying zone & EMA200, buyers are likely to push price back toward $113,000 target 🚀📈. A break below $109,583 would invalidate this bullish setup.

Bitcoin Bybit chart analysis August 28Hello
It's a Bitcoin Guide.
If you "follow"
You can receive real-time movement paths and comment notifications on major sections.
If my analysis was helpful,
Please click the booster button at the bottom.
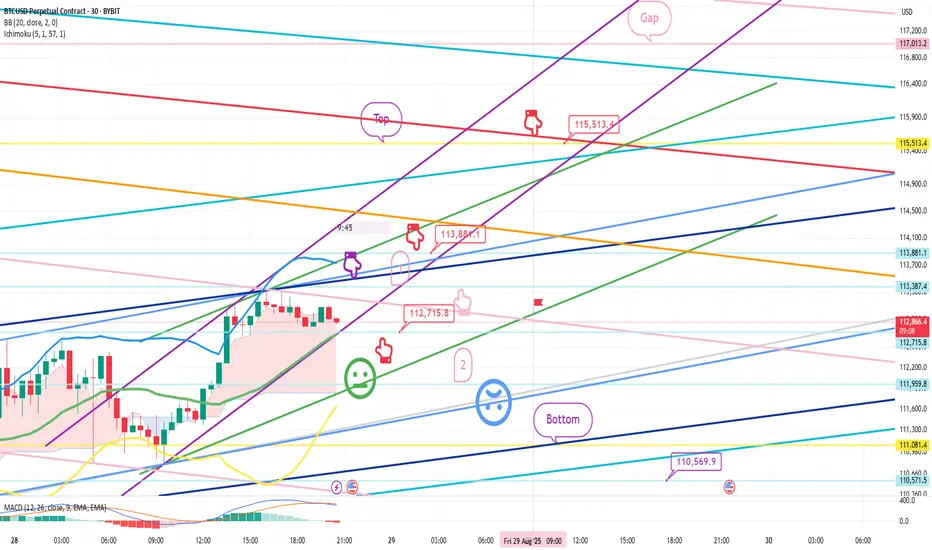
This is a 30-minute Bitcoin chart.
Although not visible on the screen,
I've used the same strategy as the long position entry point two days ago, at $109,950.4.
*If the red finger moves,
this is a conditional long position strategy.
1. After touching the first section at the top, the red finger indicates a long position entry point of $112,715.8. Stop-loss price if the green support line is broken.
(Since the purple finger touches the market, it's likely to immediately connect with an uptrend, so it's best not to open a short position. Check for an upward wave. Also, it's important to check whether the purple support line is broken first.)
2. Long position: $113,881.1. 1st target -> Top. 2nd target -> Target price up to the final gap.
If the price falls immediately without touching the purple finger at the top, hold for the final long position at section 2. Stop-loss price if the light blue support line is broken. Since the light blue support line is a mid-term uptrend line,
it's crucial for long positions not to break out today.
Below that, the bottom is open to $110.5K.
Up to this point, I ask that you use my analysis for reference only.
I hope you operate safely, with a focus on principled trading and stop-loss orders.
Thank you.
Btc long 1H TimeframeKey Observations:
1. Chart Type & Indicators:
• Timeframe: 1 Hour (1H)
• Indicators: EMA 9 (yellow), EMA 20 (blue) for short-term trend tracking.
2. Price Action:
• Current Price: 109,260 USDT
• Recently bounced sharply after a strong dip, showing bullish recovery.
3. Pattern:
• There’s a visible ascending triangle (orange lines), which usually indicates bullish continuation if price breaks upward.
• Price has broken out of the small ascending trendline with momentum.
4. Trade Setup (Long):
• Entry Zone: Around 109,260 USDT
• Target (TP):
• First resistance near 111,998 USDT
• Next major resistance around 113,217–113,431 USDT
• Stop Loss (SL): Around 107,200–107,386 USDT
5. Volume:
• Noticeable increase in buy volume at the breakout, confirming bullish pressure.
⸻
✅ Summary:
This is a long position setup based on breakout from an ascending structure. If BTC holds above the 109,000–108,500 support zone, it has potential to test 112k–113k levels. Stop loss is placed below the recent swing low (~107.2k).

Bitcoin Confirms Downtrend – Short Setup ActivatedBitcoin Confirms Downtrend – Short Setup Activated
Hello traders,
BTC is showing clear bearish momentum as it has broken below a key support level and also dropped out of the rising channel. With price now trading steadily under this zone, the downtrend is confirmed.
The strategy from here is to wait for a pullback and then enter a short. The 111k level looks like a strong entry zone, as price could retest the broken channel and form a clean Dow structure for the next leg lower.
Short setup: Entry around 111k, with a target at 105k.
Buy opportunity (short-term): Around 105k, traders can also look for a quick Long to capture a reaction move as liquidity is taken and to offset any trapped sell positions.
The primary view in the medium term remains bearish.
This is my outlook on BTC for the sessions ahead. Take it as reference and adjust your trading plan to fit your own strategy.

High risk and reward buying opportunity in BTCBTC selling has gone slow and showing indication or reversal at both HTF H4 and LTF 15m. The may generate a good high risk and reward scenario.
Below are variables support it.
1. Almost a day long consolidation is going on. And BTC is moving in very small range at 4H support level.
2. 4H candles have made few rejection candles.
3. 15m trend line created a green box (fake out) scenario.
4. Price may hit 15m FVG or swing low just below FVG and more upside.
5. RSI has already developed divergence in 15m.
6. We may have another opportunity once price breaks next resistance and pulls back to breakout levels.
P.S. – This is just analysis not any recommendation for trade. Feel to comment and raise your query.

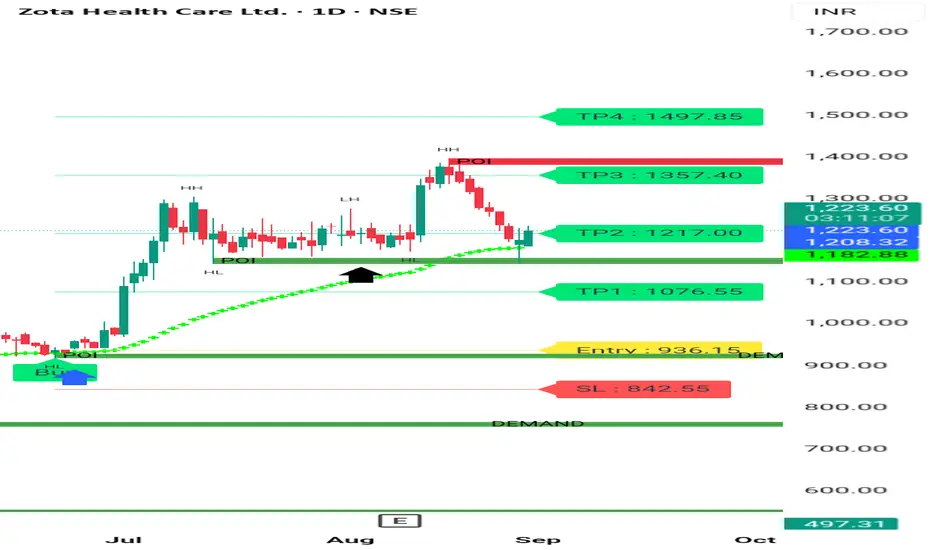
ZOTA HEALTHCARE BULLISH CHART Zota healthcare is good Growth company. It's a good buy at cmp for swing trading of 5%-6% profit. It's taking Reversal after Retracement. U can look into this. Thanks .
Consult your financial advisor before making any position in stock market.
Bitcoin – Where Could the Short-Term Trend Go?Bitcoin – Where Could the Short-Term Trend Go?
Hello traders,
BTC is currently consolidating strongly around the rising trendline on the D1 timeframe. Price has shown a strong rejection at this level. The overall market structure is still moving in line with the scenario I shared earlier, but I want to update a short-term plan to help optimise trading opportunities.
The upward channel remains key. During this sideways phase, BTC has created a small support–resistance zone, which now acts as a key level to determine the short-term trend and guide entries.
Resistance at 113.3k: A breakout above this level would confirm a Long signal.
Support at 108.8k: A breakdown here would activate a Short signal.
If support is broken, the medium-term outlook shifts towards the bearish scenario I mentioned earlier, with potential downside towards the 9x region. This is supported by the larger timeframe structure, which provides enough basis for that expectation.
This is my current short-term trading plan for BTC. Use it as reference, and share your perspective in the comments so we can learn together.
BTC - 29th Aug - collect more qty on every dipswe have monthly expiry and max pain at the top around 117K not sure exactly as it keeps changing some times. I expect any of the mentioned support levels to hold since it went up with demand followed by good data from US and positive equity... long BTC with required enough enough margins so no one can liquidate even during sleeping... weak hands loose btc to whales during dips... collect btc qty on dips... take care, cant predict the exact support levels big players thinking .... But every big players buy every dip when good volume seen for sure
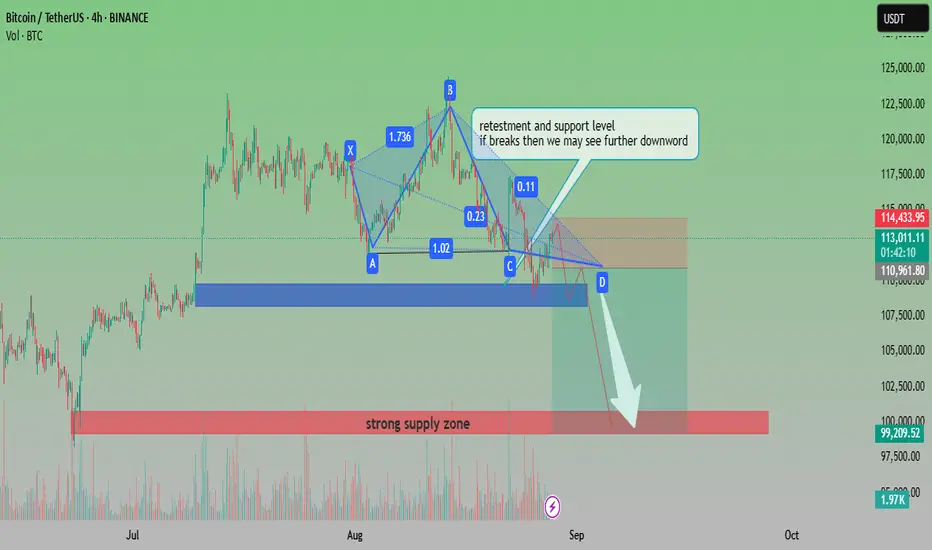
BTCUSDT Bearish Pattern with Key Support RetestAnalysis:
The chart shows Bitcoin (BTCUSDT) forming a harmonic pattern that signals potential bearish continuation. Price is currently retesting a critical support and resistance level around the 113,000–114,000 zone. If this level fails to hold, further downside movement is expected.
Pattern Formation: The harmonic structure (XABCD) suggests a bearish setup.
Support Zone: Around 110,900–111,000, a crucial level to watch.
Downside Target: If support breaks, the price could move toward the 99,000–100,000 strong supply zone.
Volume: A noticeable volume build-up supports potential continuation to the downside.
📉 Outlook: Bearish bias. A breakdown from current retest levels may accelerate selling pressure toward the 100k psychological zone.
BTC/USD Supply Zone Rejection SetupThis BTC/USD 30-min chart shows price climbing within a rising channel toward a POI Supply Zone (114,201 – 114,940 USD). The market is respecting both the support line and rejection line while trading above the EMA 70 (111,733) and EMA 200 (112,102), indicating bullish momentum in the short term.
Key Analysis Using Strategies:
Trend/EMA Strategy: Price is above both EMAs, signaling bullish continuation until the supply zone.
Channel Strategy: Price is moving inside an ascending channel; upper channel resistance aligns with the supply zone, suggesting potential reversal.
Supply & Demand: Strong supply zone at 114,201–114,940 is the key resistance area to watch for rejection.
Price Action: After breakout from EMA and minor consolidation, price shows bullish structure with higher highs and lows.
Risk Management: Possible short entry at supply zone (114,201–114,940) with stop-loss above 114,940, and targets near 112,100 and 109,000.
📌 Summary: Short-term bullish toward supply zone, but a potential bearish reversal setup forms at 114,201–114,940 if rejection occurs, with downside targets around 112,100 → 109,000.

Bitcoin Bear OutlookHas the Bitcoin bull run ended? From my outlook, I see a strong push to the downside, followed by a potential retracement back up that could form a head-and-shoulders pattern, adding more confluence to my bearish view.

Reversal trade in BTCBTC seems taking reversal on 4H chart after creating a W pattern, breaking it, pull back and move in the direction.
it may high RnR trade.
P.S. - this is just a technical analysis not a trade advice.

BTC 1H Long1. Current Price
BTC is trading around 110,879 USDT at the time of the chart.
2. Trendline
• An ascending trendline is drawn from the recent bottom, showing short-term bullish momentum.
• Price is testing support at this trendline.
3. Entry Zone
• Marked slightly above 110,500 USDT.
• Idea: enter long position as price holds above support & trendline.
4. DCA (Dollar-Cost Average) Zone
• Around 109,383.5 USDT.
• If price dips here, it’s a secondary buy zone to improve average entry.
5. Stop Loss (Invalidation)
• “1H Closing Below” ~108,534 USDT.
• If BTC closes below this level on 1H, the long setup is invalid.
6. Targets
• TP1 (Take Profit 1): 114,658 USDT
• TP2 (Take Profit 2): 115,980 USDT
• These are resistance levels where partial or full profits can be booked.
7. Risk-Reward Setup
• Entry around 110,500 → Stop below 108,534 → TP1 at 114,658, TP2 at 115,980.
• This gives a good Risk-to-Reward (RRR > 2) if the setup plays out.
8. EMA Levels
• Multiple EMAs (20/50/100/200) are shown.
• Price is still trading below the EMAs, meaning trend is bearish overall, but this setup is a counter-trend long scalp.
⸻
📌 Summary
• Bullish Scenario: If BTC holds above the entry and trendline, it can push toward 114,658 (TP1) and 115,980 (TP2).
• Bearish Scenario: If BTC breaks below 108,534 on 1H close, the long setup fails, and price may revisit lower supports.

BTCUSD Weekly – Supply Pressure vs Key Support (110K in Focus)On the weekly timeframe, BTC is trapped between major supply (117K–119K) and key support (110K–112K).
Supply Zone: Price has faced multiple rejections near 117K–119K, showing strong seller presence.
Order Block/Resistance: The yellow zone around 113K is acting as an active selling area, preventing BTC from reclaiming higher ground.
Support Zone: BTC is currently testing the 110K–112K support zone. If this level holds, we could see another attempt to reclaim 113K.
Scenarios:
1. Bullish Breakout (less likely unless strong volume appears):
Needs to reclaim 113K and break above 119K.
Target zone → 126K–134K.
Stop loss for longs → below 110K.
2. Bearish Breakdown (higher probability if 110K fails):
If 111K–110K zone breaks, BTC likely retests the 103K–106K demand zone.
If that fails → extended move possible toward 97K.
Stop loss for shorts → above 113.5K.
Bias: Neutral to Bearish unless BTC reclaims 113K with strong volume.

Bitcoin – Long-Term View with Elliott Wave StructureBitcoin – Long-Term View with Elliott Wave Structure
Hello traders,
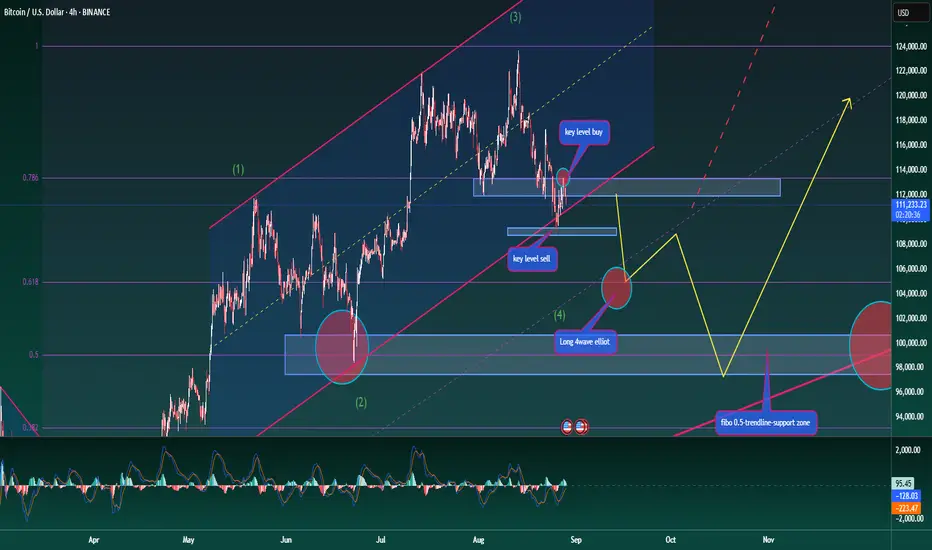
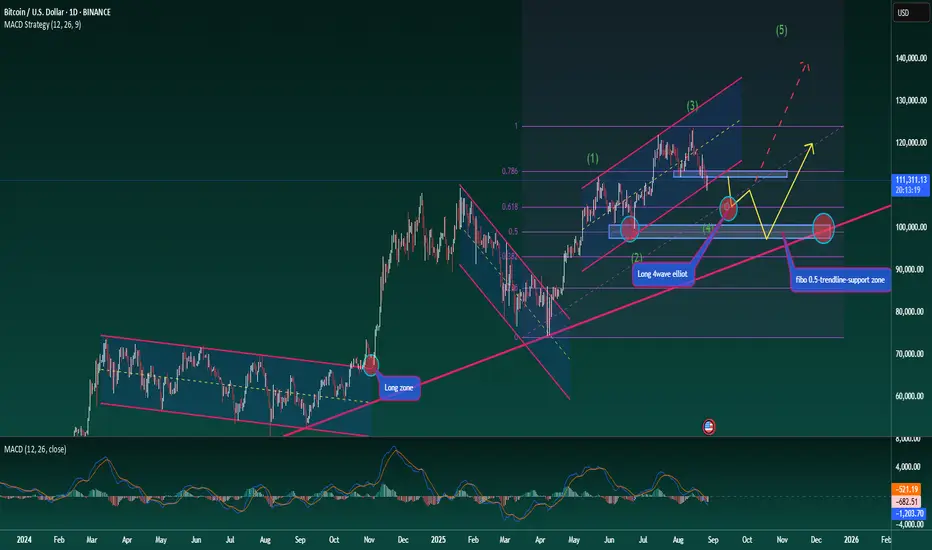
Let’s take a medium- to long-term look at BTC. The broader trend is clearly bullish, but for any uptrend to be sustainable, healthy corrections are necessary. At present, BTC is moving through a corrective phase, identified as wave 4 in the Elliott Wave structure.
To gauge how far this correction may extend before wave 5 begins, we can apply Fibonacci Retracement. Two key levels stand out: 0.618 and 0.5.
At 0.618, we see a strong support zone, but it may not yet be the decisive level for confirming the wave count. If BTC reacts positively here and rallies into wave 5, the Elliott structure remains clean and valid.
At 0.5, the level aligns with an ideal Fibonacci retracement ratio and also shows up as an important structural support on the chart. A break below this could trigger deeper downside, as highlighted by the ascending trendline.
Long-Term Trading Plan
Entry 1: Around Fibonacci 0.618 at 105k
Entry 2: Around Fibonacci 0.5 at 99k
This outlook fits a medium-term plan, but if the second zone (99k) provides a strong reaction, it could also become the base for a longer-term bullish structure.
Stay disciplined, monitor these levels closely, and trade with proper risk management.
What’s your view on BTC’s long-term structure? Share your thoughts in the comments.
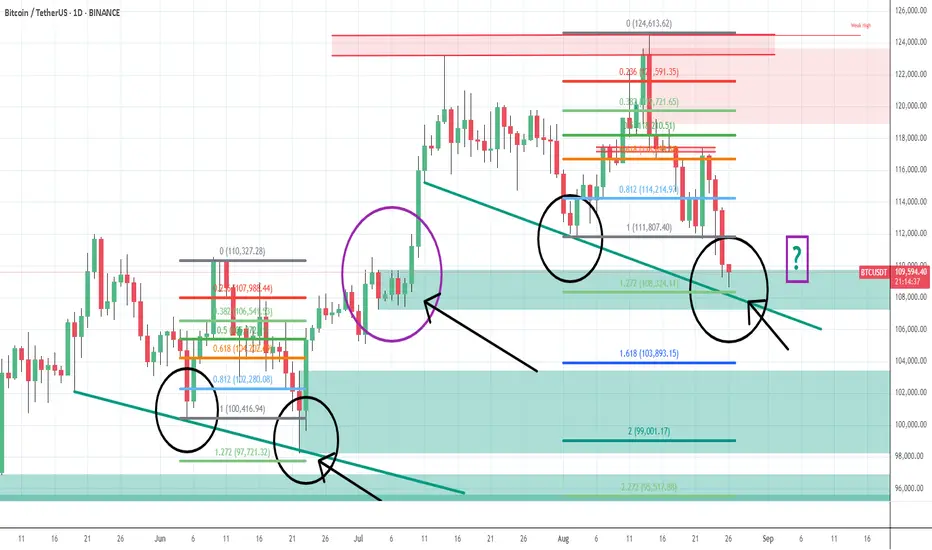
BTC - will bounce and move up only from today low - 26th AugBTC price has reached a crucial technical area from where price will most likely bounce and move up only and wont fall further much. explained in chart with fib levels and what happened in history
Bitcoin / USD – 15m Short Sell In this setup, I’m tracking BTC price action using the Fear Index (21) and Trend Shift Histogram (14) as confluence indicators for potential entries.
🔻 Key Observations:
The Fear Index showed a strong spike before the sharp sell-off, indicating growing selling pressure.
The Trend Shift Histogram gave multiple bearish signals (highlighted with arrows), aligning with the price rejection and downward continuation.
After the heavy drop, BTC attempted a recovery but faced resistance within the marked zone, forming a bearish retest.
📌 Trade Setup:
Short entry taken on confirmation of bearish trend shift.
Stop loss placed above the rejection zone.
Target aligned with the momentum continuation shown by the histogram and fear index.
⚡️ Conclusion:
This setup highlights how combining sentiment-based indicators (Fear Index) with momentum confirmation (Trend Shift Histogram) can help anticipate strong market moves. Always manage risk carefully, as volatility in lower timeframes can be sharp.

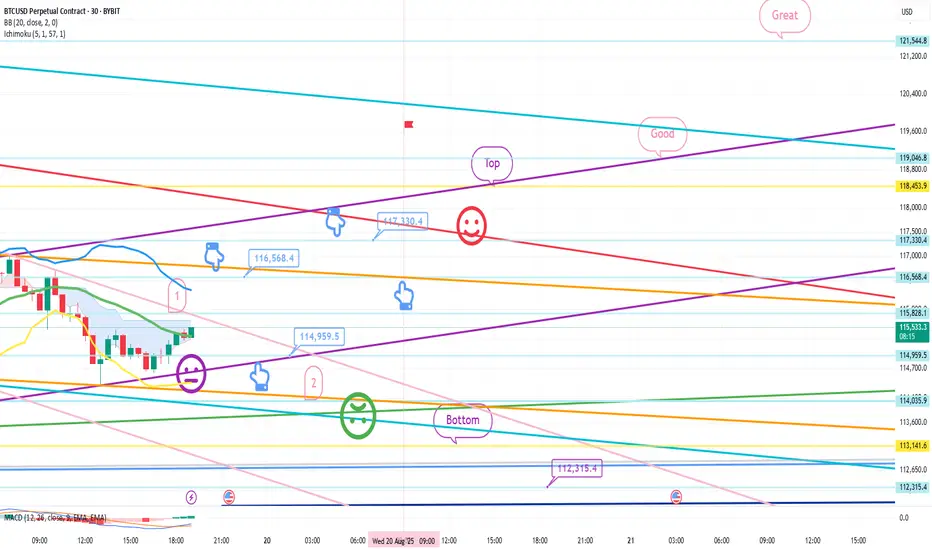
Bitcoin Bybit chart analysis August 22Hello
It's a Bitcoin Guide.
If you "follow"
You can receive real-time movement paths and comment notifications on major sections.
If my analysis was helpful,
Please click the booster button at the bottom.
This is the Nasdaq 30-minute chart.
There are no separate indicators released.
Roughly speaking,
the strategy is to switch from short to long at the light blue finger, or to wait long at the bottom.
The bottom is today's major support line and the 6+12 pattern recovery point.
If the price moves along the light blue finger path,
there's a possibility that it will eventually fall to touch the 6+12 level again.
Please note this.
I applied this directly to Bitcoin.
This is a 30-minute Bitcoin chart.
The Nasdaq is moving sideways in a downward trend,
while Bitcoin has continued its vertical decline after hitting a new high.
*If the blue finger moves along the path,
switch from short to long. Or, if it immediately declines, wait long in the second section.
This is a two-way neutral strategy.
1. $116,568.4 short position entry point / Stop loss price if the orange resistance line is broken.
2. $114,959.5 long position switch / Stop loss price if the purple support line is broken.
3. $117,330.4 long position first target / 116.5K long position re-entry point.
After this, long position target prices are listed in order of Top, Good, and Great.
The first point above is the best short position entry point for today.
If the price declines around the first touch, hold long at the second point.
Stop loss price if the green support line is broken.
In the case of Bitcoin, the candlestick is breaking out of the 12+ daily pattern,
and the downside is open.
If the bottom point is maintained, the mid-term uptrend will be broken.
-> If the bottom point is broken out, the mid-term uptrend will be broken. A medium-term downtrend may be forming.
(MACD dead cross on weekly chart)
If the Nasdaq only moves sideways, that's good,
but if it declines, BTC could fall even more sharply.
Due to low participation, I decided to take a break this week,
but I've had some free time, so I'm sharing this with everyone for the first time in a while.
Please use my analysis for reference only.
I hope you operate safely, with a focus on principled trading and stop-loss orders.
Thank you.
BTC/USD Bearish Retest Setup – Eye on 106.6K TargetTrend: BTC is in a downtrend channel (rejection line above, support line below).
EMA Signals: Price is trading below EMA 70 & EMA 200 → bearish bias remains strong.
Supply & Demand:
Support zone: around 112,000 – 112,500 (price just bounced).
RBR Supply zone: 114,300 – 116,000 where sellers are likely waiting.
📊 Strategies in play
Support–Resistance: Bounce at support, retest expected at supply zone.
EMA Strategy: Bearish since candles trade under 200 EMA.
Break & Retest: Price could retest supply before resuming drop.
Target Projection: If rejection at supply holds, target = 106,600 zone (chart target point).
⚖️ Risks
A clean break above 116,000 would invalidate bearish setup and open room for reversal.
Range trading possible between 112k–116k before breakout.
✅ Summary: BTC short-term bias remains bearish. Expect retest of 114.3k–116k supply before continuation lower toward 106.6k target. Only a strong breakout above 116k flips the trend bullish.
