IIFL SECURITIES - PREVIOUS ALL TIME HIGH BREAKOUTIIFLSEC
1) Time Frame - Monthly.
2) ALL TIME HIGH breakout in monthly.
3) Primary trend will act as a resistance / profit booking zone in the long term at (Price 204).
4) Recommendation - Strong buy
1-BUY

PAKKA / PAKKA LIMITED - All Time high - BreakoutPAKKA
1) Time Frame - Weekly.
2) Stock has given a breakout with huge volume & strong bullish candle close in weekly.
3) The next target would be around the price (460 - 19%) from the current price 385.45.
4) Recommendation - Strong Buy

HFCL LTD - Triangle Breakout in MonthlyHFCL LTD
1) Time Frame - Monthly.
2) Downtrend / Triangle Breakout in Monthly with good volume.
3) Next Resistance / Target would be (Price 101.35) - Previous all time high.
4) Recommendation - Strong buy

MANAKSKIA STEELS LTD - Triangle Pattern & Previous ATH BreakoutMANAKSTEEL
1) Time Frame - Weekly.
2) Previous Life Time High was 64. It has been consolidating in a triangle pattern since 2022 & given a breakout in weekly time frame currently.
3) It's a Triangle pattern & All Time High breakout with strong bullish candle & Good volume.
4) Stock will find its next resistance around the price 80 (17%).
5) Recommendation - Strong Buy

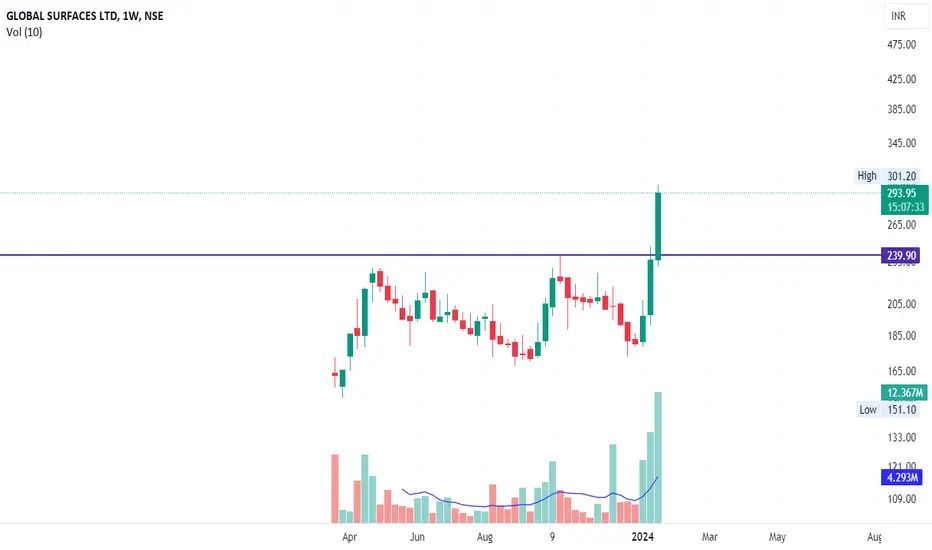
GSLSU / Global Surfaces Ltd - Consolidation / IPO Base BreakoutGSLSU
1) Time Frame - Weekly.
2) Previous Life Time High was 239.30. It has been consolidating since 2023, March & given a breakout in weekly time frame currently.
3) It's a consolidation / IPO base breakout with strong bullish candle & Good volume.
4) Recommendation - Strong Buy
HPAL / HP ADHESIVES LTD - 1 Yr Consolidation / IPO base breakoutHPAL
1) Time Frame - Weekly.
2) Previous Life Time High was 109.30. It has been consolidationg since 2022 January & given a breakout in weekly time frame currently.
3) It's a consolidation / IPO base breakout with strong bullish candle & Good volume.
4) Recommendation - Strong Buy

CESC - All Time High BreakoutCESC
1) Time Frame - Monthly.
2) Previous ALL TIME HIGH breakout in monthly with good volume.
3) Stock will find an Immediate resistance around the price 142.80 / Retrace and breakout further in the upcoming days.
4) Recommendation - Quite risky but still it is a Good buy.

Indian Bank Stock Analysis: Spordiac Buy Signal on short term📈 NSE:INDIANB - January 5, 2024, 12:52 PM
Current Trading Price: ₹435.10 🏷️
Opening & Key Levels:
Today's Opening: ₹432.40 (Above 0.618 Fibonacci Level) ✅
Near 50-Day Moving Average: Indicating Bullish Trend 📊
Technical Indicators:
EMA & MA: No crossover yet 🔄
MACD: Histogram at 0.48, MACD at 0.70, Signal at 0.22 (Positive Crossover) 📈
RSI: Currently at mid-range, K at 55.02, D at 37.62 (Viable Range) 🎯
%R: At -29.83 (Supportive of Bullish Trend) ⬆️
Fisher Indicator: Positive crossover, Fisher at 0.80, Trigger at 0.27 (Mid-Range) ✨
Parabolic SAR: Buy signal at ₹391.00 🟢
Target Prices & Stop Loss:
Target 1: ₹443.65 (0.786 Fibonacci Level) 🎯
Target 2: ₹458.00 (Level 1 of February Series) 🎯
Stop Loss: If falls below ₹424.50 (0.5 Fibonacci Level) ⛔️
Overall Outlook: Bullish in the short term, but confirmation needed from other indicators. Volatility noted. Investors are advised to monitor closely.
Disclaimer: This analysis is for informational purposes only and should not be construed as investment advice. Investment decisions should be based on individual research and risk appetite. 🚫
#IndianBank #StockAnalysis #TechnicalAnalysis #Investing #StockMarket #BullishTrend #TradingTargets #RiskManagement

KTKBANK / KARNATAKA BANK - Previous All Time High BreakoutKTKBANK
1) Time Frame - Weekly.
2) Previous Life Time High was 194.60 in the year 2008. It was broken on July 2023 & Sustained / Consolidated for 6 months above the price 194.60 and marked a breakout with strong bullish candle and closed at All Time High currently.
3) The next resistance would be in between the price 300 to 314.
4) Recommendation - Strong Buy

RELIANCEWait And Watch ??
Look for Low risk, High reward, and High Probability setups-
Things to Remember while Trading with the Trend
1. Know what the trend is.
2. The best trades are made in the direction of the trend.
3. Assume that the main trendline or moving average will hold.
4. The longer the moving average is, the better it defines the trend.
5. Wait for the pullback.
6. Don’t chase the market.
7. Don’t fight the market.
8. Even in the strongest trends there should be some retracement.
9. The closer the market is to the trendline, the better the risk/reward ratio is.
10. Use ADX to determine the strength of the trend.
11. Higher the level of ADX , the stronger the trend, below 20 consider the market to be choppy
12. Hold trades longer in a strong trend.
13. Wait for confirmation of a trendline breaking before reversing position.
14. Know where the Support levels are.
15. Place stops outside the Support levels.
Thank You..

SULA / Sula Vineyards Ltd - 5 months consolidation breakout ATHSULA / Sula Vineyards Ltd - 5 months consolidation breakout | All Time High
1) Time Frame - Weekly.
2) 5 months of consolidation / previous All Time High broken in weekly time frame with huge volume.
3) Since the stock is moving in an uptrend channel it will find its resistance around the price (626.45 - 13% from today's close).
4) Recommendation - Strong Buy

EMS limited showing good strength on weekly chartsEMS limited- A recently listed Electronics manufacturing company is showing strength on weekly charts. After retracing from recent highs the price bounced from fibbonacci 23.6% levels and is looking prime to touch recent highs. A buy above 500 with stop of 420.

Coastal Corp- A good breakout on weekly ChartsWe see a positive price action in charts of Coastal Corporation with price closing above a recent resistance level. After an eventual consolidation at this range the stock can rise to next resistance level. Looks good to buy at current levels.

5PAISA / 5PAISA CAPITAL LTD - Previous All Time High Breakout1) Time Frame - Weekly.
2) Previous All Time High was 580 in the year 2021 July. It has been broken out and closed with strong bullish candle & volume in Weekly.
3) As the primary trend (Black line) acts as a resistance since all these years the stock will find its resistance there (around the price - 935).
4) Recommendation - Strong Buy

HPL / HPL Electric & Power Ltd - 5 Months tight consolidation brHPL
1) Time Frame - Monthly. Kindly change the time frame to weekly for better understanding.
2) After consolidating at its IPO base level / Previous All Time High for 5 months the stock has broken out and closed with strong bullish candle & volume.
3) As It is a cup pattern breakout the target as per the cup pattern would come around the price (1860) in the long term.
4) Recommendation - Strong Buy

TREL / TransIndia Real Estate Ltd - 4 Months Consolidation Break1) Time Frame - Weekly.
2) 4 Months consolidation breakout in weekly with huge bullish candle and volume.
3) Since the stock moves in an uptrend channel it will find its resistance around the price (67).
4) Recommendation - Strong Buy

GLAXO / Glaxosmithkline Pharmaceuticals Ltd - 13 Years ConsolidaGLAXO
1) Time Frame - Monthly. Kindly change the time frame to weekly for better understanding.
2) 13 Years of consolidation (Since 2010) broken & Closed strong in WEEKLY time frame.
3) Stock will find its strong resistance / profit booking zone at the primary trendline in the long term.
4) Recommendation - Strong Buy

INOX WIND LTDINOXWIND
1) Time Frame - Monthly.
2) IPO Base ALL TIME HIGH MULTI YEAR breakout in monthly with good volume.
3) It is a Cup Pattern breakout. So, As per the cup pattern target It would be around (972) in the long term.
4) Recommendation - Strong buy

SHRIRAMPPS - IPO base BreakoutSHRIRAMPPS
1) Time Frame - Monthly.
2) Break of Previous firstly marked All Time High in monthly with good volume.
3) It's a good confirmation to go for buy as per monthly time frame but In Weekly time frame, Should wait for the strong close above 129.70 in daily / weekly candle.
4) Weekly / Daily - Any Time frame's candle close above 129.70 is considered as buy opportunity. (with good volume).

AFFLE INDIA LTD - Pattern BreakoutAFFLE INDIA LTD
1) Time Frame - Monthly.
2) Downtrend strong triangle pattern breakout.
3) Next target would be Previous All Time High - 1511.
4) Recommendation - Strong Buy

FEDERALBNK | NSE | INDIA | ANALYSISFEDERAL BANK has following advantage to BUY:
1. Gave break-out for the 4 year trendline.
2. The Break-Out was with good momentum.
3. The Break-Out took a retest for the conformation.
4. RSI gave a breakout for the recent forming trendline.
Advantage: Our Big Bull Rakesh Jhunjhunwala is holding this stock and he increased stake in this recently.
Disclaimer
- The view expressed here is my personal view
- Past performance is not a guarantee for future predictions
- Use this for educational purpose
- Any decision you take, you need to take responsibility for the same
- It's your hard earned money. Treat it wisely
- Trade / Invest keeping in mind your trading style, goals and objectives, time horizon & risk tolerance
- if trading in F&O, understand that F&O trading involves risk
- Do take proper risk management measures
- Do your own analysis and consult your financial adviser if need be


Gold possible upside momentgold hase broke 30 minutes resistance and retested. one can enter for 80-100 pips moments upsede. USD is seen week. one can target upto 2030
