AWHCL: Signs of Trend ReversalThe stock of AWHCL has shown signs of recovery after a prolonged downtrend that began in September. Recent price action suggests a potential shift in momentum, supported by multiple technical factors across daily and weekly timeframes.
The stock has bounced from a long-term support level marked on the chart. The recent retracement from the swing high and higher low aligns with the 61.8% Fibonacci level, a zone often considered significant for trend continuation, indicating strong bullish momentum.
A bullish MACD crossover occurred on the daily chart last week, and notably, a weekly MACD crossover has been confirmed today. This dual timeframe alignment strengthens the bullish outlook.
The RSI readings support the bullish scenario, reflecting improving momentum without entering extreme overbought territory.
On the daily chart, the stock has managed to close above the 200DEMA, a key indicator of long-term trend strength which also seen by volume growth.
Key Levels to Monitor:
Support Zone: Around ₹417 (critical level for trend validation)
Resistance Zone: Near ₹632, which coincides with the 1.618 Fibonacci extension level, often viewed as a potential target in bullish setups.
Disclaimer: This analysis is intended for educational and informational purposes only. It does not constitute investment advice or a recommendation to buy, sell, or hold any financial instrument. Market participants should conduct independent research and consult a licensed financial advisor before making any investment decisions.
2025

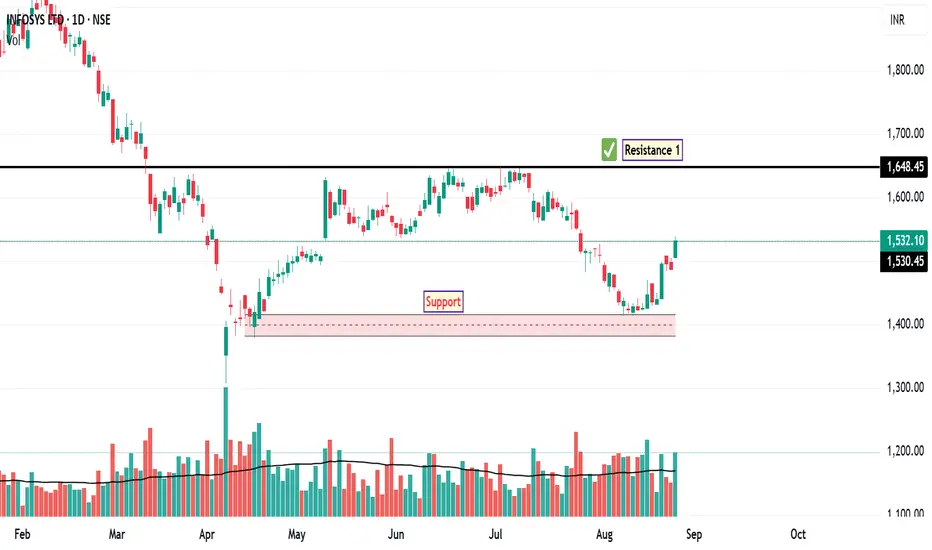
INFY: Swing SetupAfter experiencing a sustained downtrend since February 2025, Infosys has recently shown signs of a potential reversal on the daily chart. The stock has managed to close above its 50-day EMA, indicating a shift in short-term momentum and suggesting that buyers are beginning to regain control.
The RSI is currently hovering near the 60 level, which reflects improving bullish sentiment without yet entering overbought territory. This positioning often precedes further upside if supported by volume and price action.
Additionally, today's price action saw Infosys touch the upper Bollinger Band, a technical signal that often precedes a short-term pullback or consolidation. However, it can also indicate strong momentum if the price continues to ride the band. This move suggests a potential retest of the recent swing high near ₹1480 .
From a structural standpoint, the next key resistance level is identified at ₹1648 , which aligns with previous supply zones and Fibonacci retracement levels. On the downside, a logical stop-loss placement would be just below ₹1417 , which serves as a near-term support and a level where the bullish structure would be invalidated if breached.
Disclaimer: This analysis is for educational and informational purposes only. It does not constitute investment advice or a recommendation to buy, sell, or hold any security. Always conduct your own research or consult a licensed financial advisor before making investment decisions.
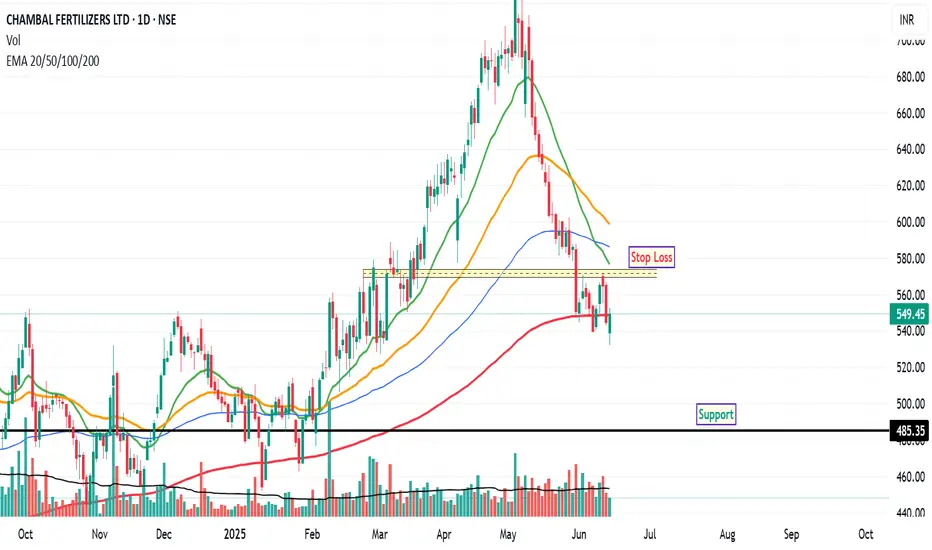
Chambal Fertilizers: Exhibits Short-Term WeaknessChambal Fertilizers has recently displayed signs of short-term weakness on its daily chart. The price action indicates a struggle to maintain a position above the 200-day EMA, a widely recognized long-term trend indicator. Despite multiple attempts to close above this crucial level, the stock has been unable to sustain any significant upward momentum, suggesting a prevailing bearish sentiment among market participants.
From a momentum perspective, both the RSI and MACD indicators are currently positioned in what is typically considered the oversold territory. This could imply that the stock has experienced a period of significant selling pressure.
Should the current trend persist, the stock may potentially retest the ₹485 level, which could act as a significant support zone. Conversely, a potential shift in market dynamics could occur if the stock manages to close and sustain above its 200-day EMA for a minimum of two consecutive trading sessions. In such a scenario, traders might consider a revised risk management strategy, with potential stop-loss levels in the range of ₹569 to ₹573 , based on recent price action and potential resistance.
Disclaimer: The information provided in this stock analysis is for informational and educational purposes only and should not be construed as financial advice. Always seek the advice of a qualified financial advisor or conduct your own thorough research before making any investment decisions.
Hatsun Agro: Poised for a Potential Breakout?Hatsun Agro is currently exhibiting a constructive technical setup within a well-defined ascending channel. The price action on July 21st, characterized by a strong bullish candle on significant volume, indicates a robust rejection of the channel's lower support trendline. The stock is now directly challenging a critical horizontal resistance zone. A decisive close above this area could validate the bullish momentum and unlock significant upside potential towards previously established highs.
Since April 2025, the stock has been trading within a clear ascending channel. This pattern is inherently bullish, indicating a structured uptrend with higher highs and higher lows. The recent bounce from the lower support trendline ( the red line ) confirms the validity and strength of this ongoing trend.
The horizontal zone, marked in green , represents the most immediate and critical hurdle. It is a "confluence zone" where horizontal price resistance (derived from the highs in February and March) intersects with the channel's internal structure. This area has acted as a ceiling, rejecting upward attempts in late May and early June. Breaking this supply zone is the key to unlocking the next leg of the rally.
The trading session on July 21st (Today) was accompanied by a substantial surge in volume. This high volume on a strong bullish candle originating from channel support is a powerful signal. It suggests strong buying conviction and provides a robust foundation for the attempt to break through the overhead resistance.
The Structural Resistance at ₹1,116.45
This is the most logical and significant primary target following a breakout. This level represents the major high from January 2025. It is a natural magnet for price and a likely area where traders who bought the breakout would look to take initial profits.
Disclaimer: The information provided in this technical analysis is for informational and educational purposes only and should not be construed as financial or investment advice. It is an interpretation of historical price data. Market dynamics can change, and past performance is not indicative of future results. All trading and investment activities involve risk. Always conduct your own thorough due diligence and consult with a qualified financial advisor before making any investment decisions.

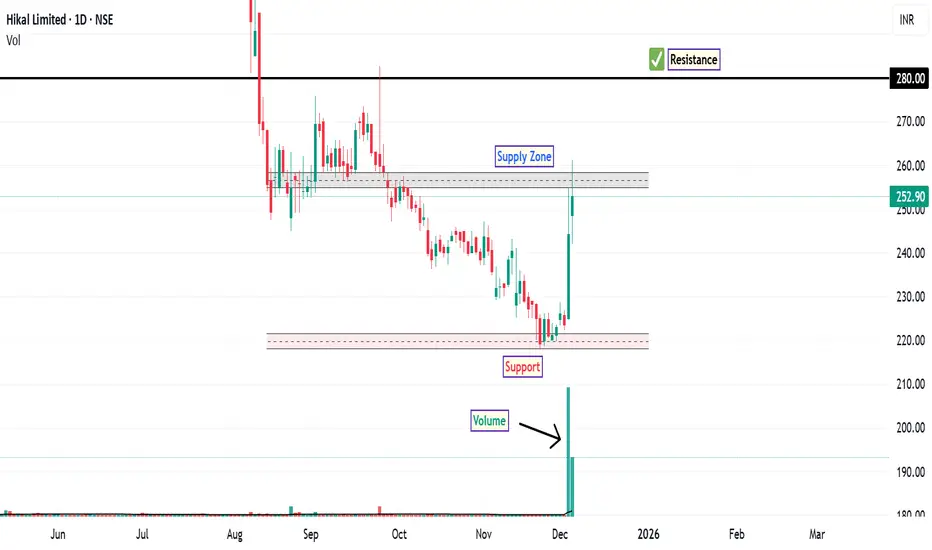
Hikal: Trend Shift and Key LevelsThe stock of Hikal Ltd . experienced a significant breakdown below its major support level of ₹331 in July, marking a continuation of its bearish phase. After testing the discount zone which is now major support zone, the stock rebounded sharply with high trading volume, signaling renewed buying interest and possible accumulation.
A CHOCH pattern has been observed, which often suggests a shift from bearish to bullish structure when confirmed by price and volume behaviour. The stock has managed to close and sustain above the 50-day EMA, a key indicator of short-term trend strength and potential continuation of the uptrend.
The RSI is currently above 65, indicating strong bullish momentum and approaching overbought territory. A MACD bullish crossover along with a positive histogram further reinforces the upward bias.
Nearest Resistance: Around ₹280 (marked supply zone where selling pressure may emerge)
Support Zone: Below ₹217 (critical level for trend validation)
Intermediate Demand Zone: Recent breakout area near the 50-DEMA
Disclaimer: This analysis is intended for educational and informational purposes only. It does not constitute investment advice or a recommendation to buy, sell, or hold any financial instrument. Traders and investors should conduct independent research and consult a licensed financial advisor before making any decisions.
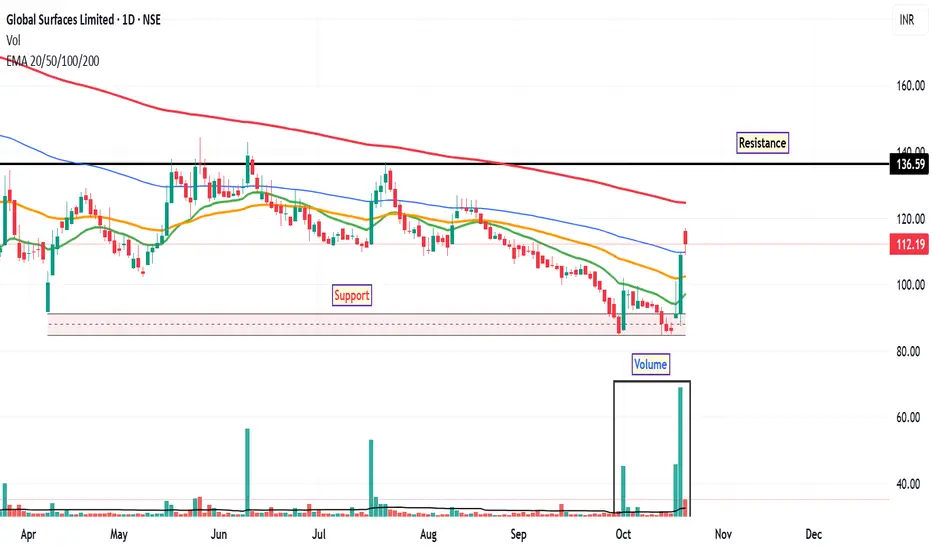
GSLSU: Trend Reversal Signals The stock of GSLSU has been in a sustained downtrend since May, revisiting its discount zone multiple times. However, recent price action suggests a possible shift in sentiment. On Friday, October 17, the daily chart printed an inverted hammer candlestick, a pattern often interpreted by technical analysts as a potential bullish reversal signal—especially when supported by volume and other indicators.
The inverted hammer on the daily timeframe may indicate buying interest at lower levels. This pattern gains significance when it appears after a prolonged downtrend and is accompanied by increased volume. The bullish signal is further supported by a rise in trading volume and a daily close above the 20-day, 50-day, and 100-day EMAs, suggesting short-term strength and potential trend reversal.
In the most recent trading session, the stock found support at the 100-day EMA and rebounded, reinforcing the validity of this level as a short-term base. The RSI has moved above 65, indicating increasing bullish momentum. This level is often seen as a sign of strengthening trend, though not yet in overbought territory.
If the stock sustains its upward movement, the next potential resistance level may be around ₹136 , based on previous price action. The discount zone near ₹84 may serve as a key support level. Traders often monitor such zones for invalidation of bullish setups or potential re-entry points.
Disclaimer: This analysis is intended for educational and informational purposes only. It does not constitute investment advice or a recommendation to buy, sell, or hold any financial instrument. Market participants should conduct their own research and consult with a licensed financial advisor before making any investment decisions.
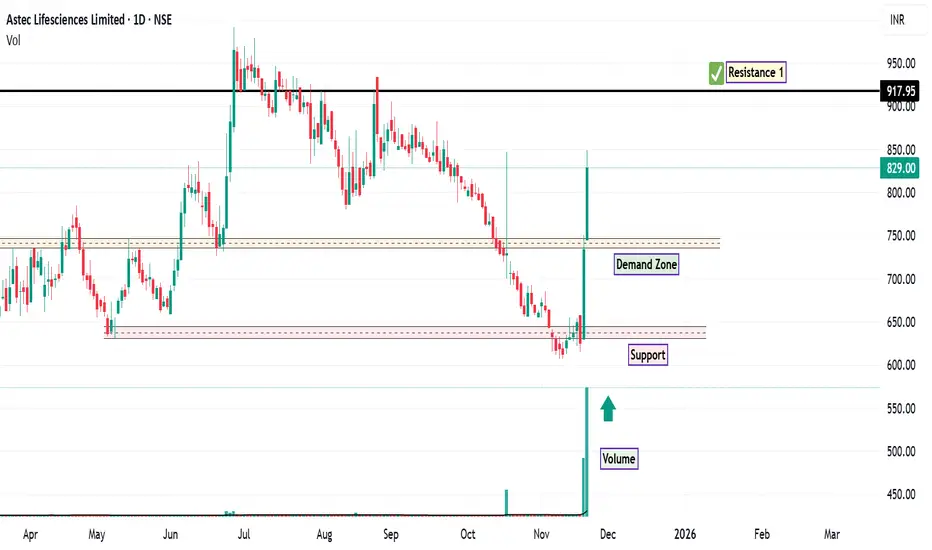
ASTEC: Momentum Surge and Key LevelsThe stock of ASTEC has shown significant strength over the last two trading sessions, recording an impressive 30% gain accompanied by strong volume. This sharp upward movement is supported by multiple technical indicators, suggesting a shift in market sentiment.
The stock has managed to close above the 200-day EMA with substantial volume. Historically, such a breakout is considered a strong bullish signal, indicating potential trend reversal or continuation.
A bullish MACD crossover has occurred on the daily timeframe, with a positive histogram reinforcing upward momentum. This alignment of indicators often signals sustained buying interest.
The RSI currently stands at 72, placing it in the overbought zone. This is notably above the 14-day average RSI of 62, suggesting that while momentum is strong, a short-term retracement could occur. Based on price structure, a retracement toward ₹745 may act as a demand zone, where buyers could re-enter if the stock consolidates.
Immediate Demand Zone: Around ₹745
Next Resistance: ₹917 (historical level based on prior price action)
Support Zone: Below the marked demand zone on the chart
Disclaimer: This analysis is intended for educational and informational purposes only. It does not constitute investment advice or a recommendation to buy, sell, or hold any financial instrument. Market participants should perform their own due diligence and consult with a licensed financial advisor before making any investment decisions.
BHEL: Long Setup OnThe stock of Bharat Heavy Electricals Limited (BHEL) recently tested a significant resistance level near ₹265 and has since begun a retracement phase. Current price action suggests a pullback toward a demand zone around ₹278 , which may act as a short-term support area.
The initial resistance at ₹265 served as a barrier to further upside, prompting the current retracement. The previous resistance level may now function as a support zone, a common occurrence when price breaks above and then retests prior resistance.
If the stock resumes its upward trajectory after consolidating near the demand zone, the next major resistance is projected around ₹321 , based on historical price action and chart structure.
The area near ₹278 is being monitored as a potential demand zone, where buying interest could emerge to support the price.
Immediate Support: ₹265
Demand Zone: Around ₹278
Next Resistance: ₹321
Disclaimer: This analysis is provided for educational and informational purposes only. It does not constitute investment advice or a recommendation to buy, sell, or hold any financial instrument. Market conditions can change rapidly; traders should conduct their own research or consult a licensed financial advisor before making any decisions.

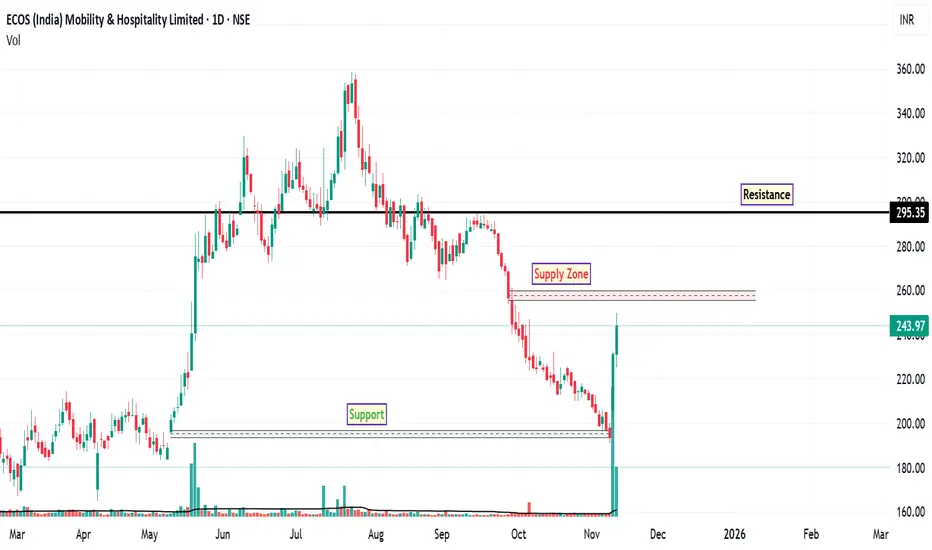
ECOSMOBLTY: Potential Reversal SignalsThe daily chart of ECOSMOBLTY indicates early signs of a possible bullish reversal following a prolonged bearish trend. Recent price action suggests renewed buying interest, supported by multiple technical factors.
The stock has rebounded from a long-term support level near ₹191 , accompanied by higher-than-average trading volume. This combination often signals increased market participation and potential trend reversal.
A bullish crossover on the MACD has been observed on the daily timeframe. This momentum-based indicator often suggests a shift from bearish to bullish sentiment when confirmed by price and volume.
The RSI has moved above 62, indicating strengthening bullish momentum. While not yet in overbought territory, this level reflects improving trend strength.
There is a notable supply zone around ₹257 , which may act as an interim resistance. Price could consolidate or retrace near this level before attempting further upward movement.
Immediate Resistance: ₹257 (potential supply zone)
Major Resistance: ₹295 (historical level based on prior price action)
Support Zone: ₹191 (long-term support and invalidation level for bullish setup)
Disclaimer: This analysis is intended for educational and informational purposes only. It does not constitute investment advice or a recommendation to buy, sell, or hold any financial instrument. Market participants should conduct independent research and consult with a licensed financial advisor before making any investment decisions.
PGEL: Suggest Momentum ShiftPG Electroplast Ltd. (PGEL) has recently shown signs of emerging strength after a prolonged phase of consolidation. Over the last two trading sessions, the stock has demonstrated upward momentum, suggesting a possible attempt to break out of its range-bound structure. This observation is supported by several technical factors:
1. Moving Averages & Volume Dynamics
The stock has successfully closed above the 20-day EMA, indicating short-term bullish sentiment.
It is currently trading near the 50-day EMA, although it has not yet closed above this level. The recent price movement has been accompanied by increased trading volume, which may reflect growing market participation.
2. Change of Character (CHOCH)
The break above the 20-day EMA, despite the price not closing above the 50-day EMA, may signal a CHOCH. This is often interpreted by technical analysts as a potential shift in trend direction, particularly from bearish to neutral or bullish.
3. RSI Momentum
The RSI has moved above the 60 level, suggesting strengthening momentum. This level is typically viewed as a transition zone between neutral and bullish conditions.
4. MACD Signal
A bullish crossover on the MACD indicator has occurred on the daily timeframe. This crossover may indicate a potential shift in momentum, especially when supported by price structure and volume.
Breakout Confirmation Level:
A sustained close above ₹597 could be interpreted as a breakout from the consolidation zone. If this level is cleared with volume support, the next potential resistance may lie near ₹712 , based on historical price action. The lower boundary of the recent consolidation zone, around ₹494 , may act as a support level. This area could be monitored for potential retests or invalidation of the breakout attempt.
Disclaimer: This analysis is intended for educational and informational purposes only. It does not constitute investment advice or a recommendation to buy, sell, or hold any financial instrument. Market participants are encouraged to conduct their own research and consult with a licensed financial advisor before making any investment decisions.

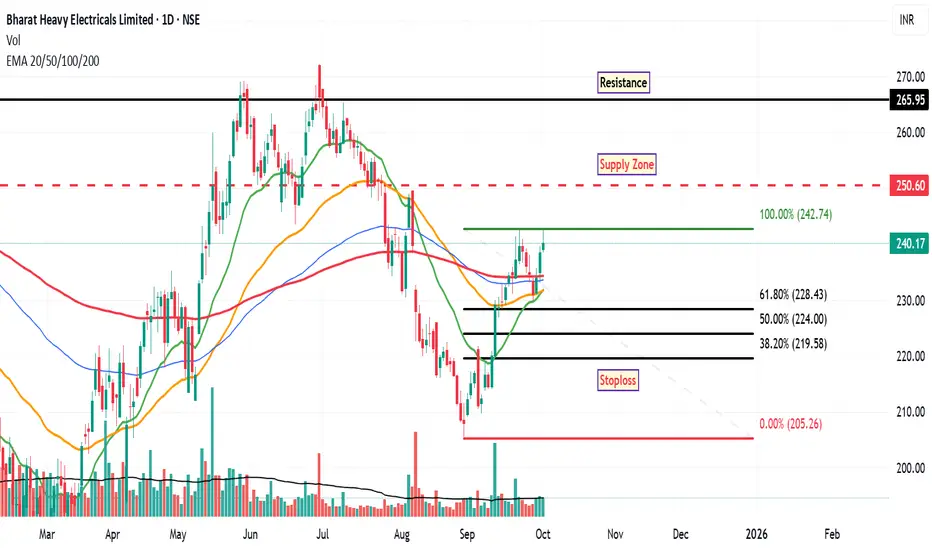
BHEL: Prospective InsightFollowing a recent retracement from a previously identified discount zone, the stock of Bharat Heavy Electricals Limited (BHEL) is exhibiting signs of potential bullish momentum. This outlook is supported by several technical indicators observed on the daily chart:
Fibonacci Retracement:
The stock has retraced to the 61.8% Fibonacci level from its recent swing high, a zone often regarded by technical analysts as a potential area of price support and reversal.
Exponential Moving Averages (EMAs):
Price action has moved above the 20-day, 50-day, 100-day, and 200-day EMAs, which may suggest strengthening bullish sentiment and a shift in medium- to long-term trend dynamics.
Golden Crossover Setup:
The shorter-term moving averages appear to be converging toward a golden crossover (typically when the 50-day EMA crosses above the 200-day EMA), a pattern that historically has been associated with bullish continuation, though confirmation is still pending.
Relative Strength Index (RSI):
The RSI has crossed above the 60 level, indicating increasing buying momentum. While not yet in overbought territory, this move may reflect growing investor interest.
Immediate Supply Zone:
Based on historical price action and volume profile, the stock may encounter resistance near the ₹250 level, with a stronger resistance band around ₹265 .
Support Zone:
Should the price face selling pressure, a potential support area lies near the 38.2% Fibonacci retracement level, approximately around ₹219 .
Disclaimer: This analysis is intended for informational and educational purposes only and does not constitute investment advice or a recommendation to buy or sell any securities. Market conditions can change rapidly, and traders should conduct their own due diligence or consult with a registered financial advisor before making any investment decisions.
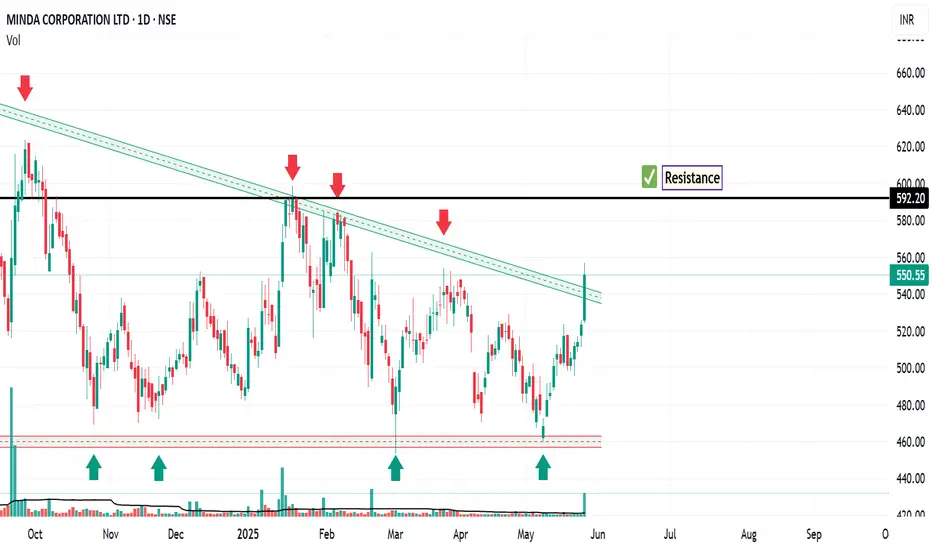
Minda Corp: Gearing Up for a BreakoutThe chart of Minda Corp provides delineates critical price thresholds that signify breakout points, along with specific support levels that serve as indicators of where buying interest may manifest.
Additionally, the chart highlights regions likely to act as ceiling points for future price ascensions, allowing for informed decisions on entry and exit strategies.
Disclaimer: The information contained in this technical analysis report is intended solely for informational and educational purposes. It should not be interpreted as financial advice or a recommendation to buy or sell any security. Investors are strongly encouraged to conduct their own research and consult with a qualified financial advisor before making any investment decisions.
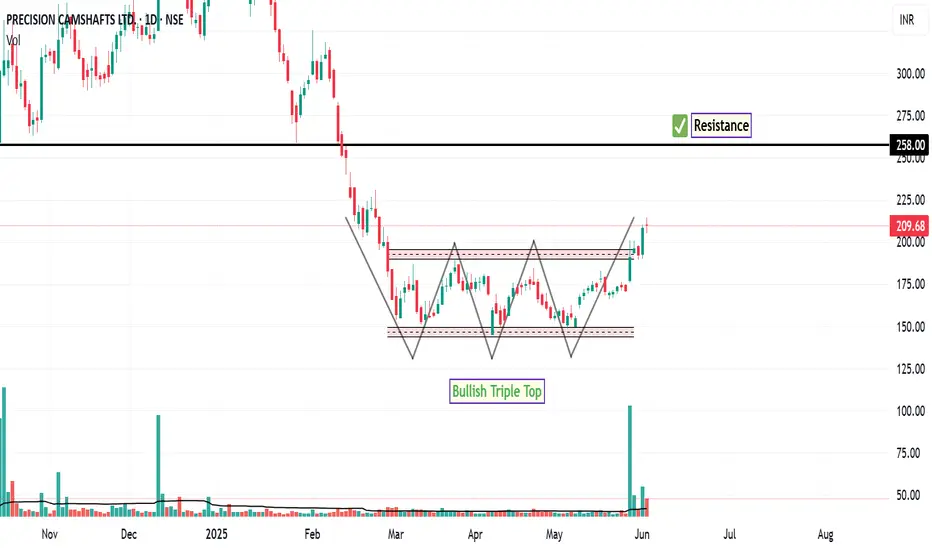
PRECAM: Next Level InsightThe daily chart of PRECAM is currently displaying a technically constructive setup. Notably, the price structure resembles a bullish triple top formation, which, in this context, appears to be acting as a continuation pattern rather than a reversal. This is further supported by a breakout above the recent consolidation range.
Importantly, this breakout has been accompanied by a noticeable increase in trading volume over the past five sessions, which may suggest growing market participation and interest in the stock at current levels.
Key technical indicators are aligned with this bullish momentum:
RSI is trading above the 70 mark , indicating strong upward momentum.
MACD is positioned above the zero line , with the signal line maintaining a positive crossover.
MACD Histogram remains in positive territory, reinforcing the prevailing bullish sentiment.
Based on this setup, the next potential area of price interest or resistance could emerge near the ₹258 level. On the downside, the immediate support lies just below the prior consolidation zone near ₹145 . A sustained move below this level could act as a technical invalidation point for short-term bullish setups and may prompt risk management actions.
Disclaimer:
This analysis is intended solely for informational and educational purposes. It does not constitute investment advice, a recommendation, or an offer to buy or sell any financial instrument. All investments carry risk, and past performance is not indicative of future results. Individuals should conduct their own due diligence or consult with a qualified financial advisor before making any investment decisions.
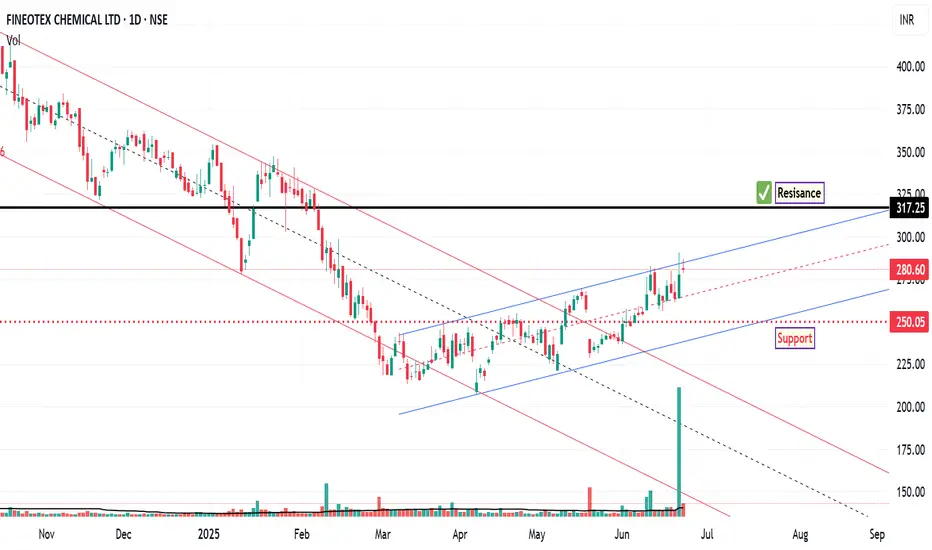
FCL: Technical Setup Signals 10% Upside Potential
The chart of FCL outlines key price levels that represent potential breakout zones, signaling shifts in market momentum. It also identifies critical support areas where buying interest may emerge, offering insight into potential entry points.
Additionally, resistance zones are clearly marked, indicating probable barriers to upward price movement. These levels are instrumental in formulating strategic entry and exit decisions based on anticipated market behaviour.
Disclaimer:
This technical analysis is provided for informational and educational purposes only. It does not constitute financial advice or a recommendation to buy or sell any security. Investors should perform their own due diligence and consult with a licensed financial advisor before making any investment decisions.
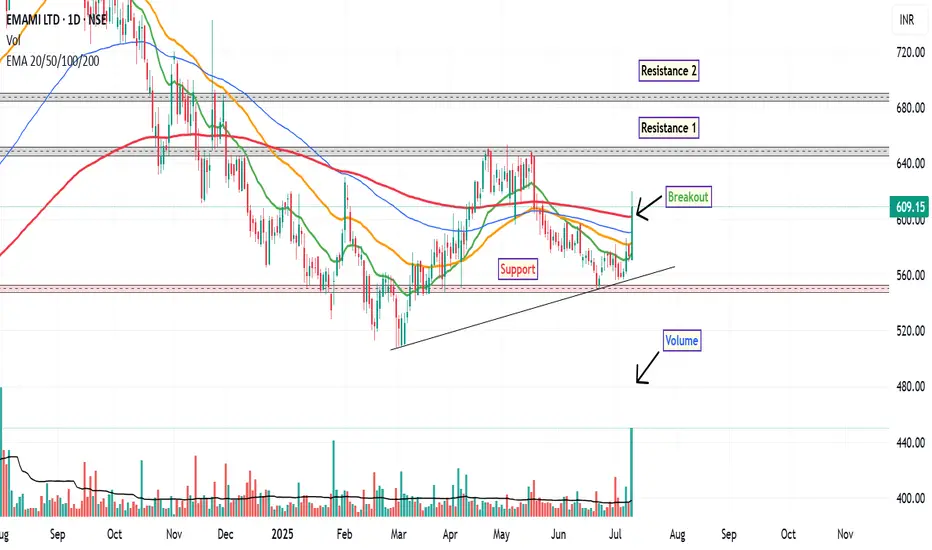
EMAMI: Technical Outlook UpdateFollowing a prolonged downtrend that began in September 2024, EMAMI Ltd. has recently exhibited signs of a potential short-term trend reversal on the daily chart. The stock has demonstrated a notable uptick in momentum, marked by several key technical developments.
The stock has decisively moved above its 200-day EMA, a level often regarded as a long-term trend indicator. This breakout was accompanied by a significant increase in trading volume—approximately 5 times the average volume of the 50-day moving average, suggesting heightened market participation. The RSI has crossed above the 60 level, indicating strengthening bullish momentum, though it is approaching the overbought zone.
A bullish crossover in the MACD was observed, further supporting the case for near-term strength.
Around ₹600, where the stock is currently consolidating post-breakout. First resistance near ₹650, Second resistance around ₹690. A technical stop-loss could be considered below ₹548, aligning with recent swing lows and support levels.
Disclaimer: This analysis is intended solely for educational and informational purposes. It does not constitute investment advice or a recommendation to buy or sell any financial instrument. Market participants are encouraged to conduct their own research or consult with a qualified financial advisor before making any trading decisions.
Sigachi’s Technical Surge: Next Resistance in SightOver the past month, Sigachi traded within a well-defined consolidation range, reflecting a period of equilibrium between buyers and sellers. However, in the most recent week, the stock decisively broke out above this consolidation zone on increased trading volume a classic signal of renewed bullish momentum and heightened market interest.
From a trend perspective, the stock has managed to close above all key daily EMAs. Notably, a bullish crossover between the 20-day and 50-day EMAs has emerged, which is often interpreted by technical analysts as a sign of strengthening upward momentum.
Momentum indicators further reinforce this view. The RSI is currently above 75, placing the stock firmly in the overbought territory. While such elevated RSI levels can sometimes precede short-term corrections, they also reflect strong underlying demand during robust uptrends. This bullish sentiment is further supported by a MACD crossover on the weekly chart, which typically signals a continuation of upward price action.
At present, the stock is encountering a minor supply zone (as marked on the chart), which may serve as a near-term resistance. Should the price retrace and find support at the previously identified demand zone, the next potential resistance level is observed around ₹56 .
Disclaimer: This analysis is intended solely for educational and informational purposes. It does not constitute investment advice or a recommendation to buy, sell, or hold any financial instrument. Market conditions are dynamic, and trading decisions should be made based on individual research, risk tolerance, and consultation with a licensed financial advisor.

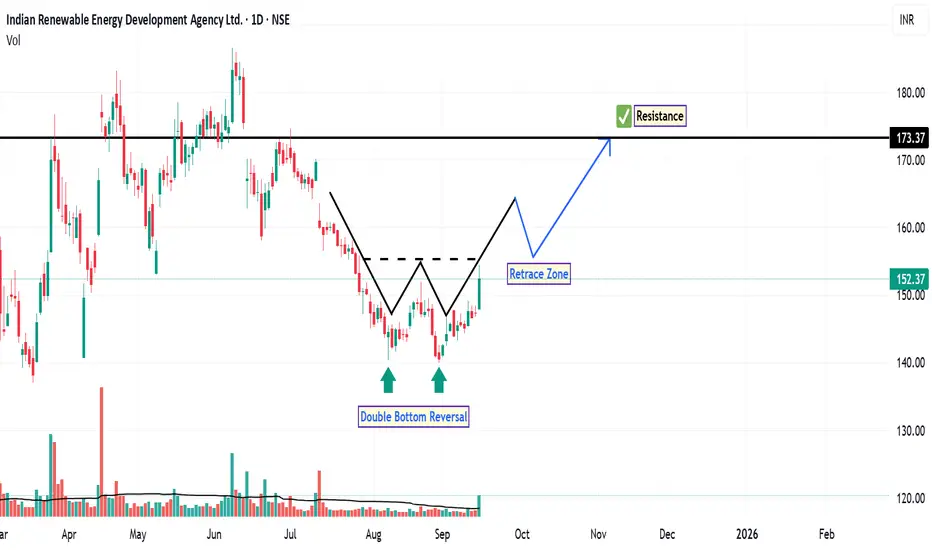
IREDA: Double Bottom in PlayOn the daily time frame, the chart of IREDA has recently displayed a double bottom reversal pattern , a classic technical formation often associated with a potential shift from bearish to bullish sentiment. This pattern, marked clearly on the chart, suggests that buyers may be stepping in at a previously defended price level.
In the preceding downtrend, the stock failed to establish a new low and instead broke above a prior swing high, indicating a CHoCH in market structure. This shift is typically interpreted by technical analysts as a transition from bearish to bullish momentum.
The RSI is currently above 60 , approaching the overbought zone. While this suggests strong buying interest, it also warrants caution as price may be nearing short-term exhaustion. However, in trending markets, RSI can remain elevated for extended periods. Additionally, the stock has managed to close above both the 20-day and 50-day EMAs, accompanied by increased volume, which adds credibility to the bullish setup. These moving averages often act as dynamic support levels and trend confirmation tools.
Based on this technical structure, the next potential resistance levels are identified near ₹160, followed by ₹173 . A technical stop-loss level could be considered at a daily close below ₹140 , which aligns with the double bottom support zone.
Disclaimer: This analysis is intended solely for educational and informational purposes. It does not constitute investment advice or a recommendation to buy, sell, or hold any financial instrument. Market conditions are subject to change, and trading decisions should be made based on individual research, risk tolerance, and consultation with a licensed financial advisor.
WCIL: Bullish Momentum After Demand Zone ReboundFollowing a rebound from a key demand zone in April, the price action of WCIL has entered a bullish trend, which is visually supported by an upward-sloping trendline on the chart. This trendline reflects a series of higher lows and higher highs, indicating sustained buying interest and positive momentum.
Between June and mid-August, the stock entered a consolidation phase, moving sideways within a defined range. Despite the pause in upward movement, the price continued to form higher lows and higher highs, which can be interpreted as a sign of accumulation rather than distribution.
Last week, the stock retraced to a previous higher high zone and managed to rebound once again, reinforcing the continuation of the bullish structure. This behaviour suggests that buyers are defending key levels and maintaining control of the trend.
From a momentum standpoint, the RSI on the daily chart is currently at 70, indicating that the stock is in the overbought zone. However, RSI readings in this range during strong uptrends can also suggest continued strength, especially if supported by volume.
Speaking of volume, there has been a noticeable increase in trading activity during the recent uptrend, which adds further confirmation to the bullish sentiment observed on the chart.
Based on this technical structure, the next potential long-term resistance level is identified near ₹171 , while a technical stop-loss level could be considered at a daily close below ₹103 , which aligns with a key support zone and trendline structure.
Disclaimer: This analysis is intended solely for educational and informational purposes. It does not constitute investment advice or a recommendation to buy, sell, or hold any financial instrument. Market conditions are dynamic, and trading decisions should be made based on individual research, risk tolerance, and consultation with a licensed financial advisor.

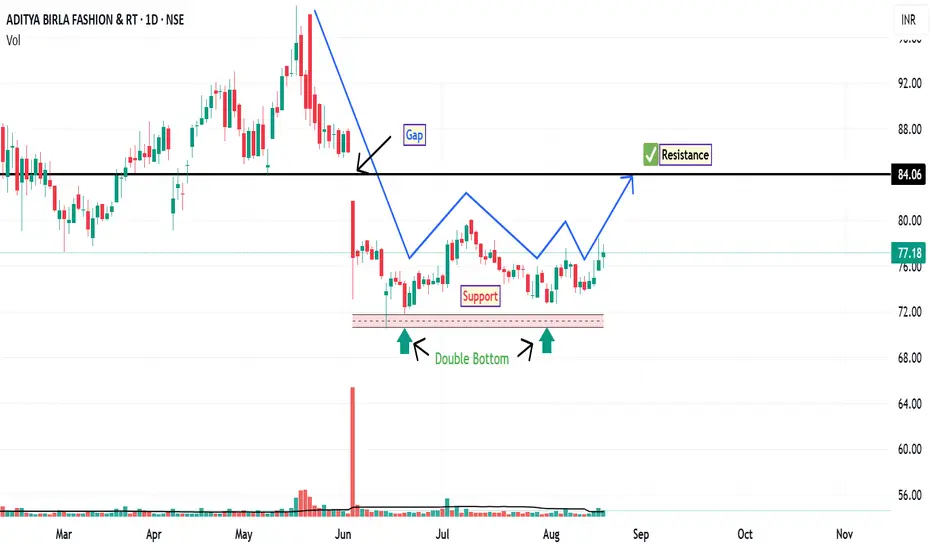
ABFRL: Price Action OverviewFollowing a gap-down opening on June 4, ABFRL entered a consolidation phase, trading within a well-defined supply and demand zone. This range-bound movement suggests a period of accumulation or indecision among market participants. During this consolidation, the stock has formed a double bottom pattern on the daily chart—a classical reversal structure that often indicates a potential shift from a downtrend to an uptrend, provided confirmation follows.
An inverted hammer appeared near the second bottom, signaling potential buying interest at lower levels. This was followed by a bullish pin bar, reinforcing the possibility of a short-term reversal. These candlestick formations, especially when occurring near support zones, can be interpreted as early signs of bullish momentum returning—though follow-through price action is essential.
If bullish momentum sustains than the stock may attempt to fill the gap left from the June 4 session. The gap resistance level is around ₹84 , which could act as a near-term target for traders monitoring this setup.
Disclaimer: This analysis is for educational and informational purposes only. It does not constitute investment advice or a recommendation to buy, sell, or hold any security. Always conduct your own research or consult a licensed financial advisor before making investment decisions.
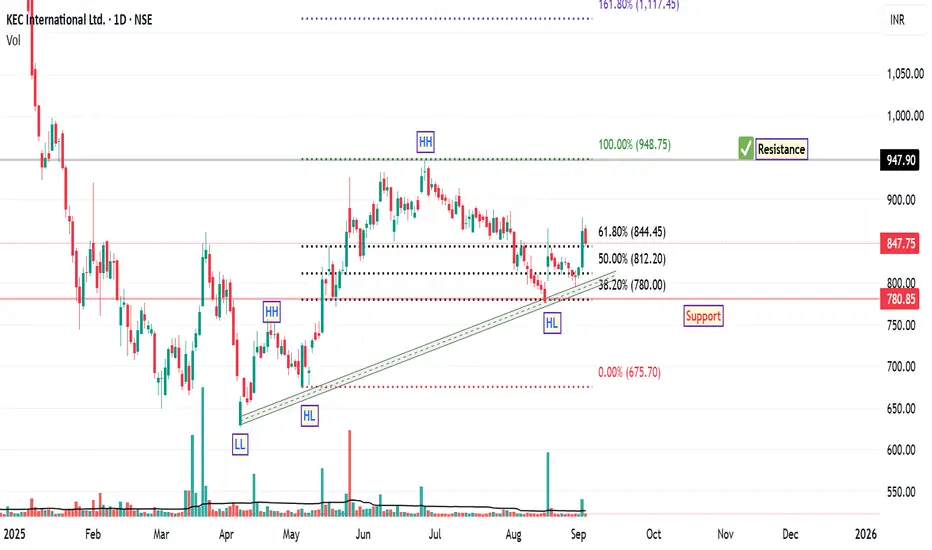
KEC International: Bullish Structure with StrengthSince April 7th, the price structure of KEC International has demonstrated a notable bullish trend reversal, characterized by the formation of higher highs and higher lows along an ascending trendline. This pattern is often interpreted by technical analysts as a sign of strengthening upward momentum.
A recent Fibonacci retracement, drawn from the swing low to the swing high of the current rally, revealed a pullback to the 38.2% level—a zone commonly viewed as a potential support area within a prevailing uptrend. The stock responded positively to this level, rebounding and subsequently closing above the 61.8% retracement level, which is another key technical threshold.
Interestingly, the price has retested the 61.8% level and held firm, suggesting that this area may be acting as a support base. Additionally, the stock has managed to close above its 200-day EMA, a long-term trend indicator that many market participants use to assess broader directional bias. A sustained position above the 200 EMA is generally considered constructive from a trend-following perspective.
From a structural standpoint, based on current chart dynamics, the next potential resistance zone appears to be near ₹948, while the suggested support level is around ₹780 . These levels are derived from historical price action and technical confluence zones, and may serve as reference points for monitoring future price behaviour.
Disclaimer: This analysis is intended solely for educational and informational purposes. It does not constitute investment advice or a recommendation to buy, sell, or hold any financial instrument. Market conditions are subject to change, and trading decisions should be made based on individual research, risk assessment, and consultation with a licensed financial advisor.
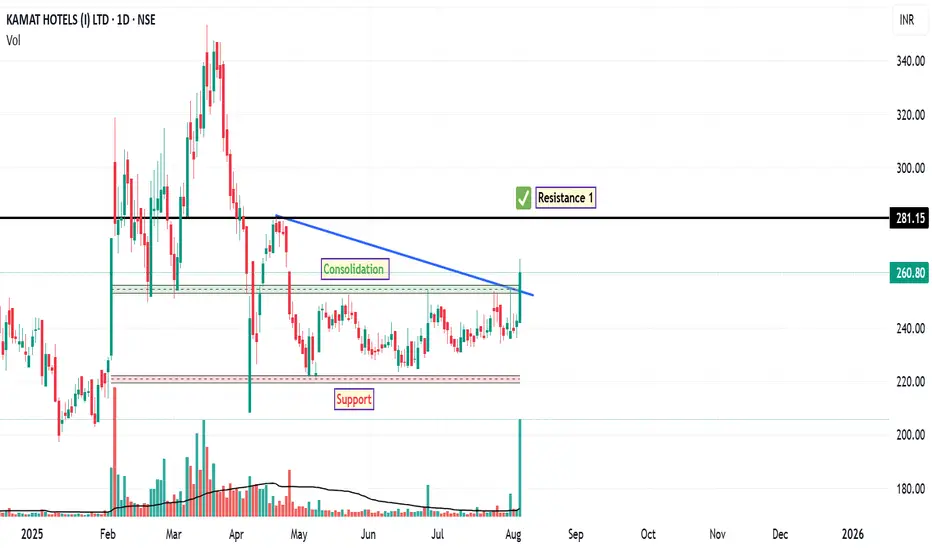
Kamat Hotels: Bullish Breakout from Consolidation RangeThe chart of KAMAT HOTELS has shown breakout from critical consolidation zone, marked on the chart. These levels are essential for assessing the current balance between supply and demand.
1. The Support Level (Marked on Chart)
This level 221 represents a zone of historical demand where buying interest has previously emerged to halt price declines. It acts as a structural floor for the recent price action.
2. The Resistance Level (Marked on Chart)
This level of 281 represents a more formidable area of overhead supply, likely corresponding to a previous significant peak or a major distribution zone. It is the first major target and potential obstacle following a successful breakout.
Disclaimer:
The information provided in this technical analysis is for informational and educational purposes only and should not be construed as financial or investment advice. It is an interpretation of historical price data. Market dynamics can change, and past performance is not indicative of future results. All trading and investment activities involve risk. Always conduct your own thorough due diligence and consult with a qualified financial advisor before making any investment decisions.
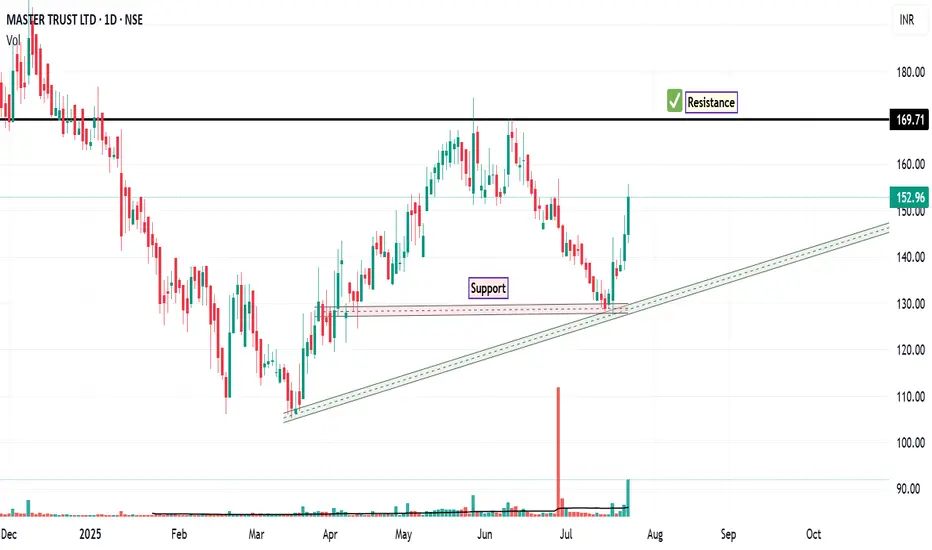
MASTERTR: The Potential Upside OpportunityThe chart of MASTERTR appears to be approaching a critical juncture, marked on the chart. These levels are essential for assessing the current balance between supply and demand.
1. The Support Level (Marked on Chart)
This level 129 represents a zone of historical demand where buying interest has previously emerged to halt price declines. It acts as a structural floor for the recent price action.
Outlook: As long as the price remains above this support zone, the technical structure can be viewed as neutral to constructive. A decisive breach below this level, particularly on increased volume, would suggest a breakdown in structure and could indicate a potential continuation of bearish momentum.
2. The Resistance Level (Marked on Chart)
This level of 169 represents a more formidable area of overhead supply, likely corresponding to a previous significant peak or a major distribution zone. It is the first major target and potential obstacle following a successful breakout.
Disclaimer:
The information provided in this technical analysis is for informational and educational purposes only and should not be construed as financial or investment advice. It is an interpretation of historical price data. Market dynamics can change, and past performance is not indicative of future results. All trading and investment activities involve risk. Always conduct your own thorough due diligence and consult with a qualified financial advisor before making any investment decisions.
Tough Times ahead for Nifty. 26277 Top for some years?Nifty has been in Bull run for some Years now.
2008 to 2020 - Wave 1 Impulse
2020 Crash - Wave 2 Correction
2020 to 2025 - Wave 3 Impulse
2025 to 2026 - Wave 4 Correction
2026 2027 Onwards - Wave 5 Impulse
Let's Break Wave 4
It may take place in Double or Triple wave Combo.
The Corrective Wave ends in 3 or more Legs.
Wave A - 26k to 22k.
Wave B - 22k to 25.5k
Wave C - 25.5k to 21k
Next Set of Legs - to Follow in New idea.
This would be the 1st of the Corrective Combo that is expected to end around 19k By 2026 2027.
Now could be the Time for Wave C with rejection from 0.854 of Fib retracement of Wave A.
It looks like Wave C is about to begin.. Let's meet at 21k 🫣
RSI - Circled - to be noted.
All The Best🥲
Short Trade Activates below 24750.
