Nifty for long The market moves in a very simple way, like impulse or correction. When we traders start understanding impulse or correction, it becomes very easy to anticipate the market movement. However, some traders become too complex and start bringing complexity in the market movement. If we do not become complex and understand the market in impulse or correction, even in the present time frame of hours, then after creating an impulse wave, a correlative wave such as WXY wave is created, in which two possible structures can be formed in the market, either WXY is a complete correction in itself or another wave WXYXZ can be formed. We have to answer this first, whether WXY is a complete correction Let's cross a key level 25946. The market will form the next impulse wave above this key level. Now let's answer the second one. Below 25946, the market can form a lower Z wave. Now we have answered both of them. Now the market itself will tell at which level it is trading. As you and all of us know that after completing a corrective wave, the market forms the next impulse wave. So here the market will form the next impulse wave above the level of 25946 for a new high. That is the simple answer for all traders.
Thanks
Community ideas

Bull Run at a Critical PointThe last hope for bull continuation on the weekly chart lies in the $86K–$74K demand zone.
✅ A strong weekly rejection from this level is mandatory
✅ Followed by a daily close above $107,400
❌ If $107.4K is not reclaimed, this move is just a relief rally in a bearish trend, with more downside ahead.
📉📈 Market structure will decide. Watch the candles, not the noise.

NG : bullish for another highthere is a 5th wave which is pending. which will lead prices to another high in coming weeks or months

Nifty Auto – Summary Nifty Auto is showing strong consolidation and higher lows, indicating accumulation.
Index is near a key resistance zone; a breakout with volume can trigger momentum.
Sector leaders (Maruti, M&M, Tata Motors) and auto ancillaries are participating, improving breadth.
The sector is outperforming Nifty 50, suggesting sector rotation in favor of Auto.
Breakout validity depends on holding base support; weakness below it invalidates the setup.
Risks: broader market weakness, crude price spike, global demand slowdown.
Conclusion:
👉 According to my analysis, Nifty Auto looks positioned for an upside breakout if resistance is crossed with volume. This is a personal technical view, not investment advice.

BTCUSD WEEKLY ANALYSISAll support and resistance in the weekly and monthly time frames have been tested from 126000 to 76000.
A reaction of the weekly and monthly supply zones results in an explosive red candle in both time frames.
as per my opinion, the very next demand zone in the weekly time frame range is 74000 to 64000 for aggressive buyers.
And for conservative buyers, it is 69700 to 64000.

Sensex - Weekly Review Dec 22 to Dec 26The price is sustaining above 84700, and still it is unable to test the next resistance zone at 85300. It is buy on dips above 84500.
If price opens flat, buy above 84720 with the stop loss of 84580 for the targets 84840, 84980, 85120, 85260, 85400, 85580 and 85760.
Sell below 84400 with the stop loss of 84540 for the targets 84240, 84100, 83960, 83800, 83660, 83520 and 83300.
Always do your analysis before taking any trade.

Why Gold Spikes Right When Everyone Gives Up!Hello Traders!
Over the years, one thing I’ve noticed again and again is this, gold rarely moves when everyone is confident about it.
In fact, the strongest gold spikes I’ve seen came at moments when traders were tired, bored, and emotionally done with gold.
No excitement, no news, no hype. just silence and frustration. That is usually when gold decides to move. This post is about that exact moment most people miss.
1. The Phase Where Traders Emotionally Disconnect
After a long consolidation or slow decline, gold starts testing patience more than levels.
Daily candles become small, nothing seems to work, and traders slowly stop caring.
People say things like “gold is not moving” or “nothing is happening here” and shift their attention elsewhere.
I’ve personally learned to be very alert during this phase.
When traders disconnect emotionally, the market often prepares its next move.
2. Giving Up Is Not Random, It Is a Signal
When traders finally give up, they close positions without a plan, just to feel relief.
This creates a wave of selling from weak hands.
That selling provides clean liquidity for stronger participants to step in quietly.
Gold does not spike because something suddenly improves.
It spikes because selling pressure gets exhausted.
3. Why Gold Loves Emotional Extremes
Gold is not driven only by fundamentals, it is heavily driven by emotion and sentiment.
Fear pushes people into gold, boredom pushes them out.
When boredom and frustration peak, price often stops falling even though sentiment stays negative.
Whenever I see gold refusing to go lower despite bad sentiment,
I know the story is changing under the surface.
4. What Retail Traders Usually Do at This Point
Most retail traders stop watching gold charts completely.
They move to faster markets or trending assets.
They tell themselves they will come back “once gold starts moving again”.
Ironically, by the time gold starts moving, it is already far from the level where patience was required.
5. How I Personally Read These Gold Spikes
I focus more on behavior than prediction.
I look for long periods where price goes nowhere but also refuses to break down.
I pay close attention when volatility compresses and volume dries up.
When price holds steady while emotions collapse,
I don’t rush, I observe.
That calm observation has helped me catch moves that looked sudden to everyone else.
6. The Spike Feels Sudden Only If You Were Not Prepared
By the time gold spikes, accumulation is usually already complete.
To emotional traders, the move feels random and unfair.
To prepared traders, it feels logical and almost expected.
Big moves never announce themselves loudly.
They quietly prepare while most people lose interest.
Rahul’s Tip
Whenever I feel bored or frustrated watching gold, I pause instead of walking away.
That emotional discomfort is often a signal, not a problem.
If you can stay present when others disconnect, you automatically gain an edge.
Conclusion
Gold rarely spikes when belief is strong. It spikes when patience is gone and hope feels weak.
If you understand this emotional timing, you stop chasing gold and start positioning before it moves.
If this post felt relatable, like it, share your experience in the comments, and follow for more market psychology insights.

Silver Intraday: Exhaustion Sell Near Upper Bollinger BandTrading Day - Monday (22nd Dec 2025)
Entry : Sell
Entry Zone: 208,000 – 208,200
Stop Loss: 208,760
Targets: MCX:SILVER1!
T1: 207,000
T2: 206,000
Reason:
* Upper BB rejection candle → momentum exhaustion
* PSAR dots compressing → trend strength weakening
* Vertical rally without pullback → correction likely
* Red candle after strong green → profit booking sign
* Price far above BB mid → mean reversion risk
Risk:
• Risk per trade < 2%
• Avoid trade if SL hit or Wait for next Entry confirmation
#Silver
#Intraday
#Commodities
#RSI
#PSAR
#RiskManagement

Nifty Intraday Levels🎯 LEVELS FOR TODAY | 22-Dec
📊 NIFTY 50 (25966)
BULLISH 🟢 | Width: 0.44%
━━━━━━━━━━━━━━━
🔹 Pivot: 25947
🟢 R3: 26127 | 🔴 S3: 25788
🟢 R2: 26060 | 🔴 S2: 25834
🟢 R1: 26014 | 🔴 S1: 25901
Range: 113 (0.43%)
📊 BANKNIFTY (59069)
BULLISH 🟢 | Width: 0.41%
━━━━━━━━━━━━━━━
🔹 Pivot: 59036
🟢 R3: 59418 | 🔴 S3: 58688
🟢 R2: 59279 | 🔴 S2: 58793
🟢 R1: 59175 | 🔴 S1: 58931
Range: 243 (0.41%)
💡 Trading Strategy
• Trade above Pivot = Long bias
• Trade below Pivot = Short bias
• Narrow Width Below .50 = Strong trend expected
• Wide Width Above .50 = Sideways/Range day

19 Dec 2025 - Nifty still long, but hurting our PnLs + PostMorteNifty Stance Bullish 🐂
Nifty has been in a consolidation mode since the last week of October, and that's really hunting trend-following traders. One of these days, Nifty will have to breakout and the only question remains - when?
Nifty has been in this cycle of going short on Tuesdays and going long on Fridays. The sad part is that there is no follow-up buying or selling. The only way for a trend follower to survive is to reduce position size and keep following the system.
This is the consolidation I am talking about, from 20th Oct to date. The good thing for the bulls is that the supports are really holding up well; every time we go hitting them, the bounces are coming. The sad part is that, even without resistance, Nifty is unable to go up.
This is where a little good news can do wonders. If the central government is considering reducing the burden of LTCG or STT, this is the right time, as such a move, when combined with a reduction of GST and increases in tax slabs, can have an avalanche effect on consumption. Traders are watching, so are the economists, because all of us know that there could be a lag of 6 to 9 months for the GST reduction to trickle down to the bottom level.

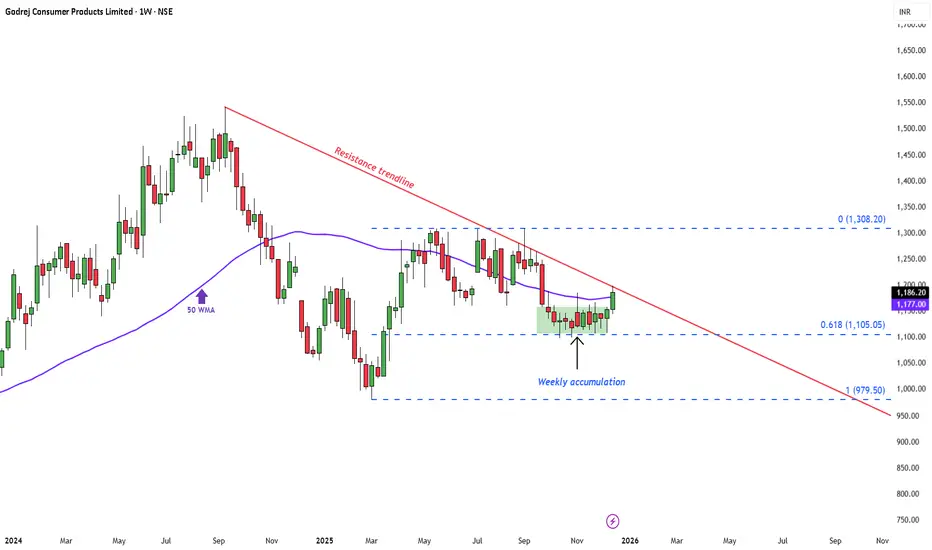
Godrej Consumer Products: Weekly Accumulation Showing StrengthAfter weeks of quiet accumulation near the 0.618 retracement (~₹1,105) , the stock has now delivered a weekly close above the 50-week moving average — a constructive sign of improving sentiment.
The move also puts price right at the descending resistance trendline , where follow-through buying will determine if this recovery extends further.
The structure continues to look steadily constructive , with early signs of buyers regaining control.
As long as the stock holds above the recent base, the bias leans cautiously bullish .
Disclaimer: This analysis is for educational purposes only and does not constitute investment advice. Please do your own research (DYOR) before making any trading decisions.
AUROPHARMA – Structural Trend Shift After Base FormationAUROPHARMA went through a long corrective phase and built a base around the 1000–1050 zone.
That phase ended when price started forming higher lows, followed by higher highs, confirming a structural change.
The move above ~1225 is important because this level earlier acted as resistance. Price is now holding above it, which shows acceptance rather than rejection. This tells us supply at higher levels is being absorbed.
The recent pullback is controlled, not impulsive. No sharp selling, no expansion in downside volume. This indicates sellers are not aggressive at current levels.
Volume increased during the upward move and contracted during the consolidation, which is typical of a healthy trend transition.
This chart is shared to highlight how markets shift from correction to trend through structure, not through indicators or news.

SMALLCAP Index at Make or Break Zone – Momentum Shift Brewing The Nifty Smallcap 100 index is currently trading at a critical confluence area, where a major horizontal support aligns with a long-term falling trendline resistance. After a prolonged corrective phase, price has shown a clear base formation near support, indicating selling pressure is gradually drying up.
The recent bounce from the support zone suggests demand is stepping in, and price is now attempting to move back towards the descending resistance line. This structure reflects a compression setup, where volatility is shrinking before a directional move.
RSI is still placed in the lower-neutral zone, but has started to curl up from oversold territory. This behaviour often precedes a trend reversal or strong pullback rally, especially when price is supported structurally.
If the index manages to sustain above the current base and break the falling trendline, it can trigger a strong recovery leg, which is typical when smallcaps start outperforming after a consolidation phase. Failure to break, however, may lead to short-term range-bound movement.

Practical Study On Supply and Demand Concept NSE:ICICIBANK
Most traders fail at Supply & Demand for one simple reason:
They draw zones…
but don’t understand context, intent, or execution.
Zones don’t make money.
Decisions do.
📘 Supply & Demand – Practical Application
All the charts are annotated in very much details no description is needed so study these charts in detail and that will be self-explanatory.
1.
2.
3.
4.
5.
6.
7.
8.
9.
10.
11.
12.
13.
14.
15.
16.
Keep Learning,
Happy Trading.

#Nifty Weekly 22-12-25 to 26-12-25#Nifty Weekly 22-12-25 to 26-12-25
Nifty managed to close above the trendline which is holding the current downtrend.
If Nifty sustains above 26100, XABCD activates and targets are 26250/26400 on upside.
Short level is only below 25780.
View: Sideways to bullish.

NIFTY Intraday Trade Setup For 22 Dec 2025NIFTY Intraday Trade Setup For 22 Dec 2025
NIFTY has closed on a positive note last day. Consecutive 4 pinbars have formed in weekly TF. A good consolidation near ATH. Now we have zones marked for the next leg of move. 26400 and 25700 are key levels for any directional move either side. It is simply sideways inside this range.
Above 25060 index will be bullish in intraday and 25890 is the downside gateway. Plan trades on 15 Min candle close on intraday levels.
26250 and 25800 zone will be intraday resistance and support respectively.
I am Not SEBI Registered
This is my personal analysis for my personal trading. Kindly consult your financial advisor before taking any actions based on this.

Most Traders Don’t Lose on Entries — They Lose on ExecutionOn higher timeframes like H4 Gold (XAUUSD), direction is rarely the real problem.
Most traders can identify:
bullish structure,
bearish pullbacks,
key levels,
higher-timeframe bias.
Yet despite this, execution errors repeat.
This chart is a good example of a market that appears “clear,” but still creates hesitation, late entries, premature exits, and emotional decisions.
(This chart is shared only as a visual reference to discuss execution behavior on higher timeframes.)
Most traders spend 90% of their energy hunting the “perfect entry.”
But the real account killer is what happens after a valid entry appears:
entering late because the move “looks strong”
holding through momentum decay
adding size during uncertainty
refusing to exit when risk expands
trading in chop because “I need to do something”
confusing trend bias with execution permission
Valid setup ≠ valid execution.
Execution is a decision system, not a feeling.
The real problem (across every trader type)
Whether you’re retail, institutional, or funded, the core pain is the same:
You can identify direction.
You struggle to answer what to do now.
The market doesn’t pay you for being right on direction.
It pays you for managing timing, risk, and behavior.
Retail traders (most common failure)
Retail usually loses from:
FOMO entries (late chase)
overtrading ranges
emotional exits
inconsistent risk per trade
Retail doesn’t need more indicators.
Retail needs permission and discipline.
Funded traders (most common failure)
Funded traders usually lose from:
breaking rules under pressure
revenge trades after a scratch
“one big trade” mentality
ignoring the firm’s drawdown mechanics
Funded trading isn’t about prediction.
It’s about rule-quality execution.
Institutional mindset (what actually works)
Institutions don’t trade “signals.”
They trade a process:
Directional context (bias)
Structure context (where price is relative to key zones)
Liquidity context (is price sweeping / trapped / absorbing?)
Momentum quality (is follow-through healthy?)
Volatility environment (is the market tradable or compressed?)
Final permission (act vs wait)
Post-entry management (hold / protect / partial / exit)
That’s the difference.
The solution: a Decision Framework (not a signal)
Instead of asking, “Is this a buy?” Ask these questions for every candle:
Should I act or wait?
If I act, am I early, on time, or late?
Is momentum improving or decaying?
Is volatility supportive or compressed?
Is the risk expanding (pressure) or stable?
Do I have a reason to stay—or a reason to protect?
The professional edge is not entries.
It’s execution control.
Practical checklist (simple, strict)
If context is unclear, WAIT
If momentum is weak and volatility is compressed → WAIT
If price is extended / late → NO CHASE
If risk rises after entry → PROTECT / PARTIAL / EXIT
If your plan is not clear, DO NOTHING
Doing nothing is a position.
Discussion
I’m interested in how other traders handle execution decisions :
What makes you switch from “hold” to “protect”?
What is your strongest rule for “do not trade”?
Which is harder for you: entry discipline or exit discipline?
Comments welcome—happy to discuss further.
⚠️ Disclaimer
This post is for educational discussion only.
No financial advice.
No guarantees.
Always manage your own risk.
# Gold
#XAUUSD
#TradingPsychology
# Execution
#RiskManagement
#MarketStructure
#TradingEducation
#DiscretionaryTrading
#ProfessionalTrading

APL APOLLO – Cup & HandleAPL Apollo spent several months correcting after a strong up-move and gradually formed a rounded base. This phase reflects distribution getting absorbed and weak hands exiting, not aggressive selling.
Price then retraced back toward the prior resistance zone around 1820–1830, which acted as the rim of the cup. Instead of rejecting sharply, the stock moved into a shallow pullback (handle), showing that sellers were unable to push price meaningfully lower.
The handle formed with controlled candles and steady volume, which is important. There was no panic selling or wide-range breakdown during this phase, indicating demand remained intact.
The recent move back above the rim comes with visible volume expansion, confirming participation rather than a low-liquidity spike. This behaviour aligns with how continuation patterns resolve when supply is absorbed.
The pattern itself explains the behaviour.

NIFTY : Trading levels and Plan for 22-Dec-2025NIFTY Trading Plan for 22-Dec-2025
(Chart reference: 15-min | Gap criteria considered: 100+ points)
Key Levels from Chart
Opening Pivot (Support / Resistance): 25,985
Opening Support Zone: 25,858 – 25,891
Last Intraday Support: 25,808
Buyer’s Support Zone: 25,640 – 25,672
Last Intraday Resistance: 26,100 – 26,137
🟢 1. GAP-UP OPENING (100+ Points)
If NIFTY opens above 25,985, price enters a positive momentum structure but near overhead supply.
🎓 Educational Explanation:
A gap-up above a key pivot reflects bullish overnight sentiment. However, markets often pause near prior resistance zones as early longs book profits. A sustained move above resistance is healthier than a straight vertical rally.
Plan of Action:
If price sustains above 25,985 for 10–15 minutes, look for pullback-based long entries.
Upside momentum can extend toward 26,100 – 26,137, a strong supply zone.
Acceptance above 26,137 may trigger trend continuation; manage trades with trailing SL.
Rejection from 26,100 – 26,137 can lead to a pullback toward 25,985.
Option buyers should avoid chasing CE at the open; enter only after retest confirmation.
🟡 2. FLAT OPENING
A flat open near 25,940 – 25,980 keeps NIFTY inside the balance zone.
🎓 Educational Explanation:
Flat opens indicate equilibrium between buyers and sellers. Direction emerges only after a breakout or breakdown of the opening range. Trading without confirmation in such conditions often leads to whipsaws.
Plan of Action:
Sustaining above 25,985 turns sentiment bullish, targeting 26,100 – 26,137.
Failure to hold 25,985 keeps price vulnerable to a decline toward 25,891 – 25,858.
Strong bullish rejection near 25,858 – 25,891 offers low-risk bounce trades.
Breakdown below 25,858 shifts control to sellers for a move toward 25,808.
🔴 3. GAP-DOWN OPENING (100+ Points)
If NIFTY opens below 25,858, early sentiment turns weak.
🎓 Educational Explanation:
Gap-down openings often trigger emotional selling. However, strong demand zones frequently attract buyers and short-covering. Selling blindly into support increases risk.
Plan of Action:
First support to watch is 25,808 — observe price behaviour closely.
A breakdown below 25,808 exposes the Buyer’s Support Zone: 25,640 – 25,672.
Bullish reversal patterns in 25,640 – 25,672 can lead to a recovery toward 25,858.
Any pullback toward 25,858 after breakdown becomes a selling-on-rise opportunity.
⚙️ Risk Management Tips for Options Traders 🛡️
Avoid trading the first 5–10 minutes during gap days.
Do not buy options near resistance or sell near support without confirmation.
Use time-based stop loss (15–20 minutes) if the premium doesn’t move.
Risk only 1–2% of capital per trade.
Prefer ATM options or spreads to reduce theta decay.
Book partial profits near marked resistance/support zones.
🧾 Summary & Conclusion
Above 25,985: Bulls stay active; targets 26,100 – 26,137.
Between 25,858 – 25,985: Market remains range-bound; patience is key.
Below 25,858: Sellers gain control unless buyers defend 25,808 / 25,640–25,672.
Focus on price behaviour at levels, not prediction.
Consistency comes from discipline, not over-trading.
⚠️ Disclaimer
I am not a SEBI-registered analyst. This trading plan is for educational purposes only and should not be considered financial or investment advice. Please consult your financial advisor before taking any trades.

Nifty - Weekly Review Dec 22 - Dec 26The price was testing 26k for the past few days and was unable to sustain above it. Friday, we had a range-bound movement.
Buy above 25900 with the stop loss of 25840 for the targets 25960, 26020, 26080, 26120, 26180 and 26240.
Sell below 25760 with the stop loss of 25820 for the targets 25720, 25660, 25600, 25560, 25500, 25440 and 25380.
As per the daily chart, the price is above the trend line and bullish.
Always do your analysis before taking any trade.

OBEROI REALTY – Triple Bottom StructurePrice has tested this support area three times and each time buyers stepped in.
That tells me supply is getting absorbed here. Each dip into this area attracted buyers, while sellers failed to push price lower.
When supply is repeatedly met with demand at the same level, the market is building acceptance, not weakness.

BANKNIFTY - ELLIOTT WAVE ANALYSIS - DAILY TF.Hallo Investors/Traders today analysis of bank nifty indices now is going wave 5 super cycle degree its ending diagonal pattern forming cycle degree wave 3 completed soon then 4, 5 next possible big correction so plan your position carefully

TRENT : When price corrects, smart money observes — not panics.NSE:TRENT
Technical View (Monthly)
Long-term trend bullish, currently in a healthy correction
0.618 Fibonacci support: ₹3,900–4,100 → key demand zone
Resistance: ₹4,900–5,000 (must cross for fresh uptrend)
Trend damage only if: Monthly close below ₹3,800
Expect sideways consolidation before the next big move
Fundamental View
Strong retail brands, aggressive store expansion
Earnings growth is strong, but the valuation was stretched
Current correction = valuation & time adjustment, not business issue
Future Growth Outlook
Positive long-term drivers: consumption growth + scale benefits
Near-term returns may stay muted; 3–5 year story intact
Actionable Summary
Investors: Accumulate near ₹4,000 with patience
Traders: Bullish only above ₹5,000
Risk: Breakdown below ₹3,800
Verdict: High-quality stock in correction phase, not a trend reversal.
==============
⚠️ Disclaimer:
==============
This content is shared strictly for educational and informational purposes.
We are not SEBI-registered investment advisors or analysts.
The views expressed are personal opinions, based on publicly available data and market observations.
Please consult a SEBI-registered investment advisor before taking any investment or trading decisions.
Any actions taken based on this content are entirely at your own risk and responsibility.
========================
Trade Secrets By Pratik
========================
