XAUUSD ANALYSISI am posting a chart of XAUUSD this is the possible outcomes of the wave as per myview
3rd wave is completed and the current xauusd is in correction we can see abc correction on longterm as per trukit last wave now we can see trendline liquidity is need to be taken and in upcoming days we can see gold around 3820 from we can see 4-5wave as per my view.
Thanks
A-trend

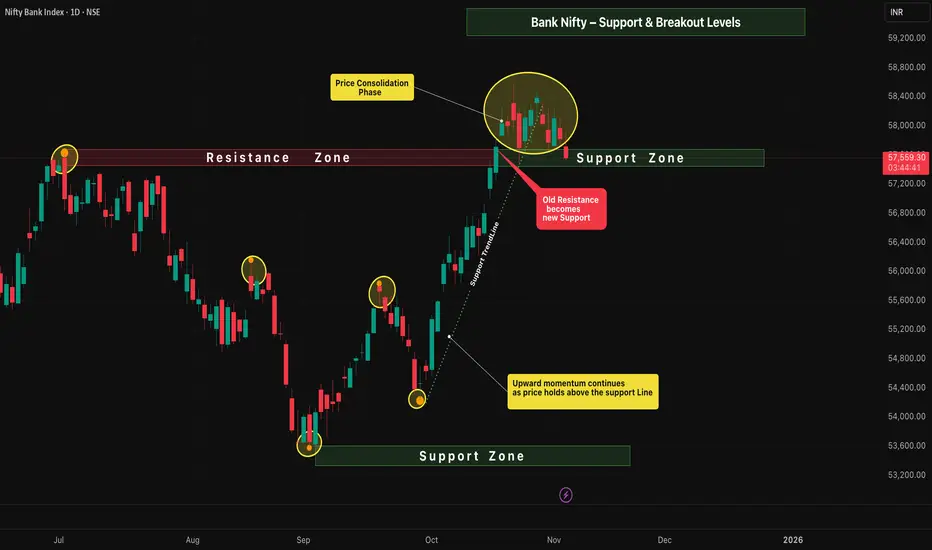
Bank Nifty – Support & Breakout Levels📈 Bank Nifty – Daily Timeframe Analysis
The price structure on the daily chart shows a healthy continuation of the upward momentum , maintaining strength above the key support zone.
Buyers are still in control, but the market has now entered a phase of sideways consolidation — signaling preparation for the next directional move.
⸻⸻⸻⸻⸻⸻⸻⸻⸻⸻
📊 Key Observations
1️⃣ Upward Momentum Continues — Price remains above the support line, showing sustained bullish control and healthy trend structure.
2️⃣ Consolidation Range — Price is currently consolidating between 58577.50 and 57482.05 , reflecting a balance between buyers and sellers.
3️⃣ Old Resistance → New Support — The previous resistance zone is now acting as a strong support base, adding confirmation to the bullish sentiment.
4️⃣ Breakout Scenarios —
A break above the consolidation high at 58,577.50 could ignite the next upward leg and continue the prevailing uptrend.
• A break below the support zone at 57,482.05 may shift momentum to the downside, opening the possibility of a move toward the previous support area.
⸻⸻⸻⸻⸻⸻⸻⸻⸻⸻⸻
✅ Summary
• Trend bias remains bullish as long as price holds above the key support line.
• Consolidation signals short-term indecision before the next major move.
• A confirmed breakout candle above 58,577.50 may open the path for further upside.
• Conversely, a breakdown below 57,482.05may invite short-term selling pressure toward the old support region.
⸻⸻⸻⸻⸻⸻⸻⸻⸻⸻⸻
⚠️ Disclaimer:
📘 For educational purposes only.
🙅 Not SEBI registered.
❌ Not a buy/sell recommendation.
🧠 Purely a learning resource.
📊 Not Financial Advice.
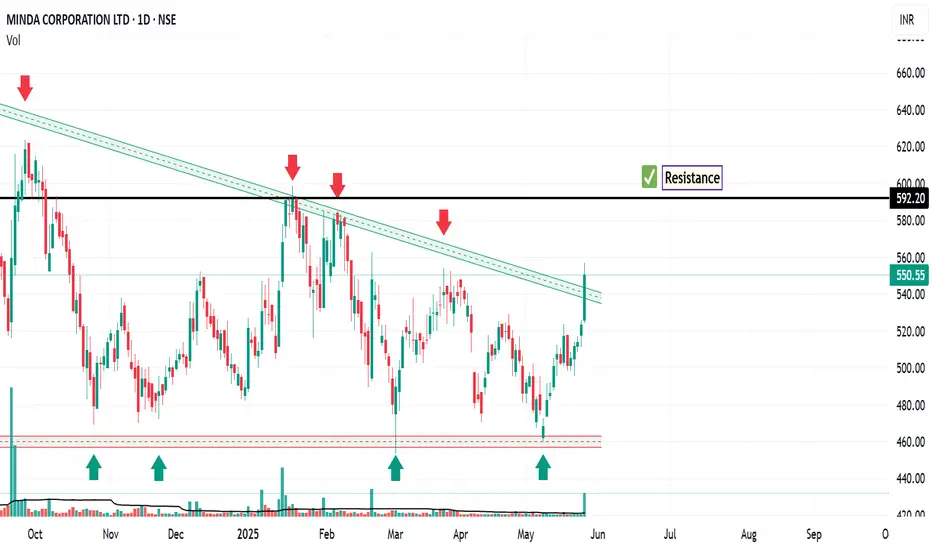
Minda Corp: Gearing Up for a BreakoutThe chart of Minda Corp provides delineates critical price thresholds that signify breakout points, along with specific support levels that serve as indicators of where buying interest may manifest.
Additionally, the chart highlights regions likely to act as ceiling points for future price ascensions, allowing for informed decisions on entry and exit strategies.
Disclaimer: The information contained in this technical analysis report is intended solely for informational and educational purposes. It should not be interpreted as financial advice or a recommendation to buy or sell any security. Investors are strongly encouraged to conduct their own research and consult with a qualified financial advisor before making any investment decisions.
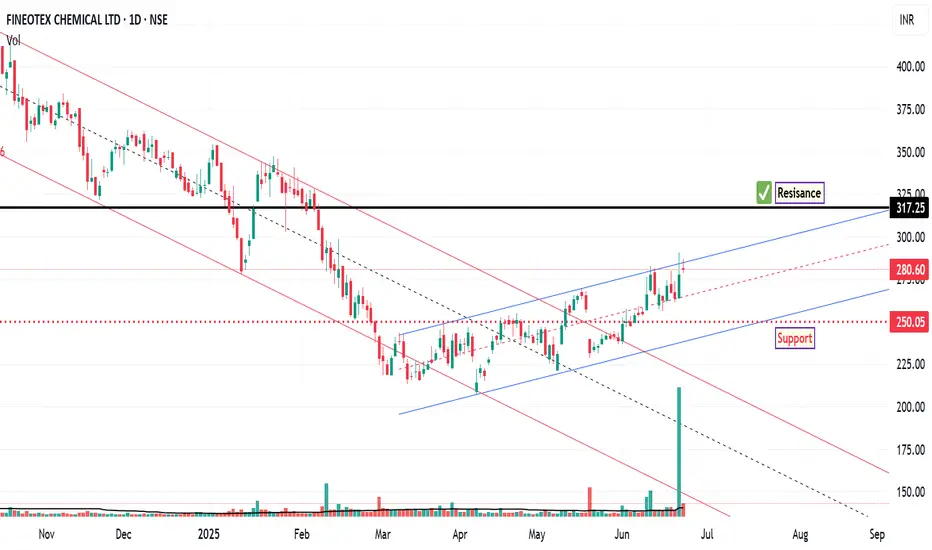
FCL: Technical Setup Signals 10% Upside Potential
The chart of FCL outlines key price levels that represent potential breakout zones, signaling shifts in market momentum. It also identifies critical support areas where buying interest may emerge, offering insight into potential entry points.
Additionally, resistance zones are clearly marked, indicating probable barriers to upward price movement. These levels are instrumental in formulating strategic entry and exit decisions based on anticipated market behaviour.
Disclaimer:
This technical analysis is provided for informational and educational purposes only. It does not constitute financial advice or a recommendation to buy or sell any security. Investors should perform their own due diligence and consult with a licensed financial advisor before making any investment decisions.
XAUUSD Gold Trading Strategy September 12, 2025XAUUSD Gold Trading Strategy September 12, 2025: Gold rebounded strongly, fully supported by US economic data and trend technical conditions.
Fundamental news: On Thursday (September 11) in the New York trading session, gold prices fluctuated strongly due to the influence of the US CPI index and initial data on unemployment claims. Gold prices recovered strongly in today's Asian session and are currently trading at $3,650/oz.
Technical analysis: Gold prices increased sharply after the CPI news was released. Currently, gold prices have increased sharply but are still fluctuating in the 3,600 - 3,660 range and there are no signs of a breakout. We still prioritize trading according to the main trend and waiting for trading at the confluence of MA and FVG.
Important price zones today: 3635 - 3640, 3600 - 3605 and 3660 - 3665.
Today's trading trend: BUY.
Recommended orders:
Plan 1: BUY XAUUSD zone 3635 - 3637
SL 3632
TP 3640 - 3650 - 3660 - 3690.
Plan 2: BUY XAUUSD zone 3600 - 3602
SL 3597
TP 3605 - 3615 - 3635 - 3665 - OPEN.
Plan 3: SELL XAUUSD zone 3663 - 3665
SL 3668
TP 3660 - 3650 - 3640 - 3630. (small volume).
Wish you a successful, effective and profitable weekend trading day.🌟🌟🌟🌟🌟

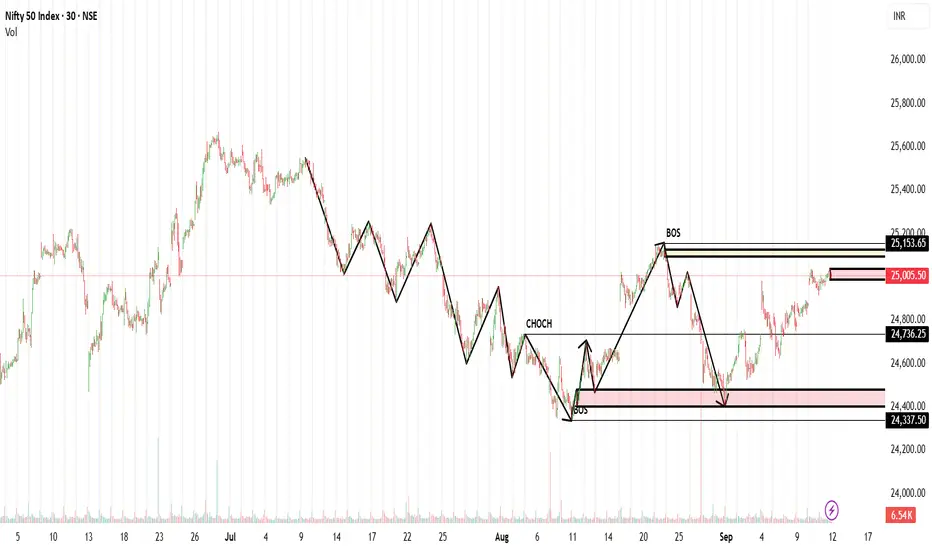
Nifty 50 is about to breakoutPlease refer to the image you will get the idea that nifty is about to reverse with huge momentum.
XAUUSD Gold Trading Strategy September 10, 2025XAUUSD Gold Trading Strategy September 10, 2025: Gold stabilized after falling from yesterday's new high, the market will focus on US inflation data in the final period of the week from today.
Fundamental news: Investors will now turn their attention to US inflation data, scheduled for release on Wednesday and Thursday. Inflation data will be of particular interest following weak employment data ahead of the Federal Reserve's monetary policy announcement next week.
Technical analysis: After gold prices made a new all-time high at $3,675/ounce, prices corrected to the 362x area and increased again as we predicted earlier. The MA lines still maintain support for the price, however, yesterday's correction has reduced the previous strong increase. We continue to trade according to the main trend: waiting for a trading point at the support area combined between MA and FVG. In addition, the next profit-taking phase may occur unexpectedly, to avoid this risk we must ensure to maintain the trading principle.
Important price zones today: 3615 - 3620, 3595 - 3600 and 3660 - 3665.
Today's trading trend: BUY.
Recommended orders:
Plan 1: BUY XAUUSD zone 3615 - 3617
SL 3612
TP 3620 - 3630 - 3650 - 3660.
Plan 2: BUY XAUUSD zone 3595 - 3597
SL 3592
TP 3600 - 3610 - 3630 - 3660.
Plan 3: SELL XAUUSD zone 3663 - 3365
SL 3668
TP 3660 - 3650 - 3630 - 3600. (small volume).
Wish you a safe, effective and profitable trading day.💯💯💯💯💯

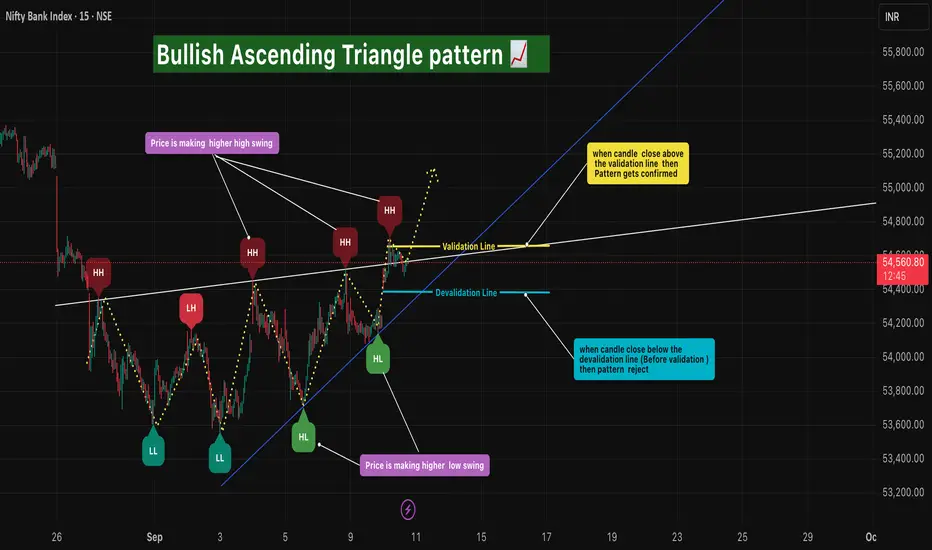
Bullish Ascending Triangle pattern🔎 Intro / Overview
The Bullish Ascending Triangle is a continuation pattern that signals strength in an uptrend 📈.
It forms as price creates Higher Highs and Higher Lows in sequence, compressing toward a breakout level.
This structure shows buyers stepping in at higher levels while sellers gradually weaken, often leading to a bullish breakout.
___________________________________________________________
📌 How to Use
Identify a prior uptrend → the base condition for Ascending Triangle.
Price consolidates by forming Higher Lows and retesting the same resistance level.
Validation → Mark the close of candle that break upper trend line
Devalidation → Swing Low ( when any candle break the upper trend line).
Entry → Confirmed only when price closes above the Validation level .
Stop Loss → Swing Low (Candle break the upper trend line ).
Target → Equal to the measured height of the triangle or 1R multiples.
___________________________________________________________
🎯 Trading Plan
Entry → On breakout close above Validation level.
Stop Loss → Swing Low (Candle break the upper trend line ).
Target → Conservative 1R, Moderate 2R,
Remaining lots → Trail using ATR, Fibonacci, or structural swing highs.
___________________________________________________________
📊 Chart Explanation
Price starts in an uptrend.
Forms a sequence of Higher Highs and Higher Lows .
Resistance holds flat at the top, forming the Ascending Triangle shape 🔺.
Breakout above the Higher High Validation line triggers entry ✅.
Swing Low = Devalidation ⛔.
Target 1 achieved 🎯, trailing used for further upside 🚀.
___________________________________________________________
👀 Observation
Works best as a continuation pattern in established uptrends.
A strong bullish breakout candle adds conviction.
Sideways/choppy markets may cause false breakouts → validation rules filter them.
Volume confirmation strengthens the setup.
___________________________________________________________
❗ Why It Matters?
Represents buyer dominance with sellers weakening over time.
Provides a clear breakout entry with strict SL and TP.
Helps traders capture trending moves while minimizing false signals.
Rule-based framework improves discipline and consistency.
___________________________________________________________
🎯 Conclusion
The Bullish Ascending Triangle Pattern is a reliable continuation signal for trend traders.
By combining Higher Highs, Higher Lows, and breakout confirmation, traders can enter with confidence, manage risk, and trail profits effectively.
🔥 Patterns don’t predict. Rules protect. 🚀
___________________________________________________________
⚠️ Disclaimer
📘 For educational purposes only.
🙅 Not SEBI registered.
❌ Not a buy/sell recommendation.
🧠 Purely a learning resource.
📊 Not Financial Advice.
XAUUSD Gold Trading Strategy September 3, 2025XAUUSD Gold Trading Strategy September 3, 2025: Gold prices are stable, heading towards the $3,550 mark with ETF capital flows boosting and the market is also waiting for employment data and developments from the FED.
Basic news: Spot gold prices remained stable in today's Asian trading session, after rising sharply in the previous session. The current international gold price is around $3,531/ounce, according to CMC Group's FedWatch Tool, the market is pricing in nearly 92% of the possibility that the Fed will cut 25 basis points at the meeting on September 17.
Technical analysis: Spot gold prices continue to increase strongly. The rising price channel remains. Currently, the MA lines and the Fib frame are still very good support areas for prices, however, the RSI is in the overbought area; we should be careful that prices will have a correction first and then increase again. We limit FOMO, continue to wait at support zones combined between MA, Fib and FVG zone.
Important price zones today: 3500 - 3505 and 3475 - 3480.
Today's trading trend: BUY.
Recommended orders:
Plan 1: BUY XAUUSD zone 3500 - 3502
SL 3497
TP 3505 - 3515 - 3530 - 3550.
Plan 2: BUY XAUUSD zone 3475 - 3477
SL 3472
TP 3480 - 3490 - 3500 - 3530.
Wish you a safe, effective and profitable trading day.💯💯💯💯💯

Bitcoin is at Edge This is a very rare Pattern where it gives an option to Open Hedge Positions.
Upper Trend line is The Strong Resistance so we may se a small correction in price. ( 2% to 3% )

XAUUSD Gold Trading Strategy August 1, 2025:
Yesterday's trading session, gold prices recovered to the 3315 area and then continued to decrease to the 3281 area. Currently, gold prices are fluctuating quite unpredictably due to the impact of tariff news and investor confidence.
Basic news: The Federal Reserve FED continues to maintain the federal funds benchmark interest rate in the range of 4.25% - 4.50%, in line with policy since 2025. Chairman Powell did not give any signal about the next interest rate cut on September 16 - 17.
Technical analysis: After falling sharply to the 3269 area, gold prices are showing signs of recovery. In the current downtrend channel, there has been a higher bottom than the bottom at H1. We can see that if the bullish pattern at H1 is confirmed, combined with the reversal candlestick appearing at H4, the possibility of gold bouncing back to reach the resistance area of 3330, even 3350 is completely possible. In the weekend trading session, we will wait at the support zones to trade.
Important price zones today: 3280 - 3285 and 3269 - 3274.
Today's trading trend: BUY.
Recommended orders:
Plan 1: BUY XAUUSD zone 3283 - 3285
SL 3280
TP 3288 - 3300 - 3310 - 3330.
Plan 2: BUY XAUSD zone 3269 - 3271
SL 3266
TP 3274 - 3284 - 3300 - 3320.
Wish you a safe, favorable and profitable trading day.🥰🥰🥰🥰🥰

Gold Trading Strategy XAUUSD July 31, 2025Yesterday's trading session, after breaking the rising price channel in the 3318 - 3320 area, the gold price fell sharply to the 3269 area.
Basic news: US Treasury yields fell and the weak US labor market report could boost investor demand. Data released by the US Department of Labor on Tuesday showed that the number of new jobs fell in June after 2 consecutive months of increase. Today, the Federal Reserve will announce a new interest rate decision.
Technical analysis: The rising price channel in the H1 frame was broken, and the gold price immediately fell sharply. Currently, the downtrend of gold is still maintained. The MA lines are still resistance for gold prices.
Important price zones today: 3300 - 3305, 330 - 3325 and 3267 - 3272.
Today's trading trend: SELL.
Recommended orders:
Plan 1: SELL XAUUSD zone 3303 - 3305
SL 3308
TP 3300 - 3290 - 3280 - 3270.
Plan 2: SELL XAUUSD zone 3323 - 3325
SL 3328
TP 3320 - 3310 - 3290 - 3280.
Plan 3: BUY XAUUSD zone 3267 - 3269
SL 3264
TP 3272 - 3282 - 3292 - 3302 (small volume).
Wish you a safe, favorable and profitable trading day.🌟🌟🌟🌟🌟

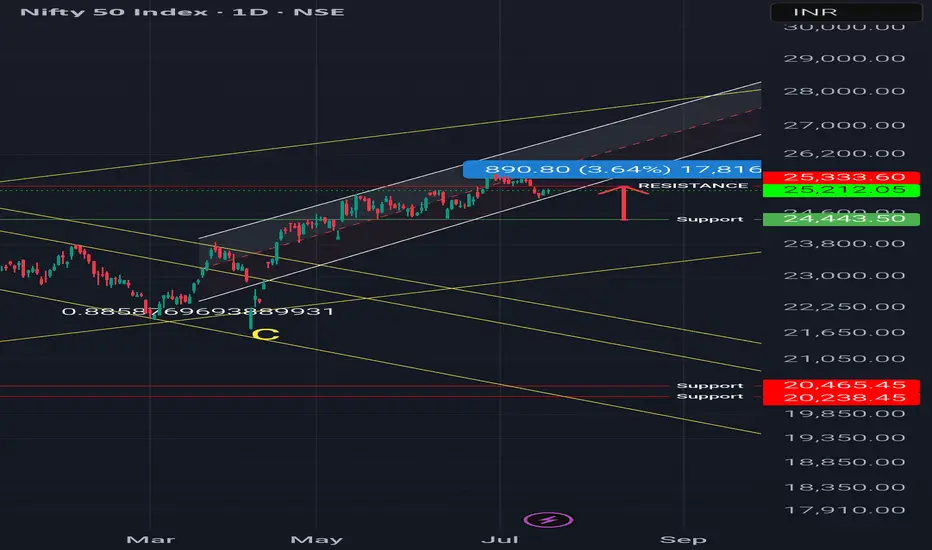
Regression channel & Harmonic pattern - Short term bearish trendObservations:
1. It is short term bearish trend as long as price holds above 24400
2. Price is below 50 DEMA
Possible Scenarios:
1. Price may attempt a mean reversion toward the median line of the channel
2. A break above could retest the 25,240–25,337 resistance zone, up move can only be considered when weekly candle will closed above that level because on weekly time frame there is 4 crows formation.
3. Harmonic patterns (1:1) suggests, the level of 24470 Support level in coming 10-15 trading days.
Nifty upcoming moveWe have clean equal lows at 24462 and OB below that, weekly. Market should heavily expand towards that and take it first before giving any real upside move that would sustain. until then, any move upside is only correction phase.
your views are welcome.

BREAK OUT GOLD On H1 frame, gold has signs of breakout, so pay attention to the support area 3342
XAUUSD BUY Zone: 3341 - 3343
Stoploss: 3337 (60pips)
Takeprofit: 3346 - 3350 - 3354

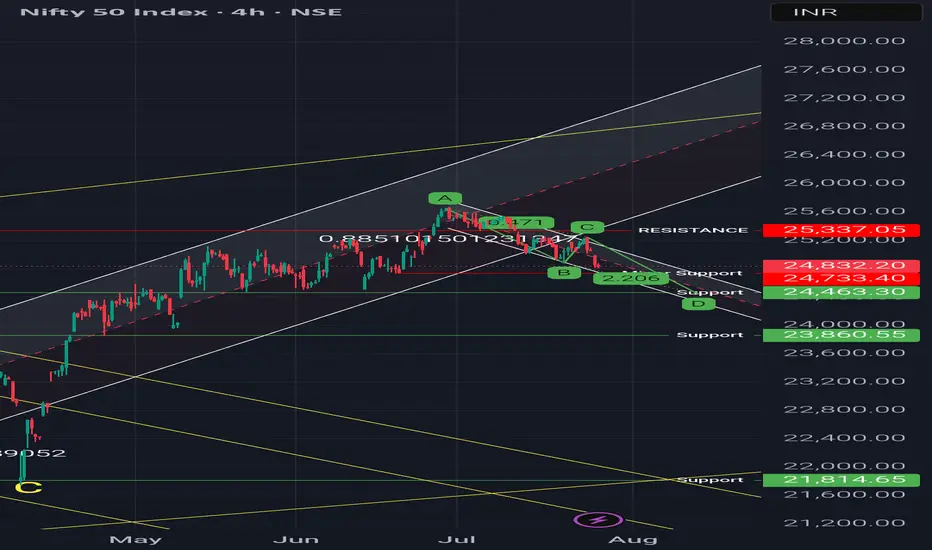
Nifty Outlook - Regression Channel 1. Confluence of regression channel + support/resistance = Trading Move expected in this week or next
2. Support at 24,443
3. Resistance is at 25300-350
If it crosses the resistance we will get to see the New High in Nifty.
XAUUSD Bullish Reversal from Channel Support | Gold Buy SetupAnalysis Overview:
Gold has been trading inside a clearly defined descending channel (marked by the orange trendlines). After a strong bearish move, price has reached the lower boundary of this channel, which is acting as dynamic support.
Key Technical Details:
Descending Channel Support: XAUUSD has tested the lower trendline multiple times and is currently showing rejection wicks, suggesting potential exhaustion of selling pressure.
Demand Zone: The shaded horizontal area represents a prior consolidation and minor support level that aligns with the channel bottom, adding strong confluence.
Entry: Planned buy entry at the current level near channel support, anticipating a bounce.
Stop Loss: Placed below the recent swing low and outside the channel, to allow room for volatility while protecting against continuation of the downtrend.
Target: The mid-to-upper boundary of the descending channel, aiming for a favorable risk-reward ratio.
Market Context: The higher timeframe trend remains bearish overall, so this is a short-term reversal (counter-trend) setup within the channel structure.
Trade Plan Rationale:
Expecting a corrective move upward within the descending channel as price retests previous supply zones and dynamic resistance. This setup is based on:
Confluence of channel support and demand zone
Multiple rejection wicks showing buyers stepping in
Potential mean reversion towards the channel midpoint
Disclaimer:
This is my personal analysis on XAUUSD and not financial advice. Always do your own research and manage risk carefully.

My nifty intraday trend analisys 27/06/2025Pattern: Nifty is forming a Bottleneck Pattern, which generally supports bullish continuation after a tight consolidation.
Today’s View:
Market may open near 25600
Can test 25625 (1st Resistance)
Then may jump to 25700 if consolidation sustains
Due to Bottleneck, major correction unlikely
📊 Sideways Area – Where is the Range?
✅ Sideways Range (Today)
👉 When Nifty is between resistance and support zones without breakout:
🔸 From 🔸 To 🔄 Status
25460 25625 📉 Sideways Zone
25460 = Immediate support
25625 = First major resistance
Between these levels, Nifty may consolidate to build momentum before breakout.
🔐 Key Levels (Support & Resistance)
Support Resistance
25460 (strong) 25625 (primary)
25389 (backup) 25700 (target)
25300 (fail-safe) 25789 (extreme)
🎯 Strategy Suggestion
Market Condition Action Strategy
In Sideways (25460–25625) Wait / Scalping Low risk trades
Breaks 25625 & sustains Buy (BOD) Target: 25700–25789
Breaks below 25460 Use SOR cautiously SL tight
📌 Trading Tips:
Use 1-hour candle body-to-body
Observe Volume + Price Action + 15min candle close for breakout confirmation.

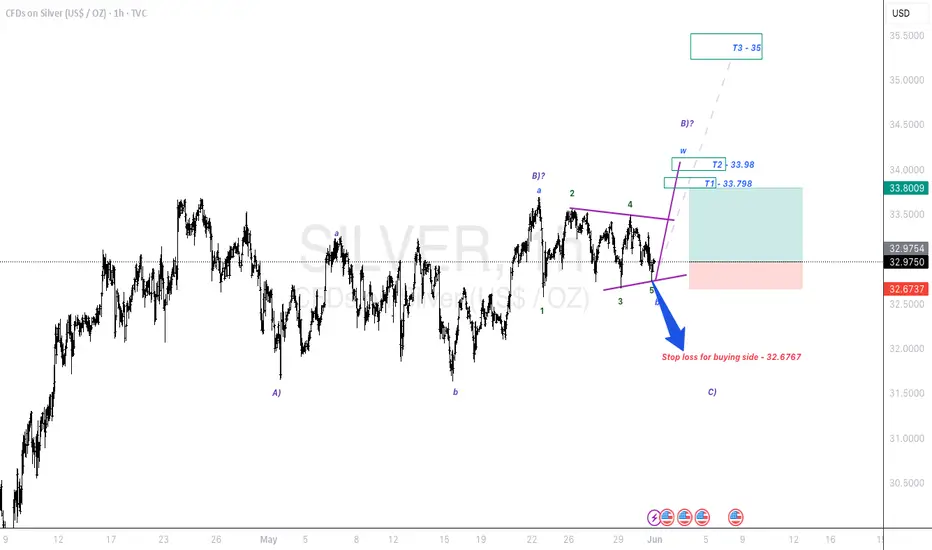
silver in triangle breakout. Two possibilities. one is impulisveElliott Wave Analysis:-
1st possibility:-
Silver is in a triangle breakout . if it is getting towards upside breakout then we have a nice opportunity of pullback and and we can add it if the pullback occurs. else we can enjoy this journey quietly.
2nd possibility:-
Silver had already made a pullback towards down side breakout. Once it start the way it will fly towards downside and then it will complete a C wave in whole B wave then upside C wave will be impulsive.
This type 2 will be discussed in next chart. I will post it as seperately chart for clear understanding .
I am not a SEBI registered advisor. Before taking a trade do your own analysis or consult a financial advisor. I share chart for education purpose only. I share my trade setup.
Technical Analysis Report: SMS Pharmaceuticals Ltd1. Bullish Flag with Pole (June–July 2024)
Bullish Flag with Pole: A continuation pattern formed after a strong upward price move (the pole), followed by a short-term consolidation (the flag), signaling the potential for another breakout upward.
Price Action: Strong impulsive rally formed the flagpole, followed by a tight consolidation forming the flag 🚩.
Breakout: Confirmed with a high-volume breakout to the upside.
Target: Achieved a massive 40% gain in under a month.
Analysis: A textbook bullish continuation pattern; traders capitalized on early entry post-breakout.
2. Distribution Phase (August–October 2024)
Distribution Phase: A sideways trading range after an uptrend where smart money or institutions start offloading their holdings. Typically a precursor to a market reversal or downtrend.
Market Structure: After the sharp uptrend, price entered into a horizontal range.
Phase Characteristics: Low volatility, repeated rejections at resistance, high volume on down days—signs of distribution.
Interpretation: Institutions likely booking profits, signaling a potential trend reversal.
Trader Sentiment: Shifted from bullish to neutral/bearish.
3. Triple Top Formation (Within Distribution Phase)
Triple Top Pattern: A bearish reversal pattern marked by three failed attempts to break above a resistance level, indicating weakening momentum and a potential downtrend.
Resistance Level: Same peak tested three times without breaking.
Breakdown: Confirmed after the third top with a decisive drop.
Target: Achieved a "30% downside" move via "short selling", all within a month.
Insight: Classic reversal pattern, effectively timed with distribution.
4. Bearish Flag with Pole (During Triple Top Breakdown)
Bearish Flag with Pole: A continuation pattern during a downtrend. It starts with a sharp decline (pole), followed by a minor upward consolidation (flag), suggesting further downside.
Formation: Sharp decline (pole) followed by a brief upward consolidation (flag).
Breakdown: Continuation to the downside, achieving projected target.
Target: Fully achieved within the same downtrend cycle.
Conclusion: Reinforced the bearish sentiment and amplified the down move.
---
5. Accumulation Phase + Triple Bottom (December 2024–April 2025)
Accumulation Phase: A market phase where a stock trades in a range after a downtrend, as buyers (often smart money) gradually build positions, typically leading to a bullish reversal.
A Triple Bottom is a bullish reversal chart pattern that forms after a downtrend, marked by three equal lows indicating strong support and a potential trend reversal to the upside.
Phase: 5-month Accumulation Phase
Pattern: Triple Bottom during this period indicated strong support and buyer presence.
Breakout: Occurred with a bullish breakout post third bottom.
Target: 20% upside achieved within a month post-breakout.
Observation: Long-term investors and smart money potentially entering positions.
6. Rounding Bottom in Progress (May 2025)
Pattern: Rounding Bottom (Still Forming)
Current Price Action: Gradual curve formation with decreasing volume on the left and increasing volume near the neckline— a bullish sign.
Expectation: Anticipated upside breakout in the coming days.
Outlook: If confirmed, this could mark the start of a new bullish cycle.
📌 Summary:
SMS Pharmaceuticals Ltd. has shown a textbook series of technical patterns—from trend continuations to reversals, distribution to accumulation, and now a potential new uptrend. Each phase was actionable, with clear breakout/breakdown points and well-achieved targets.

Long Correction is expected to take place in INDRAPRASATH GAS!Elliott Wave Analysis:-
In Correction wave a) wave took place and for retracement b) wave and still a little more correction was pending it seems to be. and the fall is expected from there.
i am not a SEBI registered advisor.
Before taking a trade do your own analysis or consult a financial advisor.
I share chart for education purpose only. I share my trade setup.

Trendline BreakoutA trendline breakout occurs when the price of an asset moves decisievly above a downward- sloping trendline, potentially signalling a change in the prevaling trend.
Entry at around 190
with stop loss of 180 we can target 207 one it closes above 196.

YES BANK ENTERED IN 2ND ZONE (BUYING ZONE)Yes bank has entered in 2nd zone or buying zone.
this analysis is simple Support and Resistance monthly analysis.
I just marked lines from 2020 to 2025 they are important high lows .
improtant high lows are 5, 10, 20, 24, 30, 32,
yes bank currently trading on 21 rs . according to my analysis nxt target could be 24 to 30 rs in this year.
