Aditya Birla Capital – Demand Zone📌 Demand Zone:
Demand Zone High: 350.80
Demand Zone Low: 344.40
The stock has triggered a clean 52-week breakout supported by a sharp MACD crossover and strong expansion through the Bollinger bands, signaling fresh momentum entering the structure. The recent wide-range green candle reflects decisive buyer dominance, supported by improving volumes and a steady higher-low sequence that kept the broader trend intact even during consolidation. Momentum indicators such as RSI, CCI, and Stochastics all remain in strong territory, confirming that buyers are still in control despite the price being stretched in the short term. The small demand zone between 353.80–347.95 acts as the immediate retest pocket where institutional flows can re-enter if the stock pulls back. EMA compression has fully expanded, relative strength vs the index has turned positive, and overall the price structure indicates a momentum-driven continuation setup with a favourable trend, strong buying pressure, and stable risk levels as long as the stock holds above the newly formed demand zone.
________________________________________
⚠️ STWP Legal Disclaimer (SEBI-Compliant)
This document is strictly for educational and informational purposes. All examples, charts, levels, and option structures discussed are illustrative and are not intended as buy, sell, or hold recommendations. STWP does not provide investment advice, trading tips, signals, or personalized financial guidance of any kind, nor is it a SEBI-registered intermediary or research analyst. The analyses, illustrations, and risk–reward structures included here are generic in nature and based on publicly available data and observed market behaviour, which may change without notice. Financial markets involve significant risk; derivatives in particular carry the potential for substantial losses. Option premiums, implied volatility, open interest, delta, and other market variables can fluctuate rapidly and unpredictably.
Readers are solely responsible for their trading decisions, capital management, and risk assessment. Before making any investment or trading decision, please consult a SEBI-registered investment advisor. STWP, its representatives, and affiliates shall not be liable for any direct or indirect loss arising from the use of this material. Historical patterns or past market behaviour do not guarantee future outcomes. Nothing in this document should be interpreted as a promise of performance, accuracy, or returns.
Position Status: No active position in ABCAPITAL at the time of analysis.
Data Source: TradingView & NSE India (Past Chart Reference for any charts used).
________________________________________
Abcapital_analyais

Aditya Birla Capital | Bullish Momentum with Exceptional Volume 💹 Aditya Birla Capital Ltd (NSE: ABCAPITAL)
Sector: Financial Services | CMP: ₹326.80 | View: Bullish Continuation Setup
📊 Price Action:
Aditya Birla Capital witnessed a bullish breakout from a tight consolidation range, confirming renewed buying interest.
Price action shows strong momentum as the stock reclaimed short-term resistance with conviction.
Sustaining above 325 can open the path toward 340–347 in the short term, supported by high-volume expansion.
💼 HNI Trade Levels (STWP Setup):
Aggressive Entry: 326.80–328.81 | Stop Loss: 310.58
Low-Risk Entry: 323.14 | Stop Loss: 305.51
HNI and institutional traders have shown clear accumulation interest backed by strong volumes.
The bullish structure with expanding range candles indicates smart money positioning early into the trend.
Momentum continuation is likely as long as price sustains above 314–316 support.
📉 VCP Analysis:
Aditya Birla Capital displays a classic Volatility Contraction Pattern, tightening across the last few weeks before the breakout.
Today’s 20-day volume breakout confirms the end of contraction and the beginning of a volatility expansion phase.
The setup indicates strong institutional intent aligning with the final stage of the VCP breakout.
📈 STWP Trading Analysis:
Entry: 328.80 | Stop Loss: 310.58
Strong bullish candle supported by a 5x surge in volume highlights aggressive participation.
The trend structure remains positive with a series of higher highs and higher lows.
Holding above 320 will keep the bias firmly bullish and validate the ongoing uptrend.
📏 Fibonacci Analysis:
The Fibonacci retracement from the recent swing low at 269.84 to swing high at 350.50 places the price near the 38.2% zone, maintaining a healthy correction within trend.
Holding above 314–316 (23.6%) keeps the pattern intact and supports trend continuation.
A breakout above 333.87 (resistance 1) could drive a move toward 347–353, aligning with the Fibonacci extension projections.
🧭 STWP Support & Resistance:
Resistances: 333.87 | 340.93 | 353.07
Supports: 314.67 | 302.53 | 295.47
While resistance zones near 333–353 may face mild supply, supports between 302–314 appear strong with institutional defense.
Major demand zones are visible near 283–295, confirming deep accumulation pockets.
The setup structure remains bullish with strong support and relatively weak resistance above 333.
📊 STWP Volume & Technical Setup:
Today’s session recorded exceptional volume at 27.94M vs 5.43M average, a 5.14x surge, confirming institutional activity.
The yellow label highlights multiple confirmations — bullish engulfing candle, RSI breakout, and Bollinger Band expansion, signaling volatility release from compression.
Indicators like MACD and Stochastic remain bullish across daily to weekly timeframes, strengthening the continuation outlook.
🧩 STWP Summary View:
Final Outlook:
Momentum: Strong | Trend: Bullish | Risk: Moderate | Volume: High
Aditya Birla Capital is showing a strong technical structure with institutional footprints, rising volumes, and momentum confirmation.
Sustaining above 320 keeps risk controlled, while a decisive move above 333 could accelerate momentum toward higher resistance zones.
The bias remains bullish with trend continuation potential in the near term.
⚠️ Disclosure & Disclaimer – Please Read Carefully
The information shared here is meant purely for learning and awareness. It is not a buy or sell recommendation and should not be taken as investment advice.
I am not a SEBI-registered investment adviser, and all views expressed are based on personal study, chart patterns, and publicly available market data.
Trading—whether in stocks or options—carries risk. Markets can move unexpectedly, and losses can sometimes exceed the money you have invested.
Past performance or past setups do not guarantee future results. Always assess your risk, position sizing, and strategy suitability before entering trades.
Consult a SEBI-registered financial adviser before making any real trading decision.
Position Status: No active position in (ABCAPITAL) at the time of analysis.
Data Source: TradingView & NSE India (Past Chart Reference)
💬 Found this useful?
🔼 Give this post a Boost to help more traders discover structured learning.
✍️ Drop your thoughts, questions, or setups in the comments — let’s grow together!
🔁 Share with fellow traders and beginners to spread awareness.
👉 “If you liked this breakdown, follow for more clean, structured setups with discipline at the core.”
🚀 Stay Calm. Stay Clean. Trade With Patience.
Trade Smart | Learn Zones | Be Self-Reliant 📊

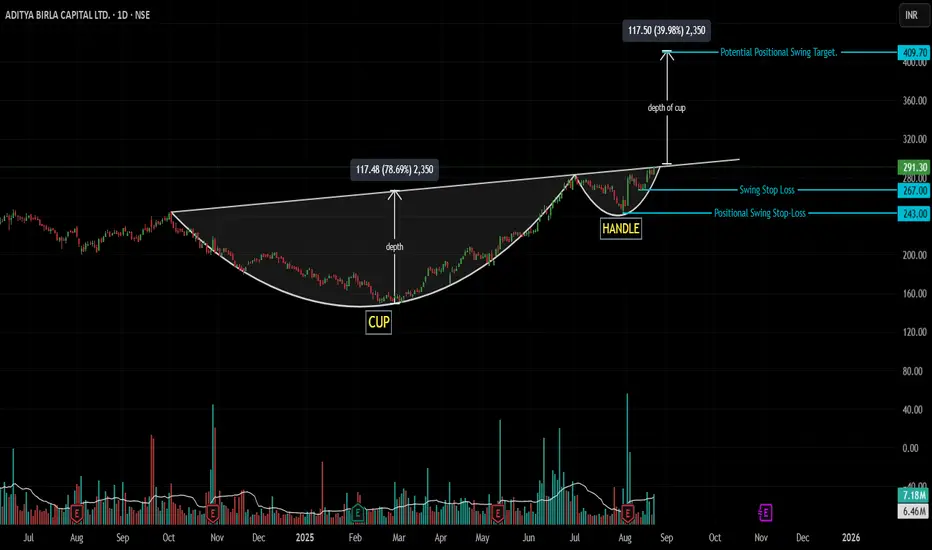
Volcanic Cup & Handle Breakout Imminent! (Swing/Positional)Script: NSE:ABCAPITAL | Timeframe: Daily | Pattern: Cup and Handle | Idea: Swing/Positional
Idea Analysis:
Aditya Birla Capital is demonstrating exceptional strength! After a brilliant bullish run that defined the right side of its Cup, the stock is now completing a bullish consolidation and is primed for its next major breakout.
The Powerful Run: The stock exhibited explosive momentum as it rounded off the bottom of its Cup, rallying powerfully from its lows to re-test the key resistance near ₹290. This strong impulse move is a clear sign of dominant buying interest.
The Short Rest: Following every strong run comes a period of rest. Since its peak, the price has been forming the Handle of a large Cup & Handle pattern. This isn't a sign of weakness, but a healthy bullish consolidation—a catch of breath where the stock digests its previous gains.
The Next Leg: This handle has now tightened sufficiently, bringing volatility to a contraction point. The stock is coiling at the handle's upper trendline, suggesting the "short rest" may be over. A breakout would signal the beginning of the next leg up in the larger bullish narrative.
Why This Looks Bullish:
Strong Momentum: The prior run proves there are strong buyers in this stock.
Constructive Action: The handle is a classic bullish continuation pattern or VCP (Volatility Contraction Pattern)
Volume Confirmation: A breakout with high volume will confirm the resumption of the uptrend.
Trade Strategy:
For Both Swing & Positional Traders:
Entry: On the closing of a candle that breaks above the trendline. The ideal candle is thick and green with minimal upper wick, confirming the end of the rest period.
Stop Loss (SL): Low of the breakout candle or ₹267 (Placed below the very recent low).
Stop Loss (SL) (Positional): ~₹243 (Low of the handle's low)
Target 1 (Swing): Initial Risk-to-Reward 1:2. Trail stops after.
Potential Long-term Target : ~₹410 (2-3 months horizon)
Key Levels:
Pattern Breakout: Above the trendline.
Major Support/Stop Level: ₹243
Positional Target (Pattern Projection): ₹400/410
⚠️ Disclaimer:
This post is for educational purposes only and does not constitute financial advice. Trading stocks involves substantial risk of loss and is not suitable for every investor. The price targets and levels are hypothetical projections based on technical analysis and are not a guarantee of future performance. Always conduct your own research and consider your risk tolerance before making any investment decisions.
👍 If you agree with this analysis, please give it a Boost!
💬 Which stock would you like to see featured in the next technical breakdown? Let me know in the comments!
ABCapital’s Daily Retest: Bullish Bounce IncomingOn the Daily timeframe, price is revisiting the ₹244–₹248 zone, which had capped rallies three times before the breakout on 17 June 2025. After carving out a classic rounding bottom, ABCapital surged—now it’s offering a second chance to enter:
- Zone to Watch: ₹244–₹248 (prior resistance → new support)
- Timeframe: Daily
- Trend: Strongly bullish in both short and long term
- Upcoming Catalyst: Q2FY26 earnings on 4 August 2025
- Entry Strategy:
1. Look for bullish price action (pin‑bar, bullish engulfing, etc.) on daily candles
2. Verify with a volume pickup on the bounce before initiating a long 👍
Why It Works
- Daily retests of former resistance zones often lead to reliable bounces
- Rounding bottom reflects deep accumulation by smart money
- Daily trend remains intact until broken with conviction
Risk Management
• Stop‑loss just below ₹242
• Trail stops higher as price confirms strength
Targets
- Short‑term: ₹260
- Long‑term: ₹280+ and keep trailing.
🚀 A textbook daily‑timeframe retest in a powerful uptrend—perfect for fresh entries or scaling in.
Disclaimer: This is not financial advice. Conduct your own due diligence and manage risk prudently.
If this resonates, 👍 Boost, 💬 Comment, and 📝 Share your take!
❓ Got another stock in mind? Feel free to ask me which ticker you’d like analyzed next!
Ask ChatGPT

A B CAPITAL : Unfolding one more opportunityStock trying hard to consolidate and go up
But as we can see there lies an opportunity on the upside with Drop - Base - Drop range (168 - 172)
If stock reaches and pauses in the above mentioned area, It may be possibly give an sell opportunity in Lower Time Frame
Keep an eye
Sl will be above 175
Targets on the downside can be expected up to 150
Advance alerts and preparation gives sufficient time to prepare entry with peace of mind

ABCAPITAL - Ready to take a U TurnStock currently standing at psychological round figure level resistance of 200
Previous 3 times this level has acted as a strong support
So possibly this time it may act as a strong hurdle
View negates below 204
If not then stick can again test 180 levels quickly

ABCAPITAL: Potential Short Setup with Key LevelsStock Name: ABCAPITAL
Entry Point: Considering a short position if the price breaks below today's low, supported by strong open interest (OI).
Stop-Loss (SL): Placed above candle high to control risk effectively.
Target: Near the next key support level or adjusted based on real-time price movement.
Disclaimer:
This analysis is shared purely for educational purposes and is not a recommendation to trade. Please perform your own research and consult a financial advisor before making any investment decisions.

AB Capital ready to rock!Easy Reading, Above Monthly 254 Close it can give a good momentum for the levels highlighted in chart. Accumulate for 2 years minimum.

Bullish Breakout: ABCAPITAL Poised for Upside Towards 260Details:
Asset: Aditya Birla Capital Limited (ABCAPITAL)
Breakout Level: Above recent resistance, indicating bullish sentiment
Potential Target: 260
Stop Loss: Below breakout level or as per risk tolerance
Timeframe: Short to medium-term
Rationale: Aditya Birla Capital Limited (ABCAPITAL) has recently experienced a breakout above a key resistance level, suggesting a shift in sentiment towards bullishness. This breakout indicates potential upward momentum, with the stock poised for a move towards the 260 mark.
Market Analysis:
Technical Breakout: ABCAPITAL's breakout above resistance signifies increased buying interest and the potential for further upside movement.
Market Sentiment: Positive market sentiment or company-specific factors may be contributing to the bullish outlook for ABCAPITAL.
Price Target:
ABCAPITAL's breakout suggests a target price of 260, representing potential upside from the breakout level.
Risk Management:
Implementing a stop loss strategy below the breakout level can help manage risk in case of adverse price movements.
Timeframe:
The projected target of 260 is based on a short to medium-term outlook, but actual timing may vary depending on market conditions and catalysts.
Risk-Reward Ratio: Consider individual risk tolerance and adjust position size accordingly to achieve a favorable risk-reward ratio.
As always, conduct thorough analysis and consider factors such as market trends, company fundamentals, and risk management strategies before making investment decisions.

ABCAPITAL Analysis and Prediction in DTFThis is the analysis of ABCAPITAL in Daily Time Frame. Watch carefully. The chart explains itself.
There are some prediction levels. These Levels act as Support and Resistance according to position of price. You have to trade according to level breakout or breakdown.
Always maintain your risk management.
Book your profit according to your “STOMACH”.
Disclaimer:
This is not investment advice. I am not a SEBI Registered Analyst. Anything posted here is my own analysis and views. This is created for educational purposes only. Always consult your Financial Advisor before taking any decision or trade.
Happy trading.
About ABCAPITAL:
Aditya Birla Capital Ltd. engages in the provision of financial services. It operates through the following segments: NBFC, Housing Finance, Life Insurance, Asset Management, General Insurance Broking, Stock and Securities Broking, Health Insurance, and Other Financial Services. The company was founded on October 15, 2007 and is headquartered in Mumbai, India.

Aditya Birla CapitalAditya Birla Capital or AB CAPITAL Ready to move after long time Falling Pattern Channnel Giving Breakout with Retd For Swing & Long Term Investing

ABCAPITAL 1D TF LONGCan go for long if it closes above 180-181 range and indices also should give confirmation.
Please follow me for more such trades.

ABCAPITALNSE:ABCAPITAL CMP: 157.7
SL: 131
Initial Target: 255(ATH)
If holds and crosses, 248 then target 280(as per pattern).
RR(For first target): 3.5:1 (for target 255). Beyond that it improves
Reason:
1 - Finance Service index looks good.
2 - Stock looks like breaking out of Inverted H&S Pattern.
3 - Above all moving averages on Daily and Weekly
4 - RSI is above 50 and looking good.
5 - MACD looks positive.
6 - RS is +ve.
Note - Notice the right shoulder is not as low as the left shoulder. Again, just the reverse of the regular head and shoulders pattern where the right shoulder was not as high as the left, indicating weakness. But in this case the right shoulder is not as low as the left, and this is indicating strength. It's a bullish continuation Inverted H&S Pattern.
Fundamentally also, this stock looks good. I'm not going into the fine prints of fundamentals of this entity in this post.
Disclaimer: The buy and sell recommendations provided in this report are for informational purposes only and do not constitute financial advice. The information contained in this report has been obtained from sources believed to be reliable, but its accuracy and completeness cannot be guaranteed. Any opinions expressed in this report are subject to change without notice.
Trading stocks involves substantial risk, including the loss of all or a portion of your investment. Before making any investment decisions, you should carefully consider your financial objectives, risk tolerance, and financial situation, and consult with a financial advisor if necessary.
The information and recommendations provided in this report are not intended to be used as the sole basis for making investment decisions. You should conduct your own research and analysis, and consult with a financial advisor before making any investment decisions.
The author and publisher of this report are not responsible for any losses or damages arising from the use of this information. By accessing this report, you agree to hold the author and publisher harmless from any losses or damages arising from the use of this information.
Additionally, I welcome any corrections or feedback on this analysis. Please feel free to share your thoughts and perspectives in the comments section.
I hope this helps, and best of luck with your technical analysis!

ABC Capital - Expecting Good movementAn investment company with more than 70 % promoter holding.Deliverig good profits over continuous years. Now its near its 52 week high. Expecting a good movement if it crosses 160 levels

ABCAPITAL Bullish view Target 170ABCAPITAL Bullish view Target 170
Few day chance to rangebound after breakout range stock in bullish range

Flag and pole in the makingabcapital can be bought once it breaks the pole line. can buy above 159 for 10% targets.


ABCAPITAL - Ichimoku Bullish Breakout Stock Name - Aditya Birla Capital Ltd
Ichimoku Cloud Setup :
1). Today's close is above the Conversion Line
2). Future Kumo is Turning Bullish
3). Chikou span is slanting upwards
All these parameters are showing bullishness at Current Market Price
and more bullishness AFTER crossing 140
#This is not Buy and Sell recommendation to any one. This is for education purpose and a helping hand to learn trading in Market.
# Cloud Trading
# Ichimoku Cloud
# Ichimoku Followers
I hope you all like my analysis.
Please do share your thoughts into comment section.
Please give a like, share & subscribe for daily analysis.

ABCAPITAL - BULLISHDate - 25/04/2022
ABCAPITAL
It is taking support at 100 EMA , now it has formed kind of MORNING STAR candle. Thus, there is probability of moving upward.
CMP - 115.75
TGT - 119.50,127.50,136.50
SL - 107.50
Disclaimer : - This video is for EDUCATION PURPOSE only. If anybody is taking position based on this video he/she will be self responsible for their Profit or losses. I am not a SEBI registered analyst or advisor.

AB CAPITAL Has Completed An 8-Month-Old Correction.According to the Elliott wave principle, AB capital has finished the corrective wave ((iv)).
Price carrying on the impulsive wave (v), yet traders shouldn’t take the position without a proper signal.
If the price breaks wave (X) , the price will surely make a new high because it will give evidence of the impulsive move.
Price may take retracement as wave x works as a resistance which can be the best entry for bull traders.
We can see the following targets:
127.70
138.96
151.2
165.9+
Invalidation: breakout of the minor channel.

TRENDLINE BRAEKOUT IN ABCAPITAL In chart as you can see previously trendline which I have drawn as a channel there in chart has acted as a strong trendline resistance, price got pushed down every time it touched the zone/trendline/resistance channel. A Strong Breakout with such huge/unusual volume can be seen in chart and also breakage in (Lower Low) LL- (Higher High) LH cycle, can be a good pick for medium term or for like 5-8 weeks. Can be bought here at these current levels or else go for buy on dip till 112-113 level for the given targets in the chart with strict Stop-Loss of 110 level (candle closing below basis only) . Consider booking partial profits at/near/around given targets.
ABOVE POSITION/ENTRY IS SUGGESTED ON THE BASIS OF DESCENDING TRENDLINE BREAKOUT. TAKE THIS STUDY AS A EDUCATION, DO YOUR ANALYSIS BEFORE TAKING/ENTERING INTO THE TRADE.
THIS VIEW OF MINE IS PURELY BASED ON TECHNIAL CHART AND FOR EDUCATIONAL PURPOSE ONLY, BEWARE OF NEWS AND OTHER FACTORS WHICH CAN AFFECT THE MARKET SENTIMENT OR ANY PARTICULAR STOCK/SECURITY.

ABCAPITAL : Positional Buy Trade SetupNSE:ABCAPITAL
Hi Traders,
ABCAPITAL trade setup, entry and target level on chart.
**********************************************************************************************************************************
If it is helpful for you, please show your support and hit the LIKE button.
Provide some feedback below in the comment!
This would give us encouragement to keep sharing our ideas here on this platform.
###Learn To Earn###
* This analysis is educational/learning purpose only.
* Trade at your own risk.
Trade well,
**********************************************************************************************************************************

ABCAPITAL -Upswing BuyABCAPITAL IS underperforming since March .Gave a downside move of 30% from March Highs. There is trendline breakout possible .So, consider it buying and keep this stock for midterm swing. Short-term swing can be done for 10-20%.
Buy-Above 119
Sl-110
Target- 130 140 170
