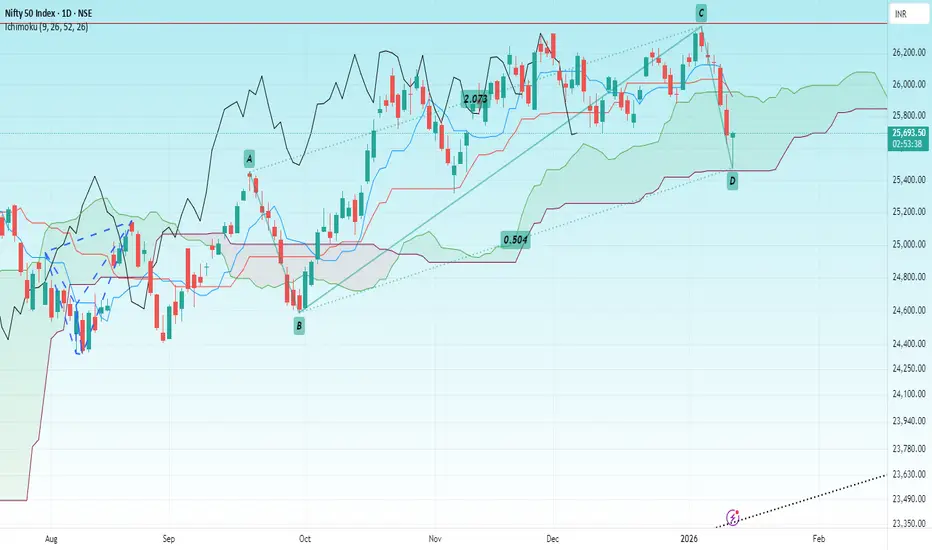
NIFTYHello & welcome to this analysis
Nifty has made a Bullish Harmonic Reciprocal ABCD pattern that coincides with Ichimoku Kumo support
If it sustains above 25650 then a bounce/reversal can be expected till 25800 / 26000 for now.
The view will go wrong below 25375
All the best
Abcdchartpattern
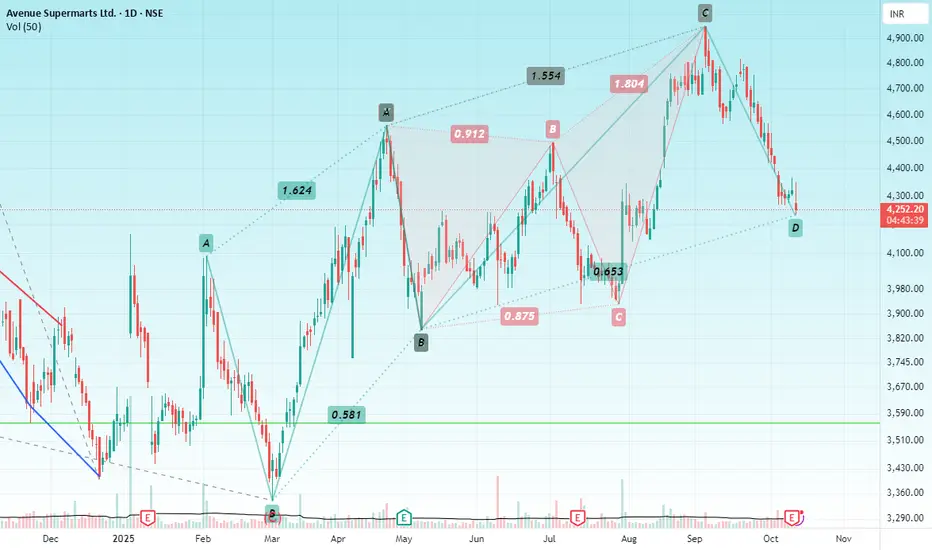
DMARTHello & welcome to this analysis
DMART has usually reversed regularly from Harmonic Patterns as can be seen in this chart in daily time from a
Bullish Reciprocal ABCD
to a
Bearish Deep Crab
to now forming a
Bullish Reciprocal ABCD
If it sustains above 4200 then it could give a probable bounce/reversal to 4400 & 4550 indicating a good risk : reward ratio
All the best
PUNJAB NATIONAL BANKHello & welcome to this analysis
In July 2025 it activated a bearish Harmonic Butterfly pattern at 115 that lead to its current decline at 38 Fibonacci of its rally.
Going forward it could continue to decline till 100 where it would likely form two bullish Harmonic patterns - Shark & ABCD around the 50 Fibonacci retracement.
It has resistance now between 110 - 108 from where it fell with heavy volumes couple of days back.
All the best
Regards

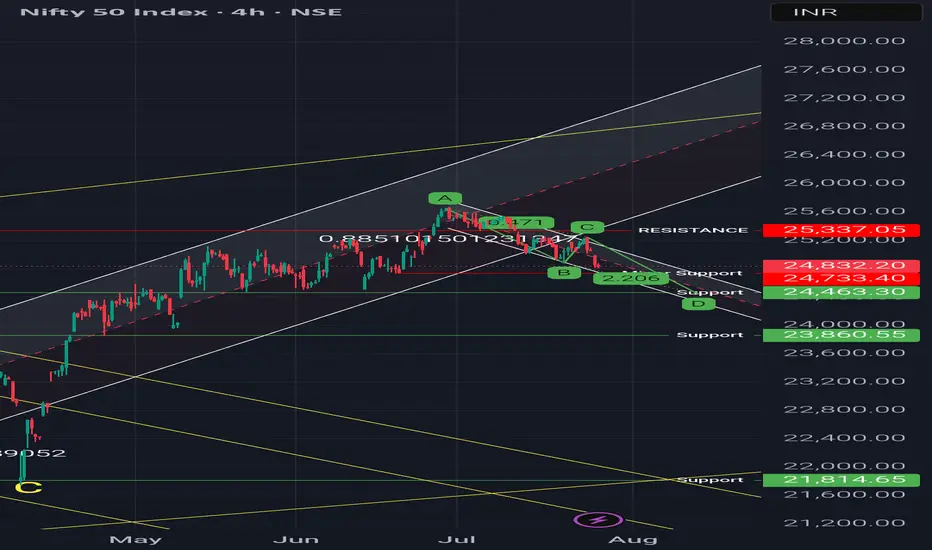
Regression channel & Harmonic pattern - Short term bearish trendObservations:
1. It is short term bearish trend as long as price holds above 24400
2. Price is below 50 DEMA
Possible Scenarios:
1. Price may attempt a mean reversion toward the median line of the channel
2. A break above could retest the 25,240–25,337 resistance zone, up move can only be considered when weekly candle will closed above that level because on weekly time frame there is 4 crows formation.
3. Harmonic patterns (1:1) suggests, the level of 24470 Support level in coming 10-15 trading days.
MAX FINANCIAL SERVICES LTDHello & welcome to this analysis
The stock has entered the potential reversal zone (PRZ) in monthly time frame of double bearish harmonic patterns - ABCD & Deep Crab. The probable zone is between 1460 - 1500.
Since this is a monthly time frame pattern a bearish derivative trade would be risky as it could firstly take a lot of time to reverse after distribution and secondly the stop loss for the trade would be very high since the range is big.
This signal should be initially be taken as an alert not to attempt a fresh long at the current level and wait for some weekly to daily time frame weak signals to take a short trade if it reverses for 1300-1200.
The pattern would become invalid above 1600. The acceleration for downside would happen once it starts sustaining below 1400 (as of now), this will keep changing week on week till the pattern is valid.

USD INRHello & welcome to this analysis
USDINR topped out on 10th Feb @ 88 to see a sharp reversal all the way till 4th April when it formed a bullish Harmonic Deep Crab pattern @ 85 that too lead to a more sharper bounce back till 9th April when it formed a bearish Harmonic Reciprocal ABCD pattern near the top end of the slanting channel.
From there we have witnessed yet another steep downward move which is currently resting at the lower end of the slanting channel. Failure to hold 84.45 - 84.35 could lead to a further downward move till 83.70 where it would attempt to form a bullish Harmonic ABCD pattern that could coincide with DXY bullish harmonic pattern near 95.
So if you have exposure to currency for any reasons whatsoever - overseas trips, college fees, business, commodities trading, etc - this might be of help to you.
Disclaimer - Not a trading advise, kindly do your study carefully before taking a decision

DOMS - ABCD Pattern, Crossing Swing Highs.NSE:DOMS Crossing Swing Highs with Strong Candles With RSI and MACD Trending Upwards and according to ABCD Pattern it's Likely to Cross ATH in Short Term.
About:
Incorporated in 2006, NSE:DOMS is a stationery and art product company primarily engaged in designing, developing, manufacturing, and selling a wide range of these products under the flagship brand, NSE:DOMS is the 2nd largest player in India’s branded 'stationery and art' products market. It held 29% and 30% market share for its core products in FY23 for pencils and mathematical instrument boxes.
Trade Setup:
A Swing Trade Can be Done as per the ABCD Pattern and Bullish Price Action. Keep Position Size as Per Appetite.
Target (Take Profit):
Near ATH Levels of 3115
Stop Loss:
Entry Candle Low for Aggressive Swing Traders and Swing Low in General.
📌Thank you for exploring my idea! I hope you found it valuable.
🙏FLLOW for more
👍BOOST if useful
✍️COMMENT Below your views.
Meanwhile, check out my other stock ideas on the right side until this trade is activated. I would love your feedback.
Disclaimer: "I am not SEBI REGISTERED RESEARCH ANALYST AND INVESTMENT ADVISER."
This analysis is intended solely for informational and educational purposes only and should not be interpreted as financial advice. It is advisable to consult a qualified financial advisor or conduct thorough research before making investment decisions.

JUBLFOOD an interesting ABCD pattern under formation Jubilant FoodWorks Ltd. is an interesting stock with following :
1. RSI on all time frames DWM above 60
2. Big anchor Green Candle on daily chart with high volume at weekly close
3. ABCD Pattern under formation on weekly chart
4. Major cluster of supports as under:
20 SMA (daily) 634
50 EMA (daily) 629
20 SMA (Weekly) 634
200 SMA (daily) 584
Lets See How it progresses from here further
Lets See How it Evolves.
Disclaimer: NOT A BUY / SELL RECOMMENDATION I am not an expert I just share interesting charts here for educational purpose and not to be taken as buy/sell recommendation. Please seek expert opinion before investing and trading as trading/ investing in market is subject to market risks. I do not hold any position in the stock as on date but I may look to take some position with my own Risk Reward matrix.

Chambal Fertiliser a 6 month consolidation will it breakout ?Chambal Fertilisers and Chemicals Ltd. is another interesting chart to keep on radar with following
1. RSI on all time frames (DWM) is at or above 60
2. Narrowing Bollinger Bands on daily chart with price walking on upper band
3. ABCD pattern under formation on weekly chart with fib-extension targets of 639-694
4. 6 month long consolidation on daily chart within channel of 440-530 zone
5. Major Supports are as under:
20 SMA (weekly) 491
20 SMA (Daily) 478
50 EMA (Daily) 483
With cluster of supports in area of 478-492 lets see if it breaks out of its consolidation or continues its consolidation
Lets See How it Evolves.
Disclaimer: NOT A BUY / SELL RECOMMENDATION I am not an expert I just share interesting charts here for educational purpose and not to be taken as buy/sell recommendation. Please seek expert opinion before investing and trading as trading/ investing in market is subject to market risks. I do not hold any position in the stock as on date but I may look to take some position with my own Risk Reward matrix.

ZOMATO A CHANNEL CONSOLIDATION WILL IT BREAKOUT OR FIZZLE OUT ?Zomato Ltd. is an interesting chart in momentum with following
1. RSI on all time frames (D/W/M) above 60
2. Narrowing Bollinger Bands on daily chart with price walking near Upper Band
3. Four months long consolidation in range of 240 to 295 zone
4. ABCD pattern under formation on weekly chart
5. Major Price Supports as under:
20 SMA (daily ) 263
50 EMA (daily ) 264
20 SMA (weekly) 261
with cluster of supports in range of 260-264 can be a good risk reward trade. Fibonacci projection tool projects targets of 333 and 358 Lets see if it sustains the trend or fizzles out
Lets See How it Evolves.
Disclaimer: NOT A BUY / SELL RECOMMENDATION I am not an expert I just share interesting charts here for educational purpose and not to be taken as buy/sell recommendation. Please seek expert opinion before investing and trading as trading/ investing in market is subject to market risks. I do not hold any position in the stock as on date but I may look to take some position with my own Risk Reward matrix.

DIVISLAB - CHANNEL CONSOLIDATION -WILL IT BREAKOUT OR NOTDivi's Laboratories Ltd. is an interesting chart with following
1. RSI on all time frames (i.e. D/W/M) above 60
2. Narrowing Bollinger Bands on daily chart with price walking on upper band
3. Two month's long consolidation of price in rectangular range of 5675 to 6300 levels and once price breaks out of this range, momentum will increase
4. ABCD pattern under formation on weekly chart
5. Major price supports at 5930 i.e. 20 Day SMA and 5750 i.e. 50 EMA respectively
Breakout of 6300 + levels on closing basis can fetch 6700 + and 6980 levels as per Fibonacci projection tool
Lets see How it evolves
Disclaimer: NOT A BUY / SELL RECOMMENDATION I am not an expert I just share interesting charts here for educational purpose and not to be taken as buy/sell recommendation. Please seek expert opinion before investing and trading as trading/ investing in market is subject to market risks. I do not hold any position in the stock as on date but I may look to take some position with my own Risk Reward matrix.

Life Insurance Corporation of IndiaHello & welcome to this analysis
Stock has been very turbulant since its listing.
Initially a sharp disappointment for IPO investors and then a super duper rally from lows giving investors a 100% return.
However in the last few weeks its gone into a sideways zone.
Resistance at 1000-1050 with support at 850-800
Good stock to accumulate if 800 holds for decent upside

Dollar IndexHello and welcome to this analysis
With FED all set to start the rate cut cycle from today's FOMC meet, DXY is expected to enter the potential reversal zone (PRZ) of not one but two bullish Harmonic patterns, namely, bullish AB=CD and bullish Crab, likely forming a triple bottom in the weekly time frame.
The PRZ is between 100 - 99.60 while the patterns would be considered invalid below 99.50, for a possible bounce (if not reversal) till 103.
When will it enter the PRZ by? Will depend totally on hawkish/dovish, FED Chairman Jeremy Powell is in his statement today.
Regards

TILAKNAGAR INDUSTRIES- 3 MHTS BREAKOUT WILL IT SUSTAIN ?Tilaknagar Industries Ltd. is an interesting Breakout on weekly chart to keep in radar
1. RSI in all time frames above 60
2. Price rise with huge volume
3. Three months long consolidation breakout
4. ABCD pattern under formation on weekly chart
FUNDAMENTALLY
Company has reduced debt.
Company has delivered good profit growth of 23.5% CAGR over last 5 years
Company has a good return on equity (ROE) track record: 3 Years ROE 27.2%
will this breakout Sustain ?
or
Will it fizzle out and continue its consolidation ?
Lets See How it Evolves.
Disclaimer: NOT A BUY / SELL RECOMMENDATION I am not an expert I just share interesting charts here for educational purpose and not to be taken as buy/sell recommendation. Please seek expert opinion before investing and trading as trading/ investing in market is subject to market risks. I do not hold any position in the stock as on date but I may look to buy on dips with my own Risk Reward matrix.

ANOTHER RALLY IN ADSL?"ADSL" is now getting ready for another rally in making a new ATH. There is a good short-to-mid term swing opportunity in this stock, but before this, we need to plan our entry. Two levels of entry is possible here:
a. The stock is undergoing a retracement in a lower timeframe (hourly), which should retest the previous resistance level of 254. A good entry should be at the time of retest which gives us a good risk-to-reward ratio.
b. Another entry, which is in fact a more generic and safe, is when price breaks the recent swing high of 278.
Targets are calculated using ABCD Pattern of Harmonics: In case "a", the targets are almost 27% and 35% respectively from the entry point. In case "b", the targets are almost 17% and 24% respectively.
So, keep this in your watchlist!

SHAYM METALICS 7 MTHS CONSOLIDATION WILL IT SUSTAIN ?Shyam Metalics And Energy Ltd. is another interesting chart
1. 7 month's Consolidation breakout in the chart
2. RSI on all time frames above 60
3. Price Breakout with huge Volume candles
4. ABCD pattern on weekly chart
5. Major supports with cluster of moving averages in zone of 665 - 720 which can act as multiple support area.
Fundamentally
Company has reduced debt.
Company is almost debt free.
Company's working capital requirements have reduced from 34.1 days to 12.1 days
Lets See How it Evolves.
Disclaimer: NOT A BUY / SELL RECOMMENDATION I am not an expert I just share interesting charts here for educational purpose and not to be taken as buy/sell recommendation. Please seek expert opinion before investing and trading as trading/ investing in market is subject to market risks. I do not hold any position in the stock as on date but I may look to buy on dips with my own Risk Reward matrix.

SELL JUBILANT FOODWORKSshare name : jubiLant food works
call type : sell
- share is forming a bullish butterfly pattern with ab=cd structural
- evening star on a point and tweezer top on c point
- currently share is breaking b point which is the neck of bullish butterfly pattern or you can say double top , in upcoming we can clearly see levels of 155
Thanks

HIGHER HIGH IN BHARTI AIRTELBharti Airtel is near its ATH; an attempt has been made to break it but still below the breakout level. This week's closing will decide whether to consider it for a mid-long term swing. Target is calculated according the ABCD pattern of Harmonics.

RELIANCE FOR SHORT TERM SWINGReliance Industries is making continuous Higher-Highs on higher timeframes. So it is very obvious that we can see a new ATH above 3050 (exact current ATH is 3025, but we are taking some buffer as it is one of the most manipulated high beta stock). Target is calculated using the ABCD pattern of Harmonics. Once price tries to break the current ATH, shift to 15 min timeframe and wait for a retracement for entry.

TATA POWER abcd pattern active on long sideTata power has good fundaments
good to buy in higher highs structure
target on monthly TIMEFRAME 441
stoploss is previous swing low
entry should be on pullback
best entry possible if stock gives correction till in 289 to 300 zone

NASDAQ - ABCDABCD pattern,
1. Correction levels are drawn with green horizontal lines.
2. The next 1-2 months are going to be crucial.
3. Indecision between the 17800 and 18400 levels

Wipro is in the support area !!!Considering the Monthly time frame, Wipro is in its support area.
An ABCD chart is presented here
I am not sure the price action will follow this..Let's see the moves
Note: For study purpose only

long view for bharti airtellong view
target is 985
stoploss zone is 930 to 920
risk to reward ratio is high
ABCD harmonic pattern is active
RSI is also showing strength
