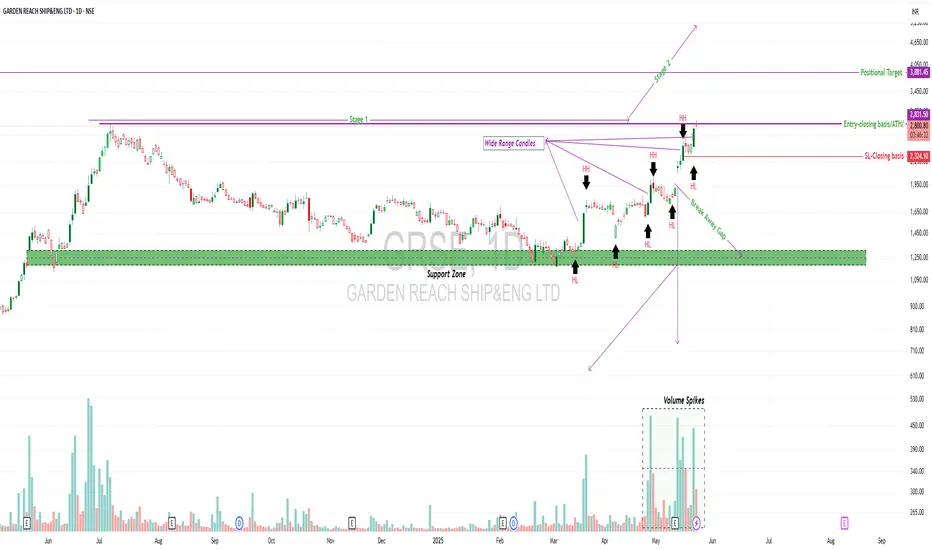
GRSE – Stage 2 Breakout WatchGRSE – Stage 2 Breakout Watch 🚢📈
CMP: ₹2,816
Structure: HH-HL forming | Wide Range Candles | ATH Zone
Stage: Transitioning from Stage 1 to potential Stage 2
Support Zone: ₹1,200–1,300
Breakout Trigger: ₹2,851+ (All-Time High zone)
🧠 Technical View
GRSE is attempting a breakout from a long consolidation base of nearly a year. The structure has turned constructive:
✅ Trading above all key DMAs
✅ Forming Higher Highs & Higher Lows
✅ Wide-range candles on upmoves, shallow pullbacks
✅ Breakaway gap followed by volume spikes
✅ Currently at All-Time High — part of a 1-year trading range breakout attempt
A clean close above ₹2,851 with volume could trigger a Stage 2 breakout, potentially unlocking a new leg of momentum.
📦 Entry Strategy
Add 50% exposure around current levels if comfortable with risk
Wait for retest of breakout zone for additional entry
Stop Loss (Closing Basis): ₹2,324.10
Target Zone: ₹3,880+ (measured move, continuation projection)
🎯 Risk : Reward
Entry: ₹2,816
Stop Loss: ₹2,324.10 → Risk: ~17.45%
Target: ₹3,881.45 → Reward: ~37.83%
📊 Risk : Reward = 1 : 2.17
Clean breakout setup with nearly 2x reward potential compared to the risk — solid structure for swing positioning.
🔍 Fundamentals Snapshot
Market Cap: ₹32,252 Cr
ROCE: 37.3% | ROE: 28.1%
Stock P/E: 61.1 (valuations are not cheap — price strength needs to sustain)
Dividend Yield: 0.33%
Excellent capital efficiency metrics, but don’t over-leverage based on fundamentals alone. Structure > Story.
📈 Sector Outlook + Market Conditions
The defence sector remains in focus, and GRSE is riding that thematic tailwind. However, overall market breadth remains weak, so expect pullbacks. Watch how price behaves during corrections — they could present opportunity if structure holds.
🛡️ Risk Management Notes
Don’t overcommit on a breakout — market volatility can fake moves.
Keep SL tight and re-enter if the structure continues
Trailing stop recommended post-breakout retest
⚠️ Disclaimer
I’m not a SEBI-registered advisor. This content is for educational purposes only. Please do your own research and manage risk based on your financial goals and position sizing strategy.
Abouttobreak
Mazagon Dock| VCP & Double Bottom – Watch for a Breakout!Mazagon Dock ⚓ | VCP & Double Bottom – Watch for a Breakout! 🚀
Mazagon Dock (MAZDOCK) is forming a Volatility Contraction Pattern (VCP) + Double Bottom on the weekly chart. A potential breakout is in play.
📌 Entry: Above 2671 (preferably on a daily close).
📌 Immediate Resistance: 2966 (All-Time High). Watch price action at this level. A strong breakout with volume could signal further upside.
📌 Stop-Loss: 2201 (Daily close). ⚠️ SL is deep (~17.6%), so position sizing is critical.
Trading Strategy & Risk Management 🛡️
🔹Breakout Entry: Small position above 2671 with a tight SL for safety.
🔹Retest Strategy: If a breakout occurs, watch for a retest of 2671 as support.
🔹Volume Confirmation: A strong breakout with volume can signal continuation.
🔹Risk Factor: Already up 1600%+ from lower levels, so profit booking pressure is expected.
🔹 The Broader Market is not in a safe territory yet – gradual accumulation is advised.
🔹 Wait for a clean breakout → Start with a small position.
🔹 Market conditions matter – If the market weakens, even strong setups can fail.
Stock Behavior & Market Context 📈
Mazagon Dock has a history of breakout-consolidation-breakout moves. It has already surged 1600%+, making risk management essential. Many investors are sitting on heavy profits, so expect volatility.
🚢 Defense & Shipbuilding Outlook:
India is heavily investing in defense manufacturing, with Make in India boosting the sector. The naval expansion plans and growing demand for warships & submarines could provide strong tailwinds for MAZDOCK in the long run. Government contracts & global interest could further fuel its growth.
Final Thoughts
2025 is shaping up to be a year where risk management will be key. Early entries help reduce risk, but sticking to the stop-loss is non-negotiable. Keep this on your radar and trade light!
This setup has high potential but requires discipline. Position sizing and SL adherence are key due to the deep stop loss. If the market remains bullish, MAZDOCK could see a multi-month breakout.
🔥 Will history repeat? Can MAZDOCK deliver another breakout rally? Let’s see!

Muthoot Finance | VCP Pattern in Play Muthoot Finance | VCP Pattern in Play 🔍
Technical Overview
📈 Trend: Uptrend, trading within an ascending channel.
🔄 Pattern: Volatility Contraction Pattern (VCP) in progress, signaling potential explosive movement.
📉 Correction: The stock corrected ~15% during the recent market sell-off but rebounded strongly, re-entering the channel. It’s now only ~9% off its recent ATH, showcasing resilience.
Key Levels to Watch
✅ Entry Point: Breakout above ₹2279 with strong volume and a wide-range candle.
🎯 Targets:
T1: ₹2492 (R:R = 1:1)
T2: ₹3200+ (post-market stabilization, aiming for R:R = 1:2)
🛡️ Stop Loss: ₹2067.9 (below the most recent swing low to manage risk).
Strategy
1️⃣ Enter 30% position on a clean breakout above ₹2279. Wait for a retest and continuation to add the rest.
2️⃣ If the breakout is sharp and you miss the entry, wait for a retest and continuation before entering, do not enter in FOMO.
3️⃣ Once T1 is hit, book partial profits to lock in gains, given the weak market conditions.
4️⃣ Hold the remaining position as per your risk appetite and trail your SL to protect profits.
Why This Stock?
⭐ Resilience: Despite the correction, Muthoot Finance re-entered the channel, showing strength against market headwinds.
📊 Strong Indicators: RSI is rising, signaling bullish momentum, and the VCP pattern suggests tightening volatility before a potential breakout.
📉 Controlled Drawdown: From its ATH, the stock fell just ~9%, demonstrating relative strength compared to the broader market.
⭐Trading above Key DMAs
Key Risks to Consider
⚠️ Weak Market Conditions: Broader market trends remain bearish, trading below the 200 DMA, increasing the chance of a failed breakout.
⚠️ Volume Dependency: Strong breakout volume is essential to validate the pattern.
⚠️ Market Correlation: Any further market correction could pressure this trade setup and the probability of hitting the SL increases. So trade light.
Who Should Trade This?
1️⃣Aggressive Traders: Can follow the breakout strategy with proper position sizing.
2️⃣Conservative Traders: Wait for market stabilization and a close of NIFTY 50, Nifty 500 above the 200 DMA before entering any trade.
Actionable Insights
🔒 Lock Partial Profits at T1: Secure gains to mitigate risk in this volatile environment.
📈 Trail Your Stop Loss: Once T1 is achieved, manage the trade dynamically to maximize returns.
Disclaimer
This analysis is for educational purposes only and not financial advice. Please conduct your own research and analysis before making any investment decisions. Trading involves significant risk.
Trade wisely and stay disciplined! 🚀📊

Bharti Airtel-Will it breakout and sustain?📊 Bharti Airtel Chart Analysis –
Bharti Airtel is trading in an upward channel but recently fell out of it and started forming a base. The stock is at a critical juncture, currently near its 50 DMA, with volume building up. This suggests the potential for a breakout or breakdown, depending on broader market conditions and price action.
🎯 Trading Plan:
📌 EarlyEntry Zone: ₹1,710.50 (small quantities recommended initially).
📌 Stop Loss (SL): ₹1,501.90 (closing basis) – ~12.2% below the entry.
📌 Prtial booking/Fresh Entry: ₹1,777.30 (~3.9% gain from entry).
📌 Positional Target): ₹2,104.40 (~23% gain from entry).
📌 Risk-to-Reward (R:R): 1:1.8 (approx.).
✨ Why This Setup?
📈 Trend Potential: Stock is trading above key DMAs (50, 200) despite the broader bearish market, highlighting its relative strength.
🏛️ Volume Support: Gradual volume accumulation near the 50 DMA indicates potential institutional interest.
📉 Downside Risks: The stock is against the overall bearish trend, increasing the chances of breakout failures in these market conditions.
🛡️ Risk Management: Entering in small quantities reduces risk, especially when the broader market is trending Lower High, Lower Low (LH LL).
⚠️ Risks to Consider:
Market Trend: The broader market remains bearish, with weak sentiment and no structural change yet.
Breakout Failure: Many breakouts in current conditions tend to retrace 10-20% brutally, shaking out weak hands.
💡 Tips for Trading This Setup:
Partial Profits: Once the entry is triggered, consider booking partial profits along the way.
Trailing SL: Use a trailing stop loss to lock in gains if the stock starts moving in your favor.
Position Sizing: Keep position sizes small to manage risks effectively.
Wait for Confirmation: Safe players should wait for the broader market to stabilize above 50 and 200 DMA and structure to shift to Higher High, Higher Low (HH HL).
📝 Educational Takeaway:
Stocks like Bharti Airtel, which are among the least affected in a bearish market, can outperform once the market stabilizes. However, in current conditions, the probability of breakout failures is high, so it’s essential to follow risk management and avoid aggressive positions.
🚀 Stay Disciplined and Trade Smart!
📢 Disclaimer:
This analysis is for educational purposes only and does not constitute financial or investment advice. Please conduct your own research and consult a certified financial advisor before making any trading decisions. Trading and investing involve risks, and past performance is not indicative of future results.

Redington Ltd – CNH & Inverse H&S Trade with Caution!🚀 Pattern Highlights
Cup and Handle & Inverse Head and Shoulders:
Redington is showing a potential Cup and Handle (CNH) formation alongside an Inverse Head and Shoulders, signaling a breakout at ₹238–₹240.
📊 Technical Levels
Entry: ₹238–₹240 (Breakout Level)
Stop Loss: ₹181 (24% below, on a daily closing basis)
Target: ₹340 (~42% upside, positional/medium-term)
Risk-Reward Ratio: ~1:1.75
🕵️♂️ Observations
1️⃣ The stock is trading within an ascending channel, forming higher lows.
2️⃣ It's below its 52-week high but not correcting much during this bearish phase.
3️⃣ The channel top may act as a key resistance.
4️⃣ Still in Higher High (HH) and Higher Low (HL) format while many other stocks have transitioned to Lower High (LH) and Lower Low (LL) structures.
5️⃣ Volume confirmation will be crucial for a breakout.
⚠️ Risks to Consider
Market Sentiment: Current market conditions are bearish, with indices correcting and most sectors showing weakness.
Bearish Transition?: No confirmation if this is a bull market correction or the start of a bear market.
Earnings Season: Quarterly results are around the corner, which could bring surprises.
📌 Why Risk Management Is Key
Example: Newgen Software recently broke out at ₹1,548 (ATH), moved ~15%, but then plunged 41% in just 9 trading sessions, trapping bulls.
Solution: Trade light with 7–10% of your usual position size (e.g., buy 7 shares if you usually buy 100). This limits risk while keeping you involved.
🏁 Conclusion
Trade cautiously: Position size, risk management, and patience are your best tools here.
If the stock doesn’t fall further, it could be an ideal candidate when the market reverses and bottoms out.
For Beginners: Avoid this trade for now. Add it to your watchlist and observe.
✨ Final Thoughts
Redington is trading tightly above its key DMAs with narrow-range candles. This indicates strength despite market weakness. Watch closely for a breakout confirmation.
🔍 Disclaimer
This is not financial advice. Do your own research (DYOR) and consult a financial advisor before making investment decisions. Trading involves risks, and capital is at stake. This idea is shared for educational purposes only.

CarTrade Tech- CnH FnP. Keep on Radar📊 CarTrade Tech - Technical Analysis 🚗
Reason for Picking This Stock:
CarTrade Tech has been in an uptrend since March 2023, trading within a rising channel. The stock tends to take support near the 50 DMA and the channel bottom, showcasing strong demand in those areas.
✨ Key Highlights:
1️⃣ Breakout from 3.5-Year Resistance: The stock has broken above a significant 3.5-year-old resistance level of ₹1,622.85 and gave a weekly closing above it.
2️⃣ Chart Patterns:
Cup and Handle (CnH) formation near the 3.5-year resistance.
Flag and Pole (FnP) pattern adds conviction to the breakout.
3️⃣ No Overhead Resistance: The left side of the chart shows no major resistance, providing room for upside movement.
4️⃣ Relative Strength in Market Correction: The stock has held strong during the broader market correction.
🎯 Trading Levels & Risk-Reward (R:R):
Entry: ₹1,835
Stop Loss (Closing Basis): ₹1,514
Positional Target: ₹2,543
SL %: 17.5%
R:R: 1:2
📌 How to Trade:
✅ Wait for Confirmation: A clear breakout with volume and a wide-range candle will strengthen the setup.
✅ Small Position Size: As the market trend is bearish, trade with reduced risk.
✅ Pullback Entry: Look for a pullback to the 50 DMA region or channel bottom for better risk-reward entries.
✅ Add on Base Formation: If the stock consolidates above the breakout level and breaks out again, consider this as a further entry point.
⚠️ Risk Considerations:
🚨 The broader market is trading well below the 50 DMA and 200 DMA, with a death cross in play. Committing large capital at this point may not be advisable.
🚨 This is a pure technical call on a fundamentally weak company. Perform your own due diligence before trading.
💡 Key Points to Watch:
1️⃣ Clear breakout from the Flag and Pole (FnP) and Cup and Handle (CnH) patterns.
2️⃣ The channel top may act as a resistance, so monitor price action near those levels.
3️⃣ Broader market stabilization above the 200 DMA and 50 DMA is crucial for larger capital deployment.
🚦 Final Thoughts:
CarTrade Tech is showing relative strength in a falling market—a key factor for stock selection during corrections. The intention is to highlight opportunities in stocks performing well despite broader market weakness. Trade cautiously and stick to strict risk management. 💪 and do not wait for target to be achieved in this market condition. Try to book partial and trail SL.
📉 Disclaimer: This analysis is for educational purposes only and not financial advice. Always consult your financial advisor before making any trading decisions.

Laurruslabs - Potential Breakout Opportunity🚀 Laurruslabs - Potential Breakout Opportunity
🔑 Early Entry: ₹627.5
💥 ATH Level: ₹725
📊 Positioning & Strategy:
💰 Entry Point: ₹627.5
⚠️ Stop Loss (SL): ₹498 (20.9% downside risk)
🎯 Target 1: ₹725 (15% upside potential)
📈 Positional Target 1: ₹829 (~32% upside from entry)
🌟 Long-term Target: ₹999 (~59% upside from entry)
📍 Key Levels & Action Plan:
Laurruslabs has been in an upward trajectory since April 2023 📈.
It consistently takes support near the 200 DMA, signaling strength in its trend 🔄.
27 Jan 2025 saw a red candle with huge volume 📉, but the stock quickly bounced back 🚀.
The ATH level at ₹725 is key 🔑. A breakout above ₹725 would confirm a 3.5-year resistance breakout and All-Time High.
💡 Action Strategy:
For Safe Traders:
📉 Book partial profits at ₹725 and trail SL to lock in gains 📊.
For Risk-Tolerant Traders:
👀 Watch for a breakout above ₹725. If confirmed with 3-5X volume 📈 and a clean breakout candle, consider adding more 🚀.
🔢 Risk-to-Reward (RR) Calculations:
From Early Entry to Target 1 (₹725):
Upside: ₹725 - ₹627.5 = ₹97.5 (15% upside) 📈
Downside (SL): ₹627.5 - ₹498 = ₹129.5 (20.9% downside) ⚠️
Risk-to-Reward Ratio (R:R): 1:0.72 (Risk is higher than reward here, so position sizing is key 🧑💼)
From Early Entry to Positional Target (₹829):
Upside: ₹829 - ₹627.5 = ₹201.5 (32% upside) 📈
Downside (SL): ₹627.5 - ₹498 = ₹129.5 (20.9% downside) ⚠️
Risk-to-Reward Ratio (R:R): 1:1.56 (Better reward for the risk taken ✅)
From Early Entry to Long-Term Target (₹999):
Upside: ₹999 - ₹627.5 = ₹371.5 (59% upside) 📈
Downside (SL): ₹627.5 - ₹498 = ₹129.5 (20.9% downside) ⚠️
Risk-to-Reward Ratio (R:R): 1:2.87 (Excellent reward for the risk taken 🎯)
⚠️ Risks Involved:
📉 Market Conditions: The overall market is in a LH LL structure, so we are trading against the trend 📊, which adds extra risk 🔥.
🔥 27 Jan 2025 Candle: The red candle with high volume is concerning, but no follow-through happened 📉. The stock bounced back quickly, which we can consider as a shake-out 🌪️.
📏 Position Sizing: Due to the deep stop-loss (20.9%), position sizing is crucial to manage risk effectively ⚖️.
"The stock market is a device for transferring money from the impatient to the patient." — Warren Buffett
💬 Disclaimer:
This analysis is educational and not financial advice. Always do your own research 📚 and consult a professional advisor 💼 before making any trading decisions. Stock market investments are risky, and past performance doesn't guarantee future returns 💡.

Prime Securities- Looks promising.
Forming a very good pattern. Entry-exit and SL are mentioned in the chart. Debt-free
(NBFC/Insurance/Capital Markets), company. Looks promising.
This is not a Buy/Sell recommendation. Kindly do your due diligence before investing.
