Why Bitcoin Broke Out After Weeks of Boring Price Action?Hello guy's let's analyse Bitcoin because for weeks, Bitcoin stayed inside a tight compression range while most traders lost interest. Price looked slow, directionless, and boring, exactly the phase where liquidity gets built quietly.
This breakout matters because it didn’t come after a spike.
It came after patience.
What the chart is really showing
A macro descending resistance was respected for months, keeping sellers confident.
Price compressed inside a clear accumulation zone, forming higher lows while absorbing supply.
Multiple rejections failed to push price lower, a classic sign of seller exhaustion.
Once liquidity was built and weak hands were positioned wrong, price expanded cleanly
Why this breakout is different from random moves
Most breakouts fail because they happen too early.
This one happened after time did the hard work.
No emotional spike before the move.
No vertical candles inside the range.
Compression + absorption first, expansion later.
That’s how sustainable moves begin.
When everyone gets bored, structure is usually being prepared.
And when structure completes, the move looks “sudden” only to those who weren’t watching.
Final thought
As long as price holds above the broken structure, this breakout remains valid.
Failure only comes if price accepts back inside the range, until then, momentum favors continuation.
If this helped you see the market differently, like, follow, or share your view below.
Analysis By @TraderRahulPal | More analysis & educational content on my profile.
Accumulation

Bitcoin Is Quiet Again — That’s Usually When Big Moves BeginBitcoin spent multiple sessions moving sideways inside a clearly defined accumulation range.
This kind of price behavior usually signals one thing, strong hands are building positions while weak hands get shaken out.
Sideways markets are not random. They are preparation phases.
Price remained compressed inside the accumulation zone, showing balance between buyers and sellers with declining volatility.
The breakout candle was decisive and impulsive, indicating acceptance above the range rather than a fake move.
After breakout, price pulled back into the prior range high, which is a classic bullish retest behavior.
As long as price holds above the breakout base, the structure favors continuation toward the expansion zone marked on the chart.
A failure back inside the range, would invalidate the breakout and shift momentum back to neutral.
If this helped you read price better, like, follow, or comment, more clean structure studies coming.
⚠️ DISCLAIMER: This analysis is for educational purposes only and is not financial advice. Markets involve risk. Always manage your position size and do your own analysis.

Smart Money Accumulating BDL — Are You Watching This Setup?Hello Traders!
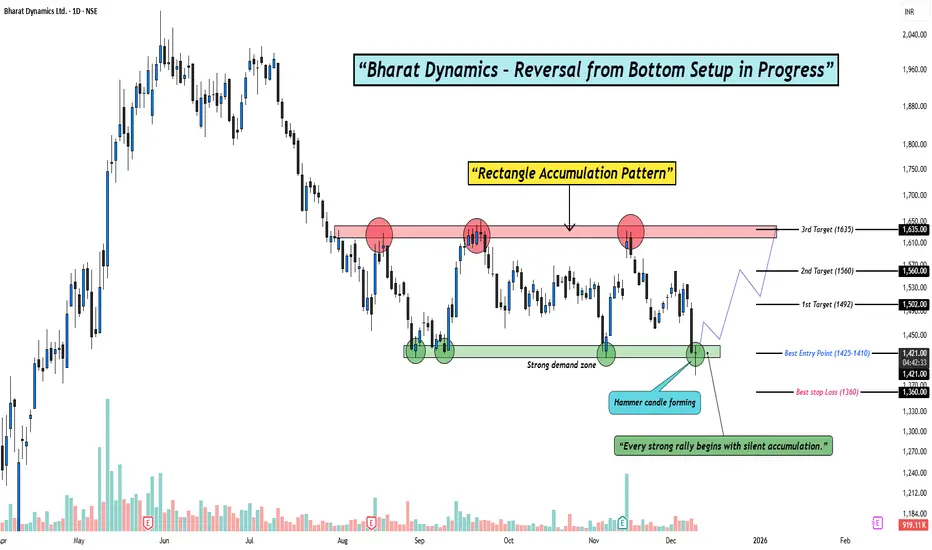
Today’s analysis is on Bharat Dynamics Ltd. (BDL) where a clear Reversal from Bottom Setup is developing. After weeks of sideways consolidation, the stock has formed a clean Rectangle Accumulation Pattern right above a strong demand zone. The latest Hammer candle appearing inside this zone adds strong confirmation that buyers are stepping in again.
Why this setup is special?
Multiple rejections from supply and repeated buying from demand create a classic accumulation range.
The recent hammer candle shows rejection of lower prices and signals potential reversal strength.
Sideways accumulation after a downtrend often leads to strong breakout rallies when demand overpowers supply.
Levels to Track:
The best entry zone lies between 1425–1410, aligning perfectly with demand. As long as price stays above 1360, the structure remains intact. On the upside, the first target sits near 1492, followed by 1560, and finally a breakout extension target around 1635, where previous supply reacts strongly.
Rahul’s Tip:
Every strong rally begins with silent accumulation. Patterns like this look slow at first, but once the breakout hits, momentum often surprises traders who were waiting too long.
(Analysis By @TraderRahulPal | More analysis & educational content on my profile. If this helped you, don’t forget to like and follow for regular updates.)
Disclaimer:
This analysis is for educational purposes only and should not be taken as financial advice. Please do your own research or consult your financial advisor before investing.
ETH/USDT Bullish Reversal SetupETH/USDT Bullish Reversal Setup
The chart shows a clear transition in ETH as price moves from a prolonged distribution-driven decline into a developing accumulation range. After weeks of consistent bearish structure, the market finally printed multiple upside shifts, signaling that sell-side pressure is weakening and liquidity behavior is changing.
The recent impulsive rally out of the discounted range confirms that buyers are actively defending lower levels. Price is now pulling back toward a short-term demand pocket formed during the breakout. This area represents the first meaningful accumulation zone after the market broke a series of internal swing points.
As long as price maintains stability within this demand block, the structure favors continuation toward the next major liquidity cluster above. The next upside draw is positioned around the 3,440–3,500 region, where previous inefficiencies and unmitigated zones converge. That region also holds resting buy-side liquidity, making it the logical target for a future expansion move.
The current market behavior suggests that ETH is in the early phase of a bullish repricing cycle. A controlled pullback into the highlighted zone—followed by a reaction—would confirm continuation and attract momentum buyers aiming for the higher liquidity magnet.
Overall, this chart reflects a shift in narrative: sellers are losing dominance, the market is building a fresh bullish structure, and the path of least resistance is gradually tilting upward as long as the demand zone remains protected.

Hindustan Zinc – Diya aur Batti Pattern📈 Pattern Analysis: Hindustan Zinc is currently shaping a "Rounding Bottom formation" on the charts, a classic reversal pattern that suggests the possibility of a long-term trend change. The stock is consolidating in a narrow range since Nov 2024 after a steep 50% decline from its top , indicating a phase of "Accumulation" .
Interestingly, alongside the rounding bottom, we also identify a newly observed structure – the “Diya and Batti Pattern” – which combines stability with a gradual build-up in price strength.
📊 Trend & Support:
The stock is trading above its 50 EMA, which is sloping upward, confirming the underlying uptrend.
Price stability over months strengthens the base formation and increases the probability of a powerful breakout.
🔎 Momentum Indicators:
Volumes remain muted during consolidation, a common sign of accumulation.
A decisive breakout must be accompanied by **rising volumes and a bullish candle** for confirmation.
🎯 Projection & Outlook: A confirmed breakout above the rounding bottom and accumulation zone will likely mark the beginning of a multi-year uptrend. Once breakout levels are crossed, Hindustan Zinc could witness significant upside momentum with potential medium- to long-term targets well beyond current levels.
⚠️ Disclaimer:
This is a technical projection intended for educational purposes, not an investment recommendation. Any trading strategy should be executed with proper risk management.

HBLENGINEStock has recently given a rally of about 50%. And now it is consolidating. Market participation has also increased in recent time. And currently trading near support line. Risk reward is quite in favor. Track it closely.

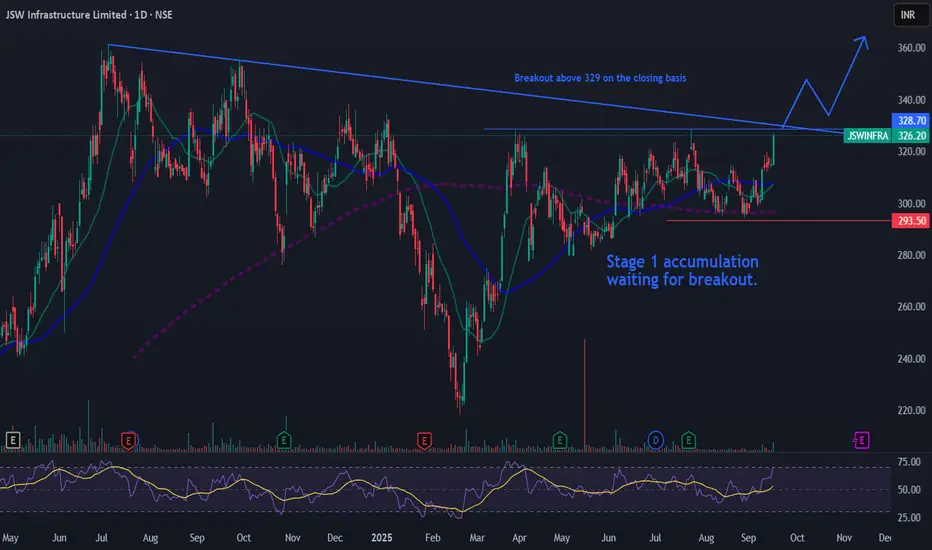
Jswinfra waiting for stage 1 breakoutJswinfra waiting for stage 1 breakout
Entry 329-340
SL 293
Only for journaling, not for a trading/investing.
This post is for my personal use.
Note : only for learning, not a trading recommendation. i am posting as a trading journal before and after breakout.
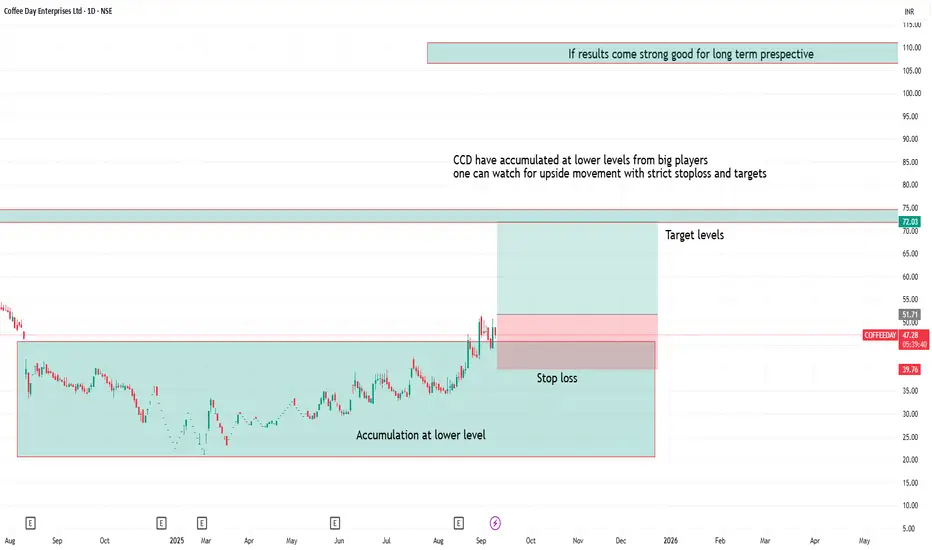
CCD showing accumulation 1. CCD is showing accumulation at lower levels with big players
2. If result comes strong then stock can give good returns in long term
3. one can observe for upside movement with strict stoploss and targets
ZYDUS Lifesciences - An Interesting ChartA good accumulation Range
A "SPRING" and a good up move
Relative strength positive
Money flow positive
Increased Buying Pressure
Good quarterly results
Now, A break out of the Accumulatio zone on increased volume. Also going past an old supply area of the BC bar.
Looks poised for a move to stage 2. Could also test the previous supply before further up move. Next couple of sessions would throw more light.

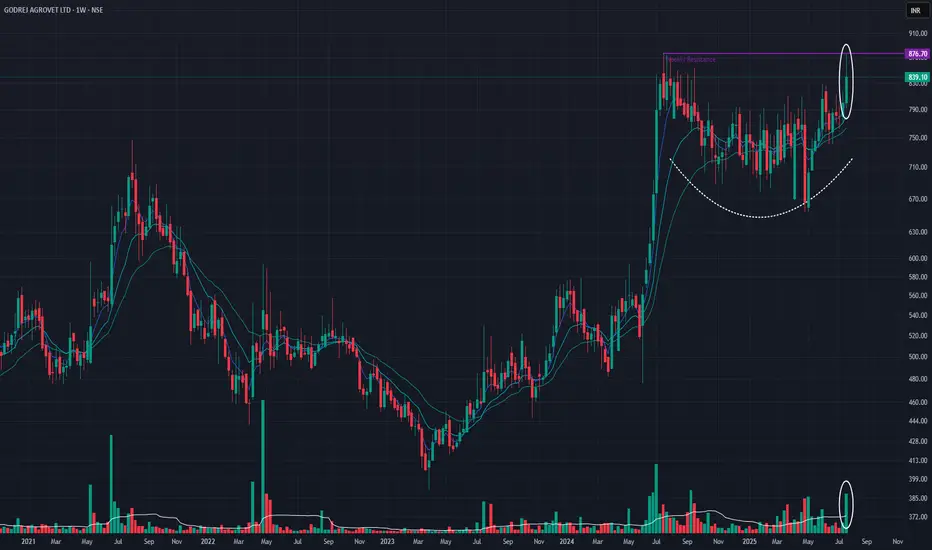
Godrej Agrovet Ltd (Weekly Timeframe) - Potential BreakoutSince the All Time High on Jul 15, 2024, the stock is in a Accumulation phase , and last week it tried to breach the ATH with Huge Volume . The stock may BreakOut of the Resistance Zone if Good Volume is available. If it is able to breach the resistance zone, then it may go to 1070 levels.
It is also possible that there could be some profit booking which means the stock could come down as well.
Keep monitoring.
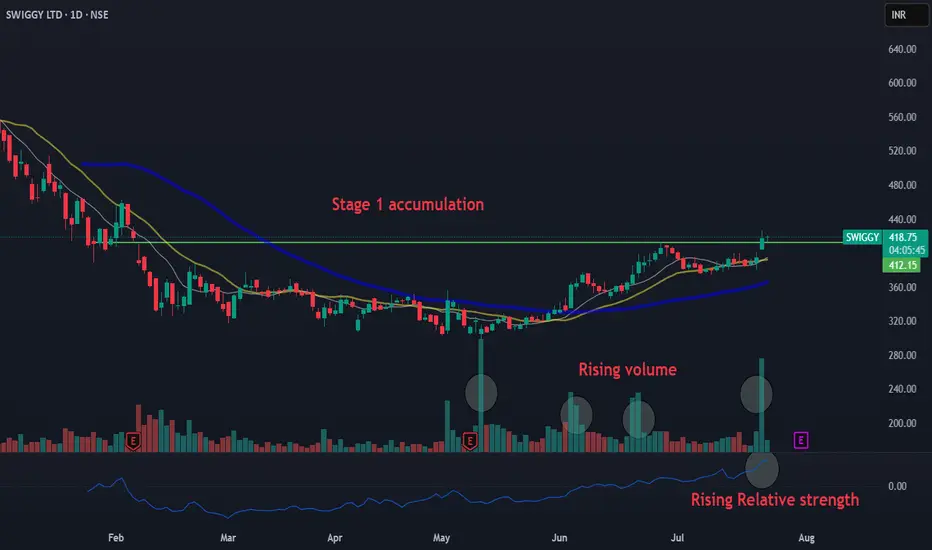
Swiggy stage 1 breakoutSwiggy stage 1 breakout
Entry 411-425
SL 399,389,372
Only for journaling, not for a trading/investing.
This post is for my personal use.
Note : only for learning, not a trading recommendation. i am posting as a trading journal before and after breakout.
EIEL: The Anatomy of a Textbook Turnaround PlayToday, we're going to dissect the anatomy of the EIEL chart. What we have here isn't just a random series of candlesticks; it's a compelling case study in how a stock structurally transitions from a deep downtrend to a potential new path upward. It's a classic story, and the clues have been laid out for us to follow.
Every now and then, a chart comes along that tells a crystal-clear story. It’s not about predicting the future with certainty, but about recognizing a classic pattern of behavior. In my opinion, EIEL is painting one of those pictures right now—a powerful narrative of a stock transitioning from a brutal downtrend to a new, potential uptrend.
Let’s break down the key chapters of this story.
Chapter 1: The Foundation (March - May 2025)
After a long and painful decline, the selling finally exhausted itself. The stock didn’t just stop falling; it went into a deep slumber, trading sideways in a well-defined range.
The Accumulation Zone: This is where the smart money went to work. For three months, while the stock looked boring to most, the volume completely evaporated. This wasn't a sign of disinterest; it was the tell-tale sign of accumulation. Big players were quietly absorbing shares from the last of the weak hands.
The Bedrock Support: The absolute floor for this entire structure was established at 188 . This is the level where buyers showed up with absolute resolve.
Chapter 2: The Ignition (Late May 2025)
After months of quiet, the market made its move. The stock ignited, blasting through the ceiling of its trading range at 232 .
This wasn't just a breakout; it was a statement of intent, backed by a massive surge in volume. That's the kind of power that signals a genuine change in character for a stock.
Chapter 3: The Confirmation & The Coil (June - Present)
This is where the story gets really interesting, and it’s what makes the current setup so compelling. After the powerful breakout, the stock pulled back to re-test the old resistance level.
It wasn't a perfect, clean kiss of support. It dipped slightly below 232 in a classic "shakeout" maneuver, designed to scare traders out of their positions before the real move. The fast and aggressive recovery from that dip is incredibly bullish—it confirmed that the old ceiling is now the new floor.
So, where do we stand now?
The Box: The price is currently coiling in a very tight consolidation box, building energy for its next move. The floor of this box is our key support at 232 , and the lid is the immediate resistance at 252 .
The Volume Story: Just like in the initial accumulation phase, the volume has gone quiet again during this consolidation. This tells us there's very little selling pressure. The stock is simply resting.
🎯 The Game Plan 🎯
Based on this price action, the thesis is straightforwardly bullish. The stock has done all the heavy lifting of building a base and has confirmed its strength.
The Trigger: A decisive close above the lid of the box at 252 would be the signal that this consolidation is over and the next leg up is beginning.
The First Target: The initial objective would be a re-test of the post-breakout high at 268 . A move through that level would open the door to significantly more upside.
The Invalidation Point: A trade is only as good as its risk management. The bullish thesis remains fully intact as long as the price holds above the key support at 232 . A close below this level would signal that the breakout has failed and would be a reason to step aside.
This is a classic setup that rewards patience. The structure is sound, the volume confirms the price action, and the risk is clearly defined. Keep a close eye on that 252 level.
Disclaimer: This is my personal analysis and is for educational purposes only. It is not financial advice. Please conduct your own due diligence before making any trading decisions.

JP Power - Are bad times over for this penny stock?Stock can fly if it gives a monthly closure above 25
Sharing only for educational purposes. Keep in watchlist to see who it unfolds.
Penny stocks should be strictly avoided for investment purposes.
Highly risky.

Godrej Properties Ltd : Dual Rounding Bottoms Pattern1. Overview
Godrej Properties Ltd. has exhibited a significant dual rounding bottom price pattern, indicating strong bullish reversals over extended periods. The first rounding bottom, spanning December 2021 to December 2023, was successfully completed, and its target was achieved according to the classical measurement rule.
Currently, the stock is forming a second rounding bottom between December 2024 and June 2025, signaling a potential new upward trend once confirmed. The RSI (Relative Strength Index) indicator also reflects this pattern by forming corresponding rounding bottoms, confirming positive momentum building at the indicator level.
2. Rounding Bottom Pattern: The rounding bottom is a long-term reversal pattern characterized by a smooth “U”-shaped price action that typically unfolds in three distinct phases:
Phase 1: Falling Prices with Rising Volume : Strong downtrend accompanied by rising volume reflects intensified selling pressure.
Phase 2: Falling Prices with Declining Volume: Price continues to drop but with diminishing volume, indicating that sellers are losing conviction.
Phase 3: Signs of Bullishness with Rising Volume: The emergence of bullish candles with rising volume signals growing demand and buyer interest.
3. Accumulation and Its Importance
Accumulation occurs during the rounding bottom's base formation, characterized by:
Three or more bottoms forming at nearly the same price level.
Volume contracting during price declines and expanding on minor upswings.
This pattern of price and volume confirms strong accumulation by informed investors, setting a foundation for the impending breakout.
The accumulation phase is crucial, as it represents the shift from seller dominance to buyer control, often preceding a significant price rally.
4. First Rounding Bottom (Dec 2021 – Dec 2023): Recap
The first rounding bottom completed a textbook formation over two years.
Following breakout above the neckline, the target price was met as per the classical measurement rule (distance from bottom to neckline projected upward).
Breakout was confirmed by a strong candle close above the neckline with rising volume, validating the reversal.
5. Current Second Rounding Bottom (Dec 2024 – June 2025)
Price action currently mirrors the classical three-phase rounding bottom structure:
Initial price drop with rising volume (Phase 1).
Subsequent price decline with decreasing volume (Phase 2).
Emerging bullish candles with increasing volume (Phase 3).
The key resistance level to watch is the neckline at ₹2500.
A sustained breakout above ₹2500 with a positive candle close and rising volume will confirm the pattern’s completion and trigger a strong bullish move.
6. RSI Confirmation
The RSI indicator is also forming a rounding bottom pattern synchronized with the price action. This alignment strengthens the validity of the pattern by confirming that momentum is gradually shifting from bearish to bullish territory. The RSI rounding bottom indicates that selling pressure is fading. Increasing RSI levels with rising volume provide a strong signal of increasing demand and improving momentum.
7. Conclusion & Trading Outlook
Godrej Properties shows a strong dual rounding bottom formation, with the first pattern successfully completed and the second underway:
The current phase suggests growing accumulation and increasing demand.
Confirmation awaits a breakout above ₹2500, validated by strong volume and bullish candle close.
The RSI rounding bottom adds conviction to this bullish setup.
Traders and investors should monitor volume and price action around the ₹2500 neckline for a confirmed breakout, which is likely to provide an attractive buying opportunity.
8. Risk Considerations
False breakouts or weak volume could invalidate the bullish outlook.
Broader market and sector-specific risks remain relevant.
Employ prudent risk management strategies with appropriate stop-loss placement.
Disclaimer: This report is intended for educational purposes and should not be considered financial advice. Please perform your own analysis or consult a professional before making investment decisions.

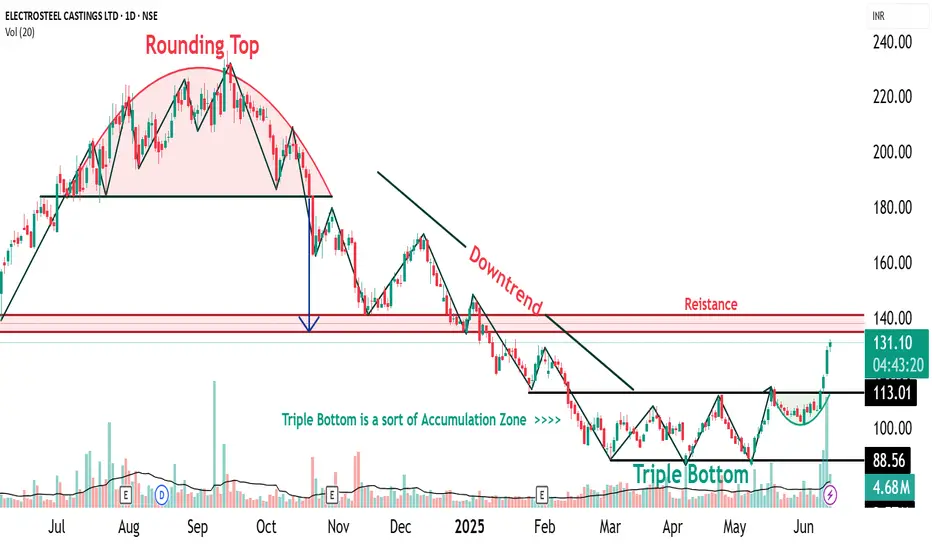
ELECTCAST Triple Bottom Pattern🔍 1. Understanding the Triple Bottom
The Triple Bottom is a classic bullish reversal pattern that typically forms after a prolonged downtrend or consolidation phase. It signifies strong buying interest at a consistent support level, leading to three distinct price lows (or “bottoms”) occurring near the same price zone.
📌 Key Characteristics:
Formation Time: Typically spans 2–6 months
Touchpoints: Three distinct lows formed at or near the same support level
Pattern Zone (for ELECTCAST): ₹87 – ₹88
Trade Entry: Entry is typically considered on a breakout above the neckline, which is the horizontal resistance connecting the interim highs between the bottoms. In this case, a breakout confirmation would be around ₹96.
Stop Loss (SL): Just below the third bottom, e.g., ₹85
Target: Based on pattern depth projection, conservative ₹104, aggressive potential up to ₹120–₹140, once momentum sustains
📉 2. Triple Bottom Formed at ₹87–₹88 Zone
Electrosteel Castings has tested the ₹87–₹88 level three times, showing that this price zone has acted as a strong accumulation support. The repeated defense of this level suggests significant buying interest by institutional players or informed investors.
1st Bottom: Initial rejection near ₹88
2nd Bottom: Retest with similar rejection zone
3rd Bottom: Confluence with bullish reversal candlestick (Morning Star)
The pattern is visually symmetric and clean, enhancing its reliability.
At the third bottom near ₹87, a Morning Star was observed, marking the first visual confirmation of bullish reversal. This adds significant strength to the pattern because the third bottom often acts as a psychological pivot point, triggering buying from traders watching for a reversal.
📈 3. Higher Top – Higher Bottom Structure Emerging
Following the Morning Star, the stock has started forming a higher bottom and higher top structure—a fundamental trait of an uptrend. However:
🟡 Caution: One more higher bottom formation is required to confirm the start of a sustainable uptrend.
Once the uptrend is firmly established, a close above ₹140 will act as a major breakout signal, potentially propelling the price toward new 52-week highs or an all-time peak.
🧠 4. Accumulation Zone and Triple Bottom – The Relationship
An Accumulation Zone is a price range where informed investors quietly accumulate shares over a period, usually when a stock is undervalued or consolidating.
🔗 Connection to Triple Bottom:
The Triple Bottom pattern often forms within the Accumulation Zone
Each dip to the support level attracts buyers, revealing hidden demand
The formation acts as a transition from accumulation to markup phase
The breakout from the Triple Bottom signals the end of accumulation and the start of an uptrend
Hence, the Triple Bottom is not just a technical pattern, but a visual representation of accumulation dynamics playing out.
📝 Disclaimer
This report is intended purely for educational and training purposes. It is not a recommendation to buy or sell securities. Always conduct your own research or consult a certified financial advisor before making trading decisions.
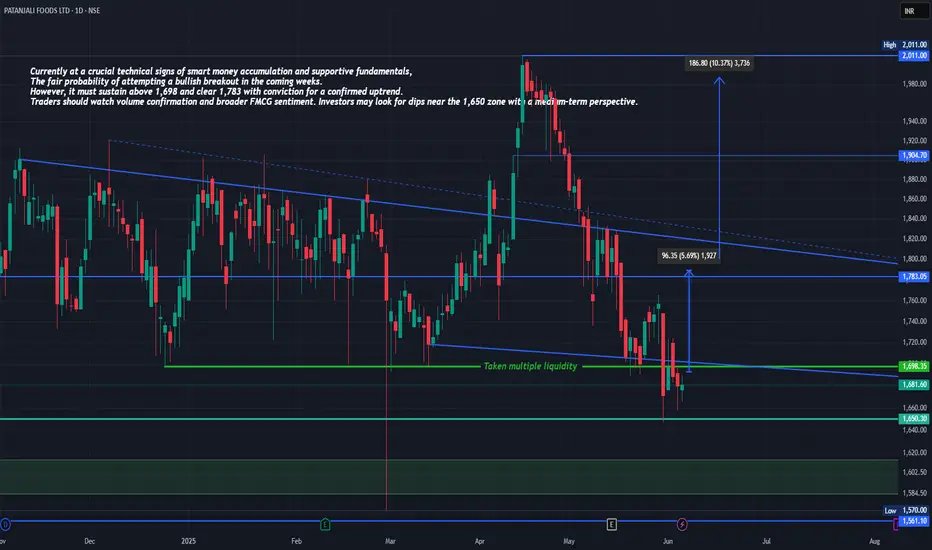
PATANJALI FOODS LTD – Daily Chart AnalysisPATANJALI FOODS LTD – Daily Chart Analysis
Price as on June 6, 2025: INR 1,681.60
Technical View with Fundamental Context
Price Structure Analysis:
Patanjali Foods appears to be consolidating within a large descending wedge pattern. The recent price action shows a bounce from the lower wedge boundary, where multiple liquidity points have been swept, creating a potential accumulation zone.
Current Support Zone: INR 1,650 to 1,698 (marked by green horizontal levels)
Immediate Resistance: INR 1,783 (falling trendline and horizontal supply zone)
Breakout Targets:
INR 1,783 (near resistance)
INR 1,904 (midterm supply area)
INR 2,011 (swing high from previous uptrend)
If the price sustains above 1,698 and gains volume strength, it may attempt a move toward the 1,783 zone, followed by a breakout targeting 1,904 and beyond.
Some Observations
Liquidity Grab Confirmed:
Price action shows a wick piercing below a crucial horizontal demand level. This sweep of stop-losses beneath support is often followed by a reversal, suggesting institutional accumulation.
Wedge Compression:
Multiple lower highs and relatively stable lows form a classic descending wedge pattern, which statistically favors bullish breakouts.
Measured Move Setup:
From the current level to the wedge breakout target at INR 1,783 represents a 5.69 percent move. Beyond that, the extended upside toward INR 2,011 offers a potential of over 10 percent.
Fundamentals Highlights:
Operates under strong brand equity with wide rural and urban penetration.
Strategic backward integration in oilseed procurement and processing.
Plays a major role in import substitution for edible oils, supported by government policies.
Recent Developments:
Restructuring and synergy with other Patanjali Group entities is ongoing.
Expansion into high-margin wellness and health products.
Strong demand trends seen in packaged foods and nutraceuticals.
Risks:
Vulnerability to global edible oil prices and supply chains.
High promoter holding under regulatory scrutiny can impact investor sentiment.
Positives:
Focus on indigenous production and Atmanirbhar Bharat themes.
Consistent demand for essentials even in weaker market cycles.
Debt reduction in recent quarters shows improvement in balance sheet strength.
Patanjali Foods is currently at a crucial technical zone. With signs of smart money accumulation and supportive fundamentals, the script has a fair probability of attempting a bullish breakout in the coming weeks. However, it must sustain above 1,698 and clear 1,783 with conviction for a confirmed uptrend.
Traders should watch volume confirmation and broader FMCG sentiment. Investors may look for dips near the 1,650 zone with a medium-term perspective.
Like, comment your thoughts, and share this post
Explore more stock ideas on the right hand side your feedback means a lot to me!
Disclaimer: This post is for educational purposes only and should not be considered a buy/sell recommendation.
Technical Analysis Report: SMS Pharmaceuticals Ltd1. Bullish Flag with Pole (June–July 2024)
Bullish Flag with Pole: A continuation pattern formed after a strong upward price move (the pole), followed by a short-term consolidation (the flag), signaling the potential for another breakout upward.
Price Action: Strong impulsive rally formed the flagpole, followed by a tight consolidation forming the flag 🚩.
Breakout: Confirmed with a high-volume breakout to the upside.
Target: Achieved a massive 40% gain in under a month.
Analysis: A textbook bullish continuation pattern; traders capitalized on early entry post-breakout.
2. Distribution Phase (August–October 2024)
Distribution Phase: A sideways trading range after an uptrend where smart money or institutions start offloading their holdings. Typically a precursor to a market reversal or downtrend.
Market Structure: After the sharp uptrend, price entered into a horizontal range.
Phase Characteristics: Low volatility, repeated rejections at resistance, high volume on down days—signs of distribution.
Interpretation: Institutions likely booking profits, signaling a potential trend reversal.
Trader Sentiment: Shifted from bullish to neutral/bearish.
3. Triple Top Formation (Within Distribution Phase)
Triple Top Pattern: A bearish reversal pattern marked by three failed attempts to break above a resistance level, indicating weakening momentum and a potential downtrend.
Resistance Level: Same peak tested three times without breaking.
Breakdown: Confirmed after the third top with a decisive drop.
Target: Achieved a "30% downside" move via "short selling", all within a month.
Insight: Classic reversal pattern, effectively timed with distribution.
4. Bearish Flag with Pole (During Triple Top Breakdown)
Bearish Flag with Pole: A continuation pattern during a downtrend. It starts with a sharp decline (pole), followed by a minor upward consolidation (flag), suggesting further downside.
Formation: Sharp decline (pole) followed by a brief upward consolidation (flag).
Breakdown: Continuation to the downside, achieving projected target.
Target: Fully achieved within the same downtrend cycle.
Conclusion: Reinforced the bearish sentiment and amplified the down move.
---
5. Accumulation Phase + Triple Bottom (December 2024–April 2025)
Accumulation Phase: A market phase where a stock trades in a range after a downtrend, as buyers (often smart money) gradually build positions, typically leading to a bullish reversal.
A Triple Bottom is a bullish reversal chart pattern that forms after a downtrend, marked by three equal lows indicating strong support and a potential trend reversal to the upside.
Phase: 5-month Accumulation Phase
Pattern: Triple Bottom during this period indicated strong support and buyer presence.
Breakout: Occurred with a bullish breakout post third bottom.
Target: 20% upside achieved within a month post-breakout.
Observation: Long-term investors and smart money potentially entering positions.
6. Rounding Bottom in Progress (May 2025)
Pattern: Rounding Bottom (Still Forming)
Current Price Action: Gradual curve formation with decreasing volume on the left and increasing volume near the neckline— a bullish sign.
Expectation: Anticipated upside breakout in the coming days.
Outlook: If confirmed, this could mark the start of a new bullish cycle.
📌 Summary:
SMS Pharmaceuticals Ltd. has shown a textbook series of technical patterns—from trend continuations to reversals, distribution to accumulation, and now a potential new uptrend. Each phase was actionable, with clear breakout/breakdown points and well-achieved targets.

KSCL Trade set up with 1: 33 RR1. Trend - sideways
2. Phase - Accumulation
3. Higher bottoms shifts
4. RR - 1:33
5. SL - follow on 2 weekly closing basis

Senores Pharma: Cup & Handle - Ready for Some Action?NSE:SENORES
Senores Pharma is forming a potential cup and handle on the daily timeframe. A breakout attempt on Feb 6, 2025, failed to sustain above ₹607.35 as selling pressure came in second half.
Now, the cup and handle pattern is progressing, making next week crucial. A close above ₹607.35 is the key level to watch for confirmation.
Volumes are rising, with today's volume (Feb 21, 2025) nearly 5x yesterday's. The stock's resilience despite market pressure indicates strength.
Cup and Handle pattern usually don't disappoint so would be interesting to watch.
Senores Pharmaceuticals is a research-driven company focused on developing specialty pharmaceutical products for regulated markets. The company has shown impressive financial performance:
Recent Financials (Q3 FY25):
Net Sales: ₹106.4 crore (up 35% YoY from ₹78.7 crore in Q3 FY24)
QoQ Performance: Increased from ₹104.4 crore in Q2 FY25 (up 1.92%)
EBITDA: ₹29.1 crore (up 92% YoY)
PAT: ₹17.2 crore (up 142% YoY from ₹7.1 crore in Q3 FY24)
9MFY25 Performance:
Total Revenue: ₹288.1 crore (up 157% YoY from ₹112.1 crore in 9MFY24)
PAT: ₹40.7 crore (up 162% YoY)
Market Position : The stock has outperformed its sector and the broader Sensex, achieving consecutive gains over the past month and trading above multiple moving averages.
Future Projections : Management anticipates a top-line growth of 50%-60% for FY26, with plans to launch five new products in the current quarter.
Strategic Focus : Continued investment in R&D and infrastructure development is expected to enhance manufacturing capabilities and expand product offerings.

AMD Effect on the BankniftyThe chart clearly reflects how the big players have done stop loss hunting where most retail traders and investors have their stop losses below a consolidation. It is clearly seen that the big players induced false buying and dragged the prices all the way down first triggering all stop losses and now gearing up the market to take it up in the intended direction.

Technical Analysis for Aurobindo Pharma (AuroPharma):
Trade Type: Swing trade for 1 month
Key Signals:
Waiting for breakout
Near support zone and 200 DEMA
RSI bullish divergence observed, signaling potential upward momentum
Targets:
Target 1: ₹1396
Target 2: ₹1515
Monitor closely for breakout confirmation. Ensure risk management by planning an appropriate stop loss.
📌 Disclaimer: This analysis is for educational purposes only and not investment advice. Please consult a financial advisor before making any trading decisions.
#AuroPharma #AurobindoPharma #TechnicalAnalysis #RSIDivergence #SwingTrade #200DEMA #SupportZone #BreakoutTrading #StockMarket

HIL - Possible AccumulationMarkets can have three possible movements - Up Trend, Consolidation and Down Trend. Usually the sequence of these phases is Consolidation (Accumulation) --> Up Trend (Market Participation) -> Consolidation (Distribution) --> Down Trend (Market Participation). Some might even call these phases as phase 1, 2, 3 and 4.
HIL Looks in possible accumulation phase. This would be confirmed if price breaks the upper bound of the marked channels with strength.
I would buy any pullbacks after break or atleast trial to break the upper channel.
This material is for informational purposes only to show various phases of the market, and is in no way a trading recommendation.

Dow theroy - NIfty50 !!NSE:NIFTY
This chart represents a technical analysis of the Nifty 50 Index in the I-hour time frame, showing key
phases and levels that traders monitor for decision-making. Here's the explanation in simpler terms:
1. Accumulation Zone:
This is the area marked in the first shaded box where the price is moving sideways within a
range (between support and resistance levels).
• In this phase, big players (institutions) are likely accumulating (buying) before the next move.
2. Breakout to Manipulation:
After the accumulation, the price broke out above the resistance level. However, this was
followed by a sharp reversal downward.
The sharp drop is labeled "Manipulation," where the market may have tricked traders into
thinking the price was going higher, only to push it down.
3. Support Levels:
• Several support levels are marked where the price found temporary stability and reversed
upward. These areas indicate where buying pressure overcame selling.
4. Distribution Zone:
• In the next shaded area, the price moved sideways again. This could indicate a "distribution"
phase where institutions are selling off positions after the price increased.
5. Future Projection:
The dotted line shows a possible future path where the price could rise again toward the
distribution area (marked as potential resistance).
Key Takeaways:
Sideways Movement: Indicates areas of balance between buyers and sellers.
Manipulation: A sharp move designed to trigger stop-loss orders or mislead traders.
• Future Trend: The chart suggests a bullish (upward) move if the price sustains above current
support levels.
Traders can use these observations to plan entries or exits around support/resistance levels while
being cautious of potential false breakouts.
