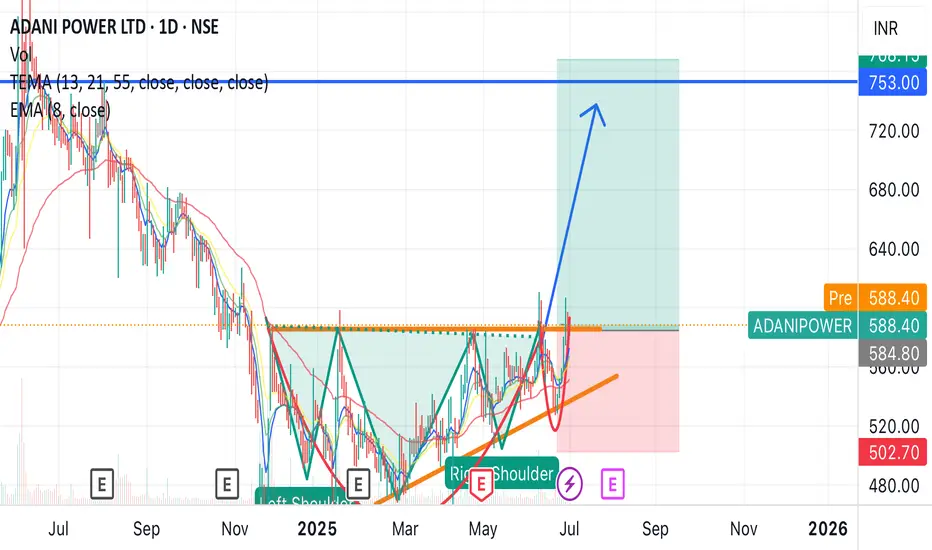
Adani power breakout anytime Adani power price hover just above resistance can give breakout anytime, earlier it was showing head and shoulder pattern and now changed into cup and handle pattern, also the support is also moving up.
Can expect a breakout anytime.
Entry around - 600
Target - 750
Duration 1-2 month
Adani
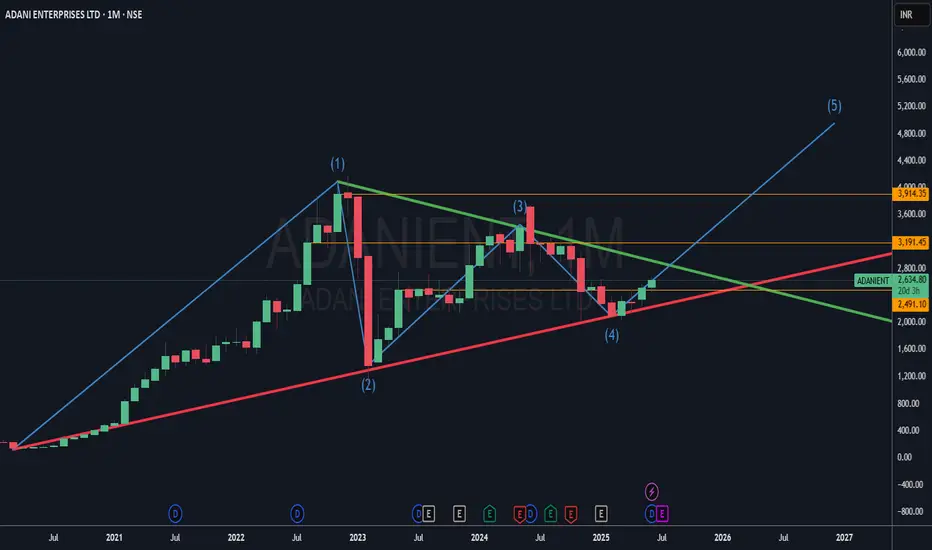
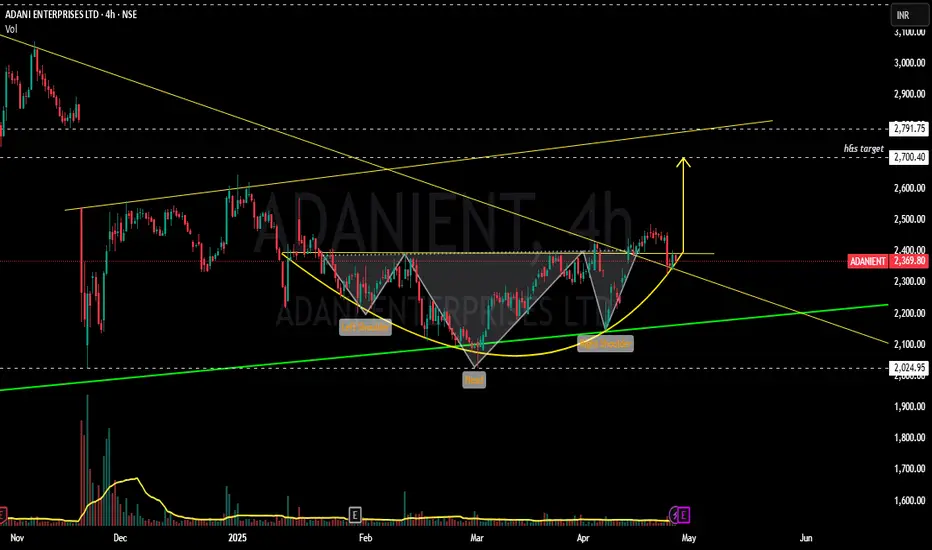
Thinking big. Doing better - "Hum Karke Dikhate Hain"Adani Enterprises Ltd - CMP - 2636
About
Adani Enterprises Ltd has business interests in various economic areas such as mining, integrated resources management (IRM), infrastructure such as airports, roads, rail/ metro, water, data centres, solar manufacturing, agro and defence.
This is just to boost my confidence. No Suggestions for buying. I will keep checking and updating my mistake if last post gone wrong...
Disclosure: I am not SEBI registered. The information provided here is for educational purposes only. I will not be responsible for any of your profit/loss with these suggestions. Consult your financial Adviser before making any decisions.
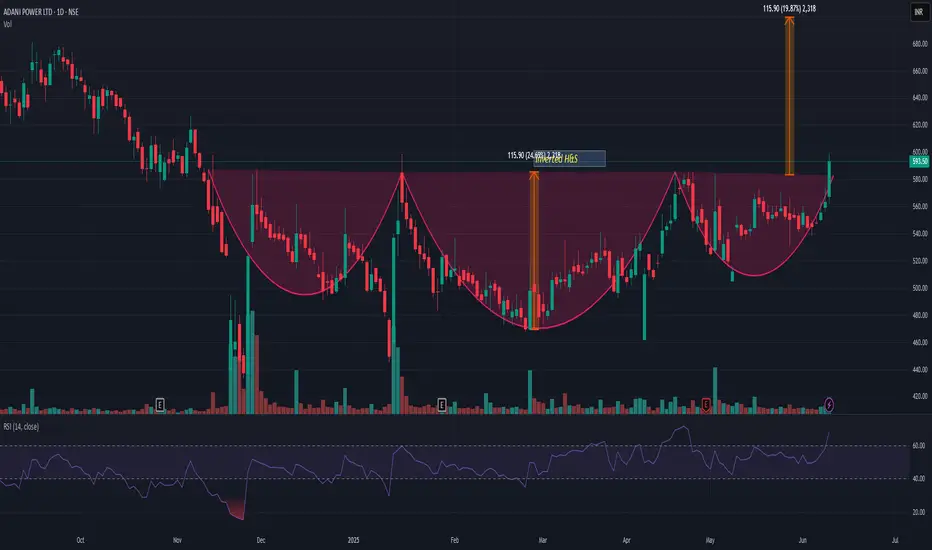
ADANIPOWERADANIPOWER has given inverted H&S breakout with very good volume. All ADANI stocks showing a strength. If we look at the pattern then it may add more 18-20% from here. My view may change we it closes below 540.
Adani power breakoutAdani power short term profit up to 35%
Hold duration of Adani power 1-2 month
Buy around - 590
Target -750
Adani power fundamentals are strong and just gave a breakout, might be possible to give profit in under 10-15 days

ADANIGREENADANIGREEN has given resistance breakout with decent volume. Resistance on upper side is around 1250 and support is nr 980-90. Today traction in ADANI group has been observed and this may push fresh momentum in upcoming days. Keep it on radar

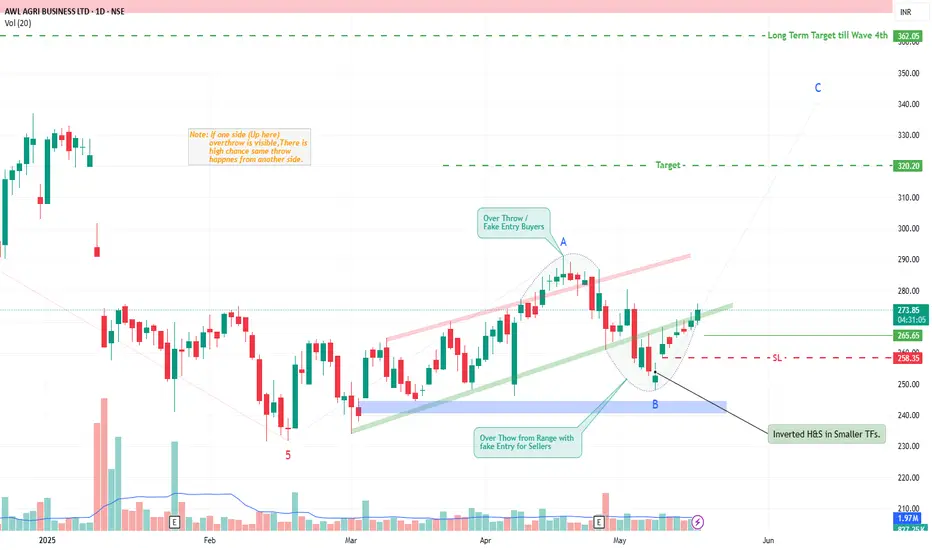
AWL Agri Business By KRS Charts 19th May 2025 / 10:42AM
Why AWL?
1. AWL was in Huge Correction mode after its first high after listed.
2. Correction path is showing clear Wave counts , finished Wave 5 downside and recently it likely in ABC Wave upside.
3. AWL was range bound for quite a time and recently shown upside overthrow (Fake Entry Buyside) from strong range and now likely same overthrow for downside also.
4. Price Action does this when some big move about to come it shakeout both Buyers & Sellers before going for final move.
5. Bullish traits like Inv. H&S and Wave counts , and Bullish Range bound is giving enough conviction to bet on this.
SL & Targets are pinned in Chart.
AWL has low P/E Ratio compared to its Industry.
Wave Count shown in Chart is rough prediction can be varied👍
Long Term Target SL will be 250 Rs.
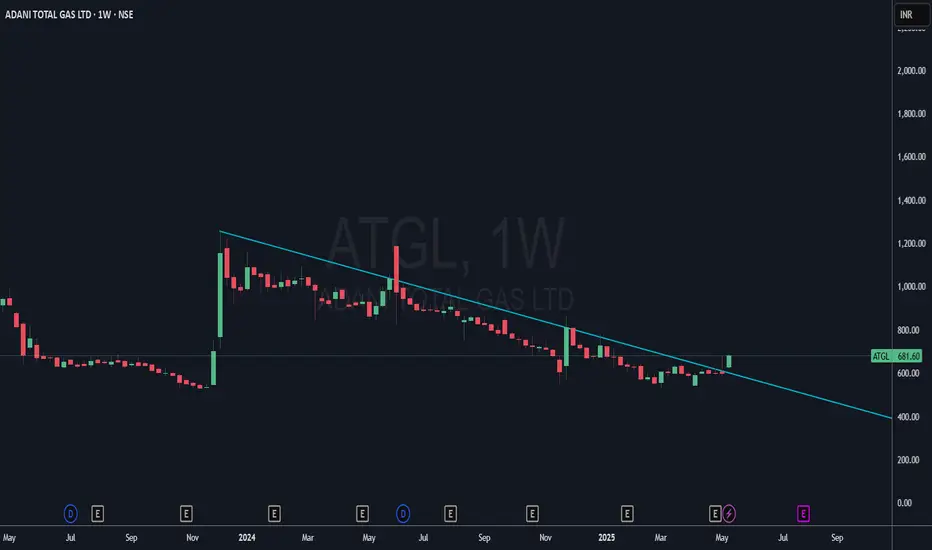
Fueling Goodness - ATGLATGL - 682
AGL is engaged in City Gas Distribution (CGD) business and supplies natural gas to domestic, commercial, industrial and vehicle users.
This is just to boost my confidence. No Suggestions for buying.
Disclosure: I am not SEBI registered. The information provided here is for educational purposes only. I will not be responsible for any of your profit/loss with these suggestions. Consult your financial advisor before making any decisions.
$NSE:NIFTY - Analysis For Tomorrow!🚨 Nifty 50 Breakout Incoming? | Symmetrical Triangle on 15-min Chart.
NSE:NIFTY is consolidating within a symmetrical triangle pattern on the 15-minute chart — a classic setup that often leads to a strong breakout or breakdown.
📊 Chart Setup:
Pattern: Symmetrical Triangle (Neutral)
Price Action: Compressing between rising support & falling resistance
View : Price nearing the tip — breakout imminent
✅ Bullish Scenario:
Breakout above 24,541
Targets: 24,666 → 24,737
✅ Watch for volume confirmation and follow-through candles
❌ Bearish Scenario:
Breakdown below 24,383
Targets: 24,186 → 24,041
❗ Confirm with a breakdown candle + failed retest
🔑 Key Support & Resistance:
Resistance: 24,541 | 24,666 | 24,737
Support: 24,383 | 24,186 | 24,041
📌 Note: Symmetrical triangles are neutral patterns. Wait for a confirmed breakout/breakdown with strong volume before entering a trade.

ADANIENT - Bulls getting ready to bump up ?????!!!Y essss!!! !
Chart patterns inculcating me the above titled opinion.
1. Monthly timeframe shows the symmetrical triangle pattern from 2020 till now, now the stock at support line(chart image shown below)
2. Weekly time frame shows us the INSIDE BAR candlestick pattern(mother baby pattern) with good volumes....with the low umtested till now.(made the low of 2025 on 22 nov 2024)
3. Daily time frame shows the Breakout attempt out of the 11 month old trendline.
4. Now, with the results on may 1, we can expect a volatile move.... .with the inverted h&s pattern around the corner.
Voluminous Entry can be made after the BREAKOUT WITH GOOD VOLUMES...
will update once the breakout happens.
Just add it to your watchlist and keep an eye on it.
THIS IS JUST MY OPINION..NOT A TIP NOR ADVICE.
Thank you .
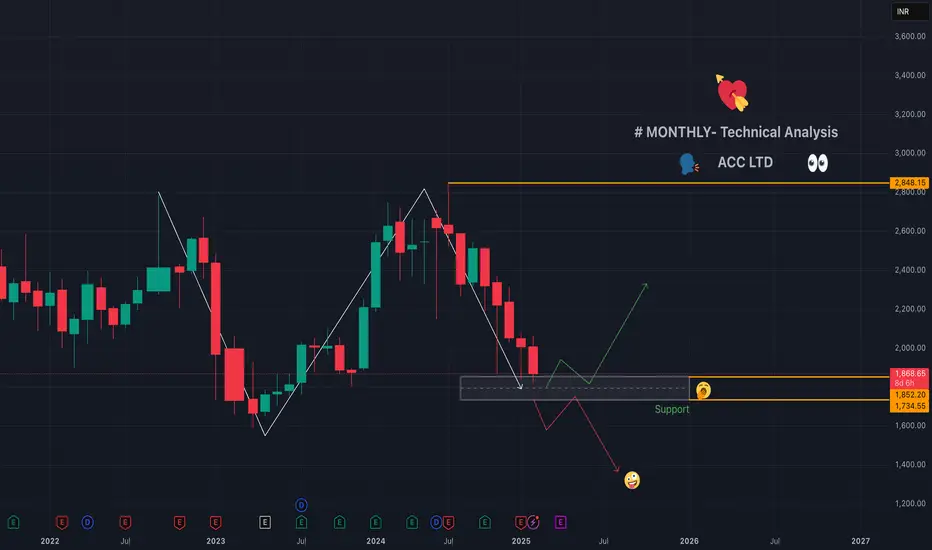
ACC LTD - Technical - Monthly Chart😍❣️#ACC Limited, founded in 1936 as Associated Cement Companies Limited, is one of India’s oldest and most prominent cement manufacturers. Headquartered in Mumbai, it became a subsidiary of the #AdaniGroup in September 2022 💕😍
📉Chart for your reference
Adani Energy Technical Overview - Monthly 👉🇮🇳#Adani Energy encompasses several entities within the Adani Group, predominantly involved in energy solutions, including power transmission, distribution, and generation. Here's an Technical 📉Chart based on the available information:

Adani's shares skyrocketed today and here's possibly why?Speculations galore around Adani group stocks!
This time around there is unconfirmed news that Adani group is raising funds from the US big shot money managers and with Trump coming in, this gets easier.
A word of caution - Avoid long-term investing in any stock on speculative news flows. Let the news confirm before making entry. Till then, you may make a quick entry & a quicker exit!
Any idea, which other shares and industry is moving higher possibly because of Trump's coming in? Watch this quick video to have this answered.

ADANI WILAMR by KRS Charts5th Nov 2024 / 9:22 AM
Why AWL ❓❓
1. Decent Fundamental and Corrected Stock Technically.
2. Even its Correcting since long time, it made HL in monthly Timeframe. Which is good sign.✅
3. Clearly 5 Wave Correction Structure is finished, One Bounce is expected till 4th Wave height from current price.
4. Upside Movement can be Sluggish it's a swing Entry so. 📈
With a Good R/R more than 1:3 Target will be 509 Rs.
with SL of 285 Rs Daily Closing Basis.

Adani Gas Retraced long swing Hello everyone,
Adani total gas jump from bottom 575 to 860 now trading at 745 retrace 38% with volume drop indicates sellers dont have strength RSI also adjusted from overbought to now near 40 ema 50 support is there good long set up for trend fibbo extension 0.61% i.e 920++

NHPCAfter a fall of 34% from the High of 118.40, it took support at 77.50 for the 4th time forming a W pattern. we can see a slight volume pump. In last 3 trading session its consolidating in a range of 80.80 to 83.40, closing above 83.40 can get quick move till 85.00 where it can face resistance.
Daily closing above 85.00 will activate W pattern and we can target for 91.50 and 95 level with SL of 83.40

Adani Ports: A Quality Company with a Strong Growth Outlook
Adani Ports , one of the Adani Group's flagship companies, has consistently proven its strength. Despite market volatility, it remains a fundamentally solid enterprise.
Key Insights:
Following the Hindenburg report in January 2023, Adani Group stocks, including Adani Ports, faced a massive crash. However, Adani Ports rebounded impressively, finding support at a previous key level and delivering over 300% returns from that point.
Recently, the stock has experienced another sharp correction due to bribery allegations. It has fallen back to a significant support zone, presenting what could be a lucrative buying opportunity for risk-tolerant investors.
Current Setup:
Stock Price: Around ₹1200 at present.
Plan: Accumulating shares down to ₹980 with a potential target price of ₹2400, offering the possibility of doubling the investment.
Risks: The stock is highly volatile, and only those comfortable with elevated risk levels should consider this opportunity. Conservative or safe traders may want to avoid this stock for now.
Why Adani Ports?
Strong Fundamentals: Adani Ports is a well-managed company with robust operations.
Attractive Valuation: The current correction brings the stock to an appealing price level for long-term investors.
Growth Potential: The company has demonstrated its ability to recover and generate substantial returns, even under challenging circumstances.
Financial Update:
For those analyzing the stock's fundamentals, here are the Q2 financial results for Adani Ports:
Consolidated Net Profit: ₹24.5 billion vs. ₹17.4 billion (YoY growth).
Final Thoughts:
Investors should make decisions based on their own risk tolerance and investment strategy. While the stock holds significant upside potential, its volatility should not be underestimated. Always do your research before investing.
Stay informed and invest wisely!

Can a Corporate Titan Withstand the Tremors of Allegations?In the high-stakes arena of global business, few narratives captivate the imagination quite like the meteoric rise and sudden turbulence of an economic powerhouse. The Adani Group once celebrated as a paragon of Indian entrepreneurial success, now finds itself navigating treacherous waters of legal scrutiny and market skepticism. What began as a remarkable journey of a diamond trader turned infrastructure magnate has transformed into a complex tale of ambition, power, and potential corporate misconduct that challenges our understanding of success in the modern economic landscape.
The allegations against Gautam Adani—ranging from securities fraud to a purported massive bribery scheme—represent more than just a corporate challenge; they symbolize a pivotal moment of reckoning for corporate governance in emerging markets. With U.S. prosecutors indicting Adani and a damaging report by Hindenburg Research accusing the group of "the largest con in corporate history," the conglomerate has witnessed a staggering $68 billion evaporation of market value. This precipitous fall from grace serves as a stark reminder that even the most seemingly invincible corporate empires can be vulnerable to the harsh light of forensic scrutiny and legal investigation.
The unfolding saga transcends the individual narrative of Gautam Adani, touching upon broader themes of economic development, political connections, and the delicate balance between entrepreneurial ambition and ethical conduct. As the Adani Group confronts these unprecedented challenges, the world watches with bated breath, understanding that the outcome will not merely determine the fate of one business empire, but potentially reshape perceptions of India's economic credibility on the global stage. The resilience, transparency, and response of the Adani Group in the face of these allegations will serve as a critical case study in corporate accountability and the complex interplay between business, politics, and regulatory oversight.
Ultimately, this narrative invites us to reflect on the fundamental principles of corporate integrity and the thin line between visionary entrepreneurship and potential systemic manipulation. As investors, policymakers, and global observers, we are compelled to ask: Can reputation, built over decades, withstand the seismic tremors of serious allegations? The Adani Group's journey offers a compelling, real-time exploration of this profound question, challenging our assumptions about success, power, and the intricate mechanisms that govern global business ecosystems.

Adani Power for 70% gainsDate: 01 Nov’24
Symbol: ADANIPOWER
Timeframe: Daily
The Big Question is - if Wave IV in Adani Power is now over? A higher high after a close above 675 will make it official. Is 570 a strong enough support? Looks like it. As seen in the chart, a circle has been marked as an accumulation zone. Wave V is likely to head to 1050 levels (70% from current price of 600); more clarity on target will emerge as it moves above 750.
Sept quarter results at operational levels were descent but because of lower other income and higher tax; Sept quarter of last FY looks stronger.
This is not a trade recommendation. Please do your own analysis.
HINGLISH VERSION
Bada savaal yah hai ki kya Adani Power mein Wave IV ab khatm ho gaya hai? 675 se upar band hone ke baad ek uchchatar oonchaee ise aadhikaarik bana degi. Kya 570 paryaapt majaboot support level hai? Aisa lagta hai. Jaisa ki chart mein dekha gaya hai, ek sarkal ko accumulation zone ke roop mein chihnit kiya gaya hai. Wave V ke 1050 ke star (600 kee maujooda keemat se 70%) tak pahunchane kee sambhaavana hai, jaise hi yah 750 se upar jaega, target par adhik spashtata saamane aaegee.
Operational star par September quarter ke nateeje achhe the. Lekin other income kam hone aur adhik tax ke kaaran; pichhale financial year ka September timaahee majaboot dikh raha hai.
Yah koi trade lene ki salah nahi hai. Kripya apana vishleshan svayan karein.

ADANI WILMAR ON SUPPORT When WILMAR falls from high and start accumulating in the bottom zone , when price go up volume also goes up but price goes down volume doesn’t. It’s shows that there is opportunity to invest in this support area . Charts price shows rectangular channel bottom price . Now if we pick up from here then we have low risk.

Adani Power getting ready for another half century (50%)?Adani Power has been in Wave iv since 3rd June’24 which could have likely gotten over with its final dip on 12th August’24. If that’s the case, where is it heading to after it breaks out from the current range? One way to look at it could be a target to the top of the channel (as seen in the chart) i.e. 1300+.
The other way is of course 5 small waves of Wave V which could culminate around 1050 (>50% from current levels of 675). Once, it moves over 800, it will leave more visuals of a target. However, a 50% plus rise from here is imminent? in 6 months?
And yes high volume also has left good hints of strong accumulation including promoter buying.
This is not a trade recommendation. Please do your own due diligence. Remember nothing in the markets is a given. Keep a close watch.

Adani Ports Inverse Head and shouldersinverse head and shoulders pattern confirmed in Adani ports.
same range can be acheived soon.

Adani Green ready for massive breakoutKeep the stock in your watch list Adani Green is going to break out the resistance area as well as the high resistance zone. Buy on the break out for the next target of 2400 and 2800 in the next few months. This is for your educational purpose only

PTC India for 65% upmoveDate: 15 Sept 2024
Timeframe: Daily Chart
PTC India is currently in Wave III of 5 which is heading to 380-400 (65% from current price of 240) in medium term as seen in the chart. Wave III is likely to end around 300 levels. High volume also supports this headroom for an up move.
This is not a trade recommendation. Please do your own due diligence and analysis.
