ADANIENT - Range Support Retest near 2280💹 Adani Enterprises Ltd (NSE: ADANIENT)
Sector: Conglomerate | CMP: 2280.00 | View: Range Support Retest near 2280
ADANIENT spent the day moving weakly, and the price behaviour was fairly simple to understand. The stock opened soft, tried to move up for a short while, but sellers stepped in around 2320–2340 and pushed it back down. After that, the price slowly fell and ended close to 2280 again. This shows that sellers were stronger throughout the day. The volumes also increased on the down-moves, which means the selling was genuine, not panic.
On bigger charts, the stock has been moving inside a wide range between 2240 at the bottom and 2600 at the top. Every time it tries to go up near 2320–2360 or even higher toward 2540–2600, it gets rejected. Since it is now close to the lower part of this range again, the stock is still sideways — not in a strong uptrend. For a beginner, the simple takeaway is: sellers are active above 2320, buyers support the stock near 2240–2280, and until one side breaks these levels, the stock will continue to move inside this range.
Today’s option activity shows that traders were expecting ADANIENT to stay within a range rather than make a big breakout. Call options (especially the 2300 CE) saw buying earlier in the day, which usually signals that some traders were hoping for an upward move if the stock stayed above support. However, not all call strikes were useful — some were too deep in the money or too far out of the money, making them less effective for quick intraday moves.
On the put side, a lot of traders were selling puts at 2280 and 2300. When traders sell puts, it usually means they believe the stock will stay above those levels. This also keeps put premiums lower, because sellers expect stability rather than a big fall. Since the price stayed near support, the put sellers had the advantage — they earned from slow premium decay.
Volatility (IV) remained moderate, meaning the market wasn’t expecting a huge jump or crash. The overall setup shows a tug-of-war: call buyers are holding on for a bounce, while put sellers are confident that 2280–2300 will act as a support zone.
In simple terms:
• If ADANIENT stays above 2280, call options may gain.
• If ADANIENT breaks below 2280, the fall may continue — but usually only after a retest confirms the breakdown.
This structure fits a typical range-bound market where both sides are active but support levels still matter.
For next session, the most important level on the chart is 2280. If the stock stays above this area, it can bounce toward 2320–2340. If it slips below 2280 and fails to get back above it, the next support lies around 2240–2250. For a bounce setup, the cleaner option is the 2300 CE — only take it if the stock holds 2280 and then climbs back above 2292–2295 on a 5 or 15-minute chart. Exit if the option premium drops around 20–25% or if the stock closes below 2275. For a breakdown setup, the safer choice is the 2260 PE, but only after the stock breaks 2280, retests it from below, and stays under 2275. Exit if the premium falls about 25–30% or if the spot goes back above 2285.
Avoid trading in the tight 2280–2298 band — price gets choppy there and option premiums decay quickly. Keep your position sizes reasonable and use strict stop-losses based on option premium, not just spot price. Watch how open interest and volumes behave — sudden changes often reveal the next move early. Overall, 2280–2300 is the fight zone. Holding it means a possible bounce; losing it opens the door to a deeper dip. Monday may be volatile in the first hour, so follow levels, watch volume, and react only after confirmation.
⚠️ STWP Legal Disclaimer
This document is strictly for educational and informational purposes. All examples, charts, levels, and option structures discussed are illustrative and are not intended as buy, sell, or hold recommendations. STWP does not provide investment advice, trading tips, signals, or personalized financial guidance of any kind, nor is it a SEBI-registered intermediary or research analyst. The analyses, illustrations, and risk–reward structures included here are generic in nature and based on publicly available data and observed market behaviour, which may change without notice. Financial markets involve significant risk; derivatives in particular carry the potential for substantial losses. Option premiums, implied volatility, open interest, delta, and other market variables can fluctuate rapidly and unpredictably.
Readers are solely responsible for their trading decisions, capital management, and risk assessment. Before making any investment or trading decision, please consult a SEBI-registered investment advisor. STWP, its representatives, and affiliates shall not be liable for any direct or indirect loss arising from the use of this material. Historical patterns or past market behaviour do not guarantee future outcomes, nor should any part of this document be interpreted as a promise of performance, accuracy, or returns.
Position Status: No active position in this instrument at the time of analysis.
Data Source: TradingView & NSE India.
💬 Found this useful?
🔼 Boost this post to support structured learning
✍️ Share your thoughts or questions in the comments
🔁 Forward this to traders who value clean technical studies
👉 Follow for disciplined, structured, STWP-style analysis
🚀 Stay Calm. Stay Clean. Trade With Patience.
Trade Smart | Learn Zones | Be Self-Reliant 📊
Adanienterprises

Adani Enterprises Shares Jump After Fundraising - Chart AnalysisAdani Enterprises Limited – Technical Chart Analysis and Stock Update (November 2025)
Adani Enterprises shares surged by more than six percent today as investor sentiment turned positive following the company’s announcement of a massive Rs 24,930 crore rights issue.
This move marks the company’s biggest fundraising effort since its cancelled follow-on public offering (FPO) in 2023.
Over the last five years, Adani Enterprises has delivered a remarkable gain of more than 540 percent, reflecting strong growth across its infrastructure, energy, and renewable business segments.
The company continues to attract long-term investors due to its aggressive expansion strategy and focus on large-scale projects.
Technical View:
On the daily chart, Adani Enterprises is currently trading near Rs 2,484, showing a sharp upward recovery from its recent lows. The stock recently took support from the **Trend Line Support Zone** around Rs 2,350 – Rs 2,400 and has rebounded strongly with healthy volume.
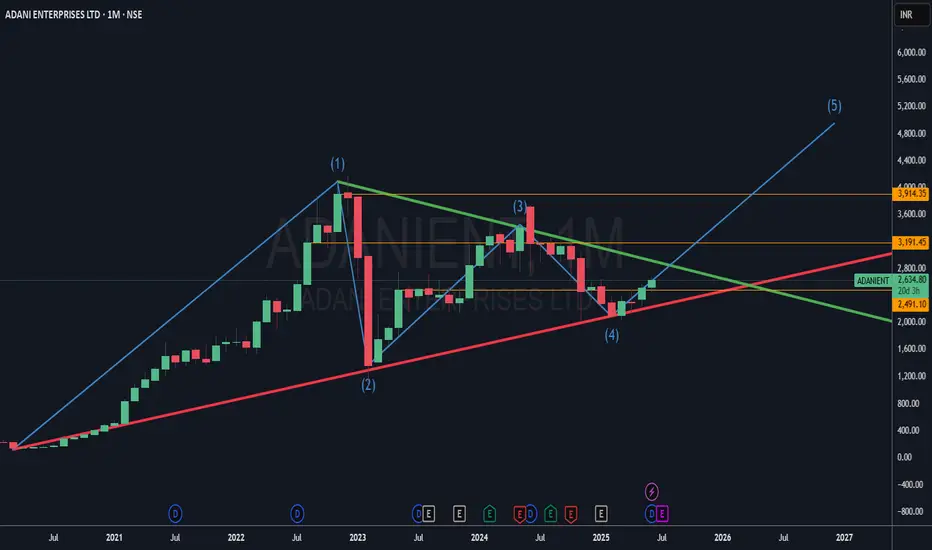
The chart indicates a consolidation pattern between Support-1 (Rs 1,935 – Rs 2,013) and Resistance-1 (Rs 2,692 – Rs 2,769). A sustained move above Rs 2,770 could trigger further upside momentum toward the first target of Rs 2,990, as mentioned in the chart.
If the breakout above Resistance-1 is successful, the next key zones to watch will be Resistance-2 (Rs 3,252 – Rs 3,335) and Major Resistance (Rs 3,759 – Rs 3,914). These levels may act as potential profit-booking areas or supply zones in the short term.
On the downside, Support-1 remains a crucial base for the stock. Any closing below Rs 1,935 could invite weakness and may push the price toward the Major Support Zone near Rs 1,042 – Rs 1,159.
Pattern Observation:
Earlier this year, Adani Enterprises formed an upward channel pattern and later experienced a channel breakdown, leading to a corrective phase. However, the recent rebound from the lower trend line and today’s strong price action suggest renewed buying interest at lower levels.
The range between Support-1 and Resistance-1 currently acts as a consolidation zone , and a breakout from this zone could decide the next directional move for the stock.
Summary:
Current Market Price: Around Rs 2,484
Immediate Support: Rs 2,013 – Rs 1,935
Immediate Resistance: Rs 2,692 – Rs 2,769
Next Target (on breakout): Rs 2,990
Medium-Term Resistances: Rs 3,252 – Rs 3,914
Major Support: Rs 1,042 – Rs 1,159
Bias: Positive above Rs 2,770; neutral within the consolidation zone
Conclusion:
Adani Enterprises remains in focus after announcing its large-scale rights issue, signaling strong capital expansion plans.
From a technical perspective, the stock is trading near an important support trend line, and momentum indicators suggest potential strength if it sustains above Rs 2,770.
A breakout could open the path for a short-term rally, while strong supports below Rs 2,000 provide cushion for investors.

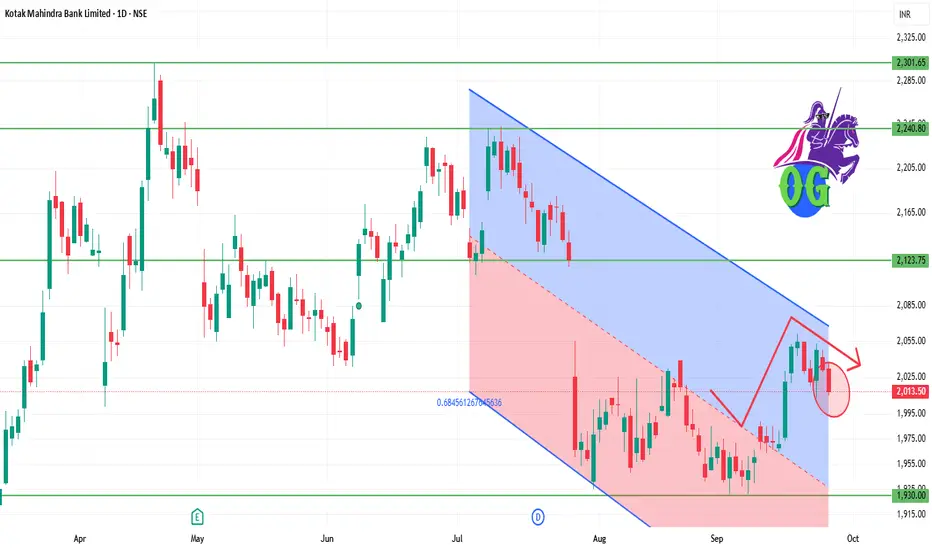
KOTAKBANK 1D Time frame📊 Daily Snapshot
Closing Price: ₹2,013.60
Day’s Range: ₹2,012.50 – ₹2,031.30
Previous Close: ₹2,031.30
Change: Down –0.72%
52-Week Range: ₹1,679.00 – ₹2,302.00
Market Cap: ₹4.04 lakh crore
P/E Ratio: 21.09
Dividend Yield: 0.12%
EPS (TTM): ₹96.30
Beta: 0.80 (indicating lower volatility)
🔑 Key Technical Levels
Immediate Support: ₹2,000.00
Immediate Resistance: ₹2,030.00
All-Time High: ₹2,302.00
📈 Technical Indicators
RSI (14-day): 45.2 – indicating a neutral condition.
MACD: Negative, suggesting bearish momentum.
Moving Averages: Trading below the 50-day and 200-day moving averages, indicating a bearish trend.
📉 Market Sentiment
Recent Performance: Kotak Mahindra Bank's stock declined by 0.72% on September 25, 2025, underperforming the broader market.
Volume: Trading volume was significantly lower than its 50-day average, indicating decreased investor activity.
📈 Strategy (1D Timeframe)
1. Bullish Scenario
Entry: Above ₹2,030.00
Stop-Loss: ₹2,000.00
Target: ₹2,050.00 → ₹2,070.00
2. Bearish Scenario
Entry: Below ₹2,000.00
Stop-Loss: ₹2,030.00
Target: ₹1,980.00 → ₹1,960.00
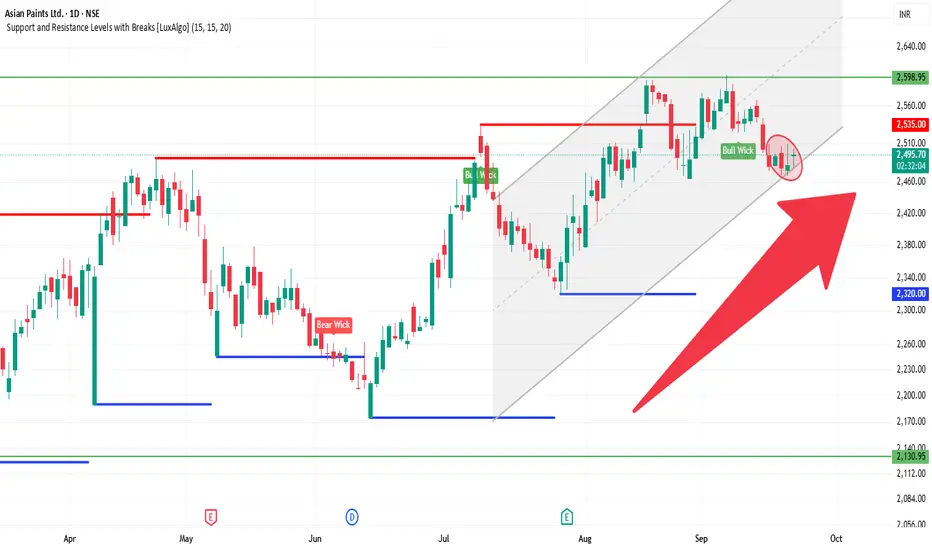
ASIANPAINT 1D Time frame🔍 Current Status
The stock is trading around ₹2,490 – ₹2,500
Recent price action has been somewhat mixed — not a strong trend, some resistance in higher zones.
🧮 Trade Strategy Ideas
Long Setup:
If price holds above ~₹2,460 and shows reversal candlestick or volume strength.
Target resistance around ₹2,505-₹2,528.
Stop-loss could be placed just below ₹2,440 or so (to protect against breakdowns).
Short / Pullback Setup:
If price gets rejected near resistance around ₹2,505-₹2,528 and bearish candlestick forms.
Potential downside toward ~₹2,460 first, then further to ~₹2,420.
Breakout Setup:
If price breaks above ~₹2,528 with good volume, could aim for ~₹2,546 or higher.
Must confirm with strength / follow-through.
✅ Summary: Asian Paints is in a consolidation / neutral phase. Key to watch is how it reacts around the resistance zone ~₹2,505-₹2,528. Holding above support ~₹2,460 is important. A clear breakout gives upside, else downside risk remains.
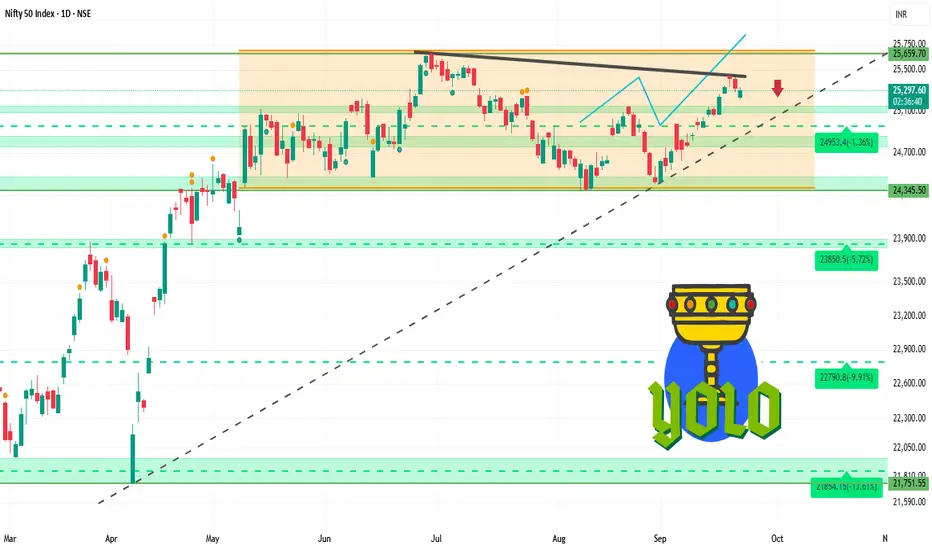
NIFTY 1D Time frame🔍 Current Market Snapshot
Current Level: ₹25,292.45
Day’s Range: ₹25,211.60 – ₹25,331.70
Previous Close: ₹25,327.05
Market Sentiment: Neutral to mildly bearish
📊 Technical Indicators
Moving Averages: The Nifty 50 index is trading slightly below its short-term moving averages, indicating potential resistance.
RSI (14): Approximately 50, suggesting a neutral stance with no clear overbought or oversold conditions.
MACD: Neutral, with the MACD line and signal line close together, indicating indecision in market momentum.
Stochastic Oscillator: Neutral, fluctuating around the midline, reflecting a lack of strong directional movement.
🧮 Strategy / Trade Ideas
Long Setup:
Entry: Consider entering near support levels (~₹25,200) if bullish reversal signals appear.
Stop Loss: Place below ₹24,800 to manage risk.
Target: First resistance around ₹25,400, then ₹25,700.
Short Setup:
Entry: If price fails to break above resistance (~₹25,400) and shows signs of reversal.
Stop Loss: Above ₹25,800.
Target: Downside toward ₹25,200, then ₹24,900.
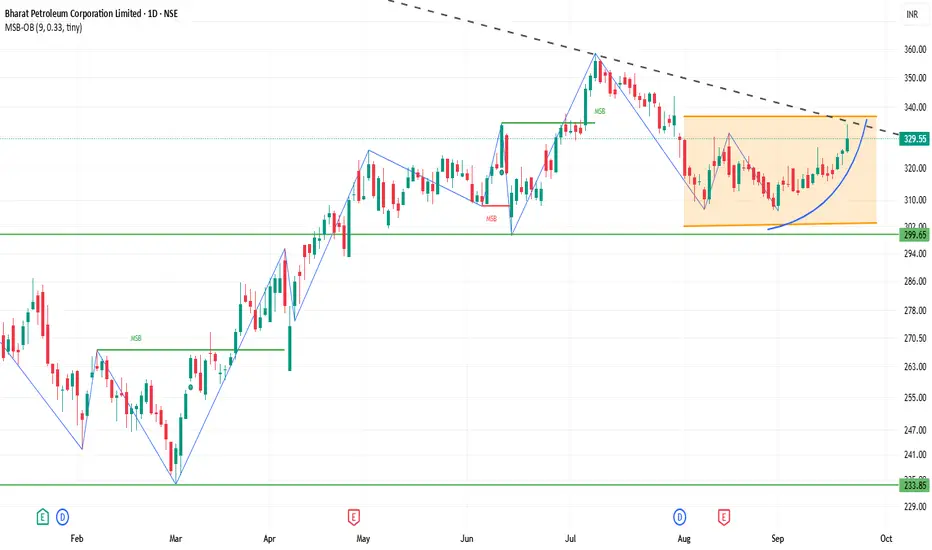
BPCL 1D Time frame📊 Current Snapshot
Closing Price: ₹329.55
Day's Range: ₹324.80 – ₹334.00
52-Week Range: ₹234.01 – ₹376.00
Market Capitalization: ₹1,42,975 Crores
Volume: Approximately 10 million shares traded
P/E Ratio: 8.14
Dividend Yield: 2.99%
⚙️ Technical Indicators
Relative Strength Index (RSI): 60.31 – Neutral to slightly bullish
Moving Average Convergence Divergence (MACD): 0.29 – Neutral
Moving Averages: Short-term averages (5, 10, 20, 50, 100, 200-day) are above the current price, indicating potential resistance.
Pivot Points: Central pivot around ₹322.30, suggesting a balanced market sentiment.
🎯 Possible Scenarios
Bullish Scenario: A breakout above ₹328.25 with strong volume could target ₹331.80 and higher levels.
Bearish Scenario: Failure to hold above ₹325.85 may lead to a decline toward ₹322.30.
⚠️ Key Considerations
Market Sentiment: BPCL has shown strong performance recently, but broader market conditions can impact its movement.
Volume Analysis: Watch for volume spikes to confirm breakout or breakdown signals.
Technical Indicators: While the RSI indicates a neutral to slightly bullish stance, the MACD and moving averages suggest caution.
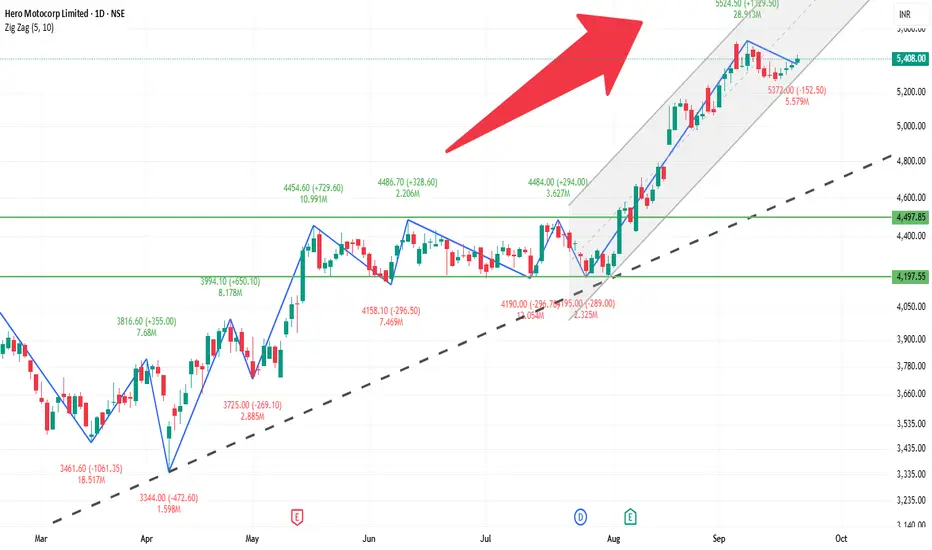
HEROMOTOCO 1D Time frameCurrent Price: 5,408 (near recent highs).
Current Trend: Strong bullish momentum; stock is trading above key resistances.
Support Zone: Immediate support at 5,300 – 5,350. If this holds, uptrend remains intact.
Resistance Zone: Next resistance is around 5,500 – 5,550. A breakout above this can push toward 5,650+.
Indicators: Daily candle structure is bullish, showing higher highs and strong buying interest.
Outlook:
Above 5,500 → continuation of bullish rally.
Below 5,300 → minor weakness; may slip toward 5,200.
👉 In short (with 5,408 price):
Bullish tone.
Range to watch: 5,300 – 5,550.
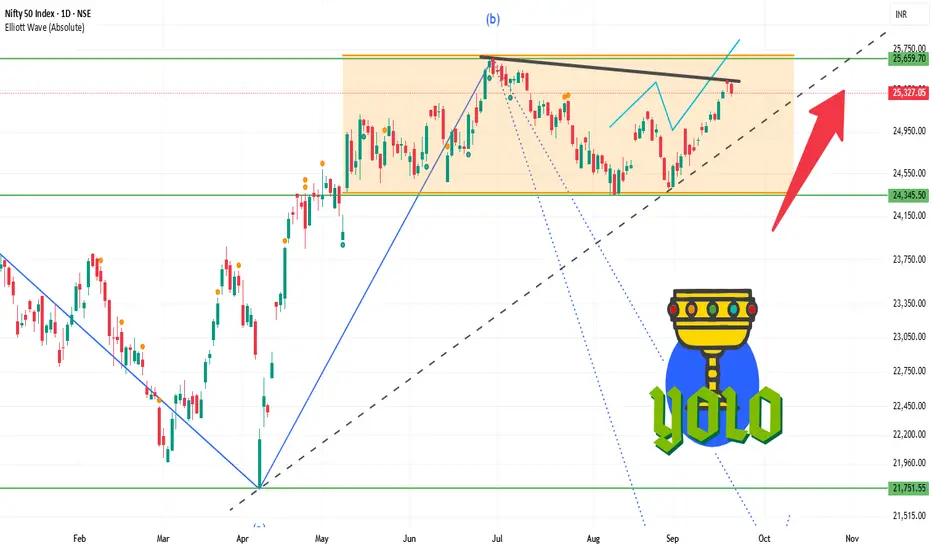
NIFTY 1D Time frameCurrent Trend: Market is moving sideways with limited momentum.
Support Zone: Strong support is around 25,200 – 25,250; bounce is possible from here.
Resistance Zone: If NIFTY sustains above 25,350 – 25,400, fresh upward momentum may come.
Indicators: Daily candle shows buyers are slightly in control, but resistance breakout is important.
Outlook: As long as NIFTY holds above 25,200, the uptrend remains safe. A close above 25,400 can trigger new buying.
👉 In short:
Sideways to bullish tone.
Weakness below 25,200, strength above 25,400.
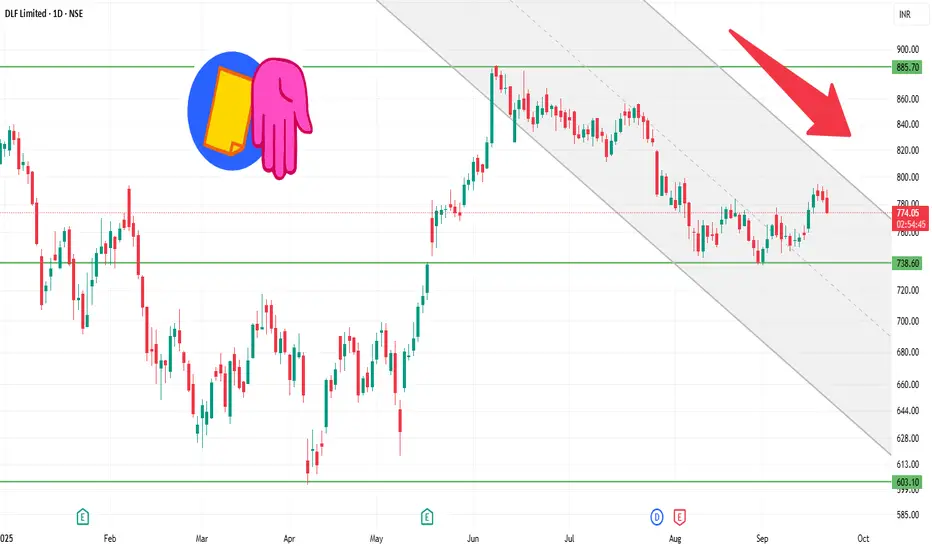
DLF 1D Time frameCurrent
Price: ₹783.10 (as of last close)
52-Week Range: ₹601.20 – ₹929.00
Market Cap: ₹1.94 lakh crore
P/E Ratio: 43.26 (lower than sector average)
EPS (TTM): ₹18.12
Dividend Yield: 0.77%
Debt-to-Equity: 0.10 (very low)
ROE: 10.76%
ROCE: 6.51%
⚙️ Technical Indicators
RSI (14-day): 56.38 — Neutral to slightly bullish.
MACD: 4.28 — Positive, supporting bullish momentum.
Moving Averages: Trading above both 50-day and 200-day EMAs, indicating a long-term uptrend.
Trend Rating: Strong Buy, according to daily technical analysis.
📈 Short-Term Outlook
Bullish Scenario:
Entry: Above ₹800 with strong volume.
Targets: ₹820–₹825, ₹840–₹850.
Stop Loss: ₹780.
Bearish Scenario:
Entry: Below ₹780 with confirmation.
Targets: ₹760–₹765, ₹740–₹745.
Stop Loss: ₹800.
⚠️ Risks
Breakdown below ₹780: Could lead to a short-term correction toward ₹760–₹765.
Failure to break above ₹800: May result in consolidation or minor pullback.
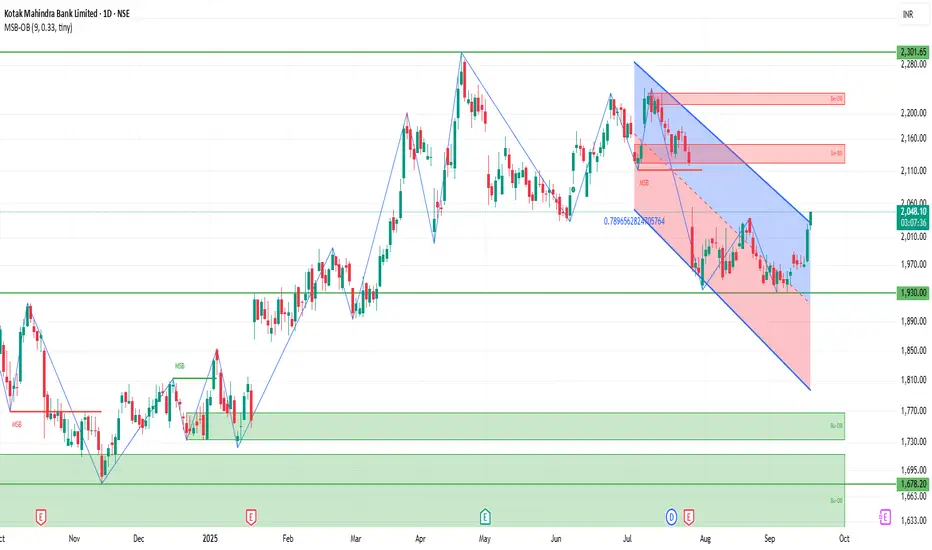
KOTAKBANK 1D Time frameCurrent Stock Price
Current Price: ₹2,045.60
Day’s Range: ₹2,020.30 – ₹2,045.60
52-Week Range: ₹1,679.05 – ₹2,301.90
Market Cap: ₹4.05 lakh crore
P/E Ratio (TTM): 20.47
EPS (TTM): ₹96.30
Dividend Yield: 0.12%
Book Value: ₹740.29
📈 Trend & Outlook
Short-Term Trend: Bullish; the stock is trading above key support levels and showing positive momentum.
Resistance Levels: ₹2,045.60 (day’s high), ₹2,301.90 (52-week high).
Support Levels: ₹2,020.30 (day’s low), ₹2,000.00 (psychological support).
Investor Sentiment: Positive, with strong institutional interest and favorable analyst outlooks.
🧭 Analyst Insights
Valuation: The stock is trading at a P/E ratio of 20.47, which is slightly above the sector average of 19.82, indicating a premium valuation.
Growth Prospects: The bank's strong earnings growth and robust capital position support its premium valuation.
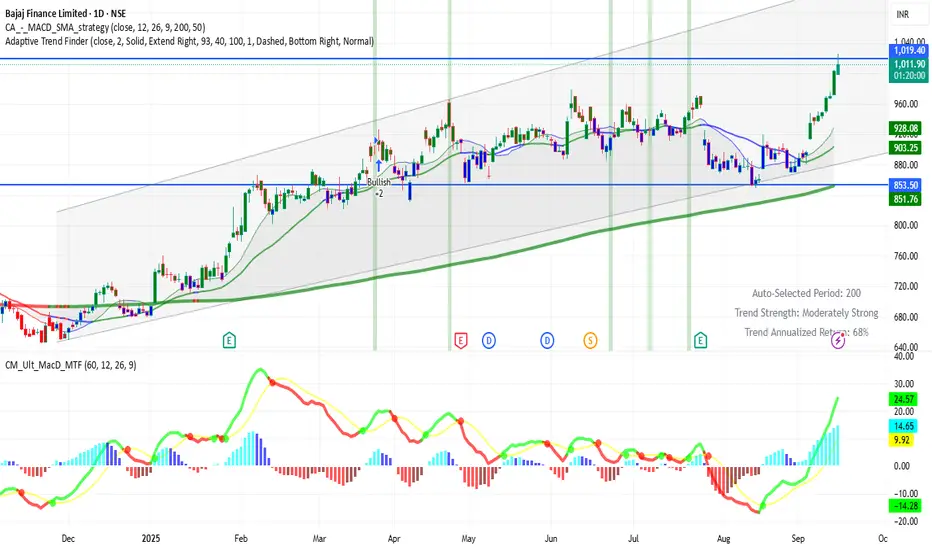
BAJFINANCE 1D Time frame
Current Price: ₹1018 (approx)
Day’s Range: ₹998 – ₹1,025.70
Previous Close: ₹970.25
🔹 Support & Resistance
Support 1: ₹981 – ₹960
Support 2: ₹947 – ₹934
Resistance 1: ₹1,030
Resistance 2: ₹1,049
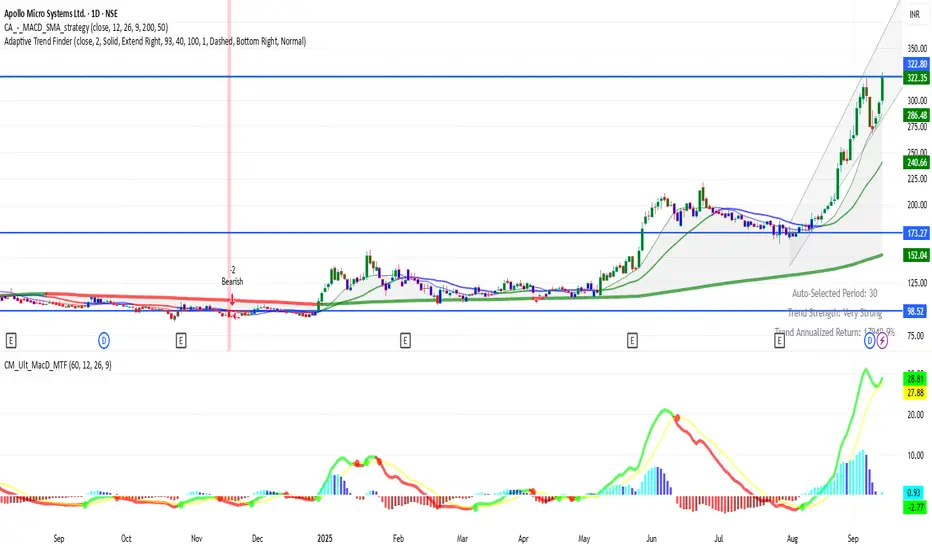
APOLLO 1D Time frame Current Status
Price: ₹322
Trend: Strong uptrend, stock recently made fresh highs.
Momentum: Very strong, but slightly overbought in daily indicators.
Key Levels
Immediate Resistance: ₹326 – ₹330 (recent high zone)
Next Resistance: ₹340 – ₹345 (if breakout continues)
Immediate Support: ₹300 – ₹305
Stronger Support: ₹280 – ₹285
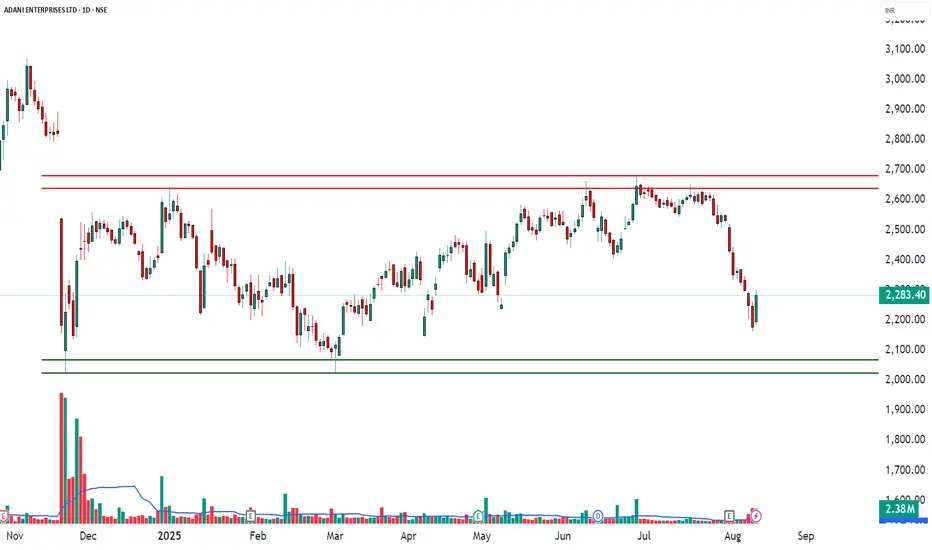
ADANIENT – Options Trade Snapshot📄 ADANIENT – Options Trade Snapshot (Educational Analysis)
Date: 12 Aug 2025
Spot Price: ₹2,283.40
Market View: Bullish bias based on option data & price structure
Overall Sentiment: Positive – multiple Call short coverings and fresh Put short build-ups
Volatility (IV): 34.5% – 51.4% (moderate–high, suggesting option premiums are relatively elevated)
Analysis Purpose: For market study & understanding of option chain signals
1️⃣ Observed Bullish Setup – 2300 Call Option
LTP: ₹64.05
Breakeven (for understanding): ₹2,364.05
Notable Data Points:
Volume spike: 22,099 contracts (166% higher than usual)
IV decreased while price increased → generally indicates aggressive buying
Delta ~0.5 → option price moves about ₹0.50 for every ₹1 in underlying
2️⃣ Observed Neutral-to-Bullish Setup – 2250 Put Option
LTP: ₹51.55
Breakeven (for understanding): ₹2,198.45
Notable Data Points:
Large open interest addition (+105,600 contracts / +47.5%)
Many traders appear to be expecting price to remain above 2250
Theta ~ -2.84/day → higher time decay benefits sellers in such positions
3️⃣ Observed Bullish Spread Structure – 2300 CE + 2400 CE
Leg 1: 2300 CE @ ₹64.05
Leg 2: 2400 CE @ ₹28.40 (short)
Net Cost (for study): ₹35.65
Maximum Risk: ₹6,238.75 (per lot)
Maximum Reward: ₹11,261.25 (per lot)
Breakeven Level: ₹2,335.65
Why:
Limits risk vs naked CE buy while keeping upside potential until 2400.
OI data supports bullish trend above 2300, resistance near 2400.
Lower IV on CE side helps spread entry.
Suitable for moderate upside with controlled risk.
📘 My Trading Setup Rules
Avoid Gap Plays
→ Check pre-open price action to avoid trades influenced by gap-ups/gap-downs.
Breakout Entry Only
→ Enter trades only if price breaks previous day’s High (for bullish trades) or Low (for bearish trades).
Watch Volume for Confirmation
→ Monitor volume closely. No volume = No trade.
Enter on Strong Candle + Volume
→ Execute the trade only if a strong candle appears with increasing volume in the direction of the trade.
Defined Risk:Reward Only
→ Take trades only if R:R is favorable (ideally ≥ 1:2).
Premium Disclaimer
→ Option premiums shown are based on EOD prices — real-time premiums may vary during execution.
Time Frame Preference
→ Trade with your preferred time frame — this strategy works across intraday or positional setups.
Disclaimer:
This analysis is for educational and informational purposes only and is not investment advice. The data presented is based on publicly available market information and represents a study of price action and option chain behaviour. Trading in securities/derivatives involves substantial risk, and past performance is not indicative of future results. Please consult your SEBI-registered investment advisor before making any investment or trading decisions.
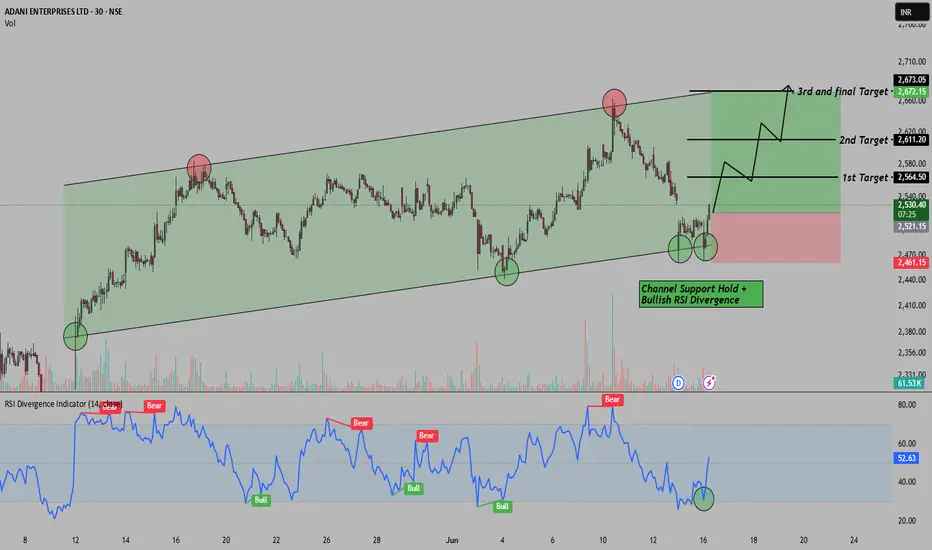
Rising Channel+RSI Divergence=Reversal Setup in Adani EnterpriseHello Everyone, i hope you all will be doing good in your life and your trading as well. Today i have brought a setup in Adani Enterprises , where we’re spotting a short-term reversal opportunity inside a clean rising channel . Price recently tested the channel support for the 3rd time and gave a solid bounce, which is also confirmed by a bullish RSI divergence . This combo often works as a reliable early reversal signal for positional or intraday swing traders. Here we are expecting at least 4%+ move behalf of this setup.
This trade is completely logic based so i placed Stop loss around 2461 for controlled risk. for the targets please check the chart above i have mention there.
Reward-to-Risk Ratio looks favorable here , especially with clear trend structure and momentum support from RSI. Let’s see how this setup plays out!
If you liked this breakdown, don’t forget to LIKE & FOLLOW for more real chart setups, data-backed ideas, and smart money zones.
Disclaimer: This post is for educational purposes only. Do your own research or consult a financial advisor before investing.
Thinking big. Doing better - "Hum Karke Dikhate Hain"Adani Enterprises Ltd - CMP - 2636
About
Adani Enterprises Ltd has business interests in various economic areas such as mining, integrated resources management (IRM), infrastructure such as airports, roads, rail/ metro, water, data centres, solar manufacturing, agro and defence.
This is just to boost my confidence. No Suggestions for buying. I will keep checking and updating my mistake if last post gone wrong...
Disclosure: I am not SEBI registered. The information provided here is for educational purposes only. I will not be responsible for any of your profit/loss with these suggestions. Consult your financial Adviser before making any decisions.
ADANIENT (Adani Enterprises)ADANIENT has been consolidating from a long time. After tapping at demand zone it started making higher high-higher lows formation and now at resistance level.
Breakout from here may give a really good move, keep eyes on it.
✅ If you like my analysis, please follow me as a token of appreciation :)
in.tradingview.com/u/SatpalS/
📌 For learning and educational purposes only, not a recommendation. Please consult your financial advisor before investing.

ADANIENT - Bulls getting ready to bump up ?????!!!Y essss!!! !
Chart patterns inculcating me the above titled opinion.
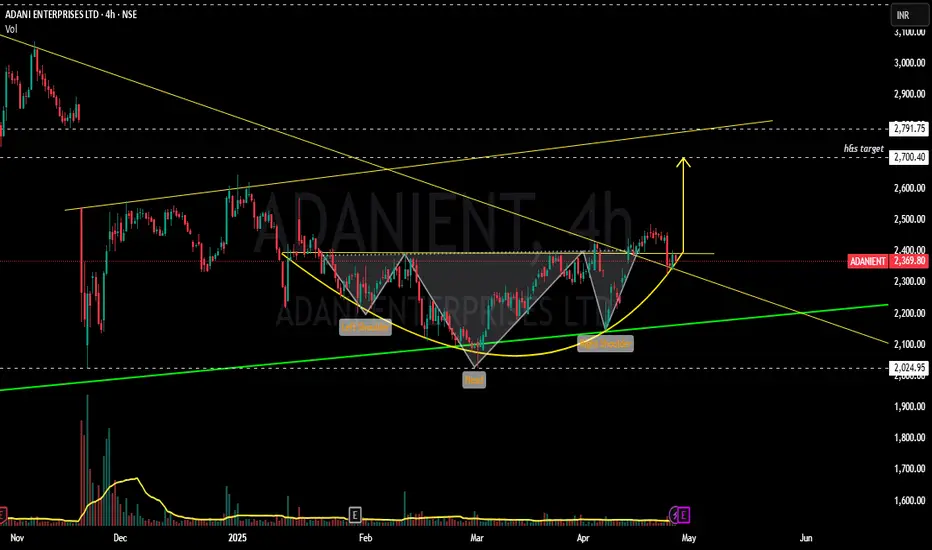
1. Monthly timeframe shows the symmetrical triangle pattern from 2020 till now, now the stock at support line(chart image shown below)
2. Weekly time frame shows us the INSIDE BAR candlestick pattern(mother baby pattern) with good volumes....with the low umtested till now.(made the low of 2025 on 22 nov 2024)
3. Daily time frame shows the Breakout attempt out of the 11 month old trendline.
4. Now, with the results on may 1, we can expect a volatile move.... .with the inverted h&s pattern around the corner.
Voluminous Entry can be made after the BREAKOUT WITH GOOD VOLUMES...
will update once the breakout happens.
Just add it to your watchlist and keep an eye on it.
THIS IS JUST MY OPINION..NOT A TIP NOR ADVICE.
Thank you .
Adani Energy Technical Overview - Monthly 👉🇮🇳#Adani Energy encompasses several entities within the Adani Group, predominantly involved in energy solutions, including power transmission, distribution, and generation. Here's an Technical 📉Chart based on the available information:

Adanient bullish flagAdanient formed bullish flag on buy side in 15 mins. Expected to reach target tomorrow. Keep in mind 15 mins formation may not work and watch it for study purposes

Hard trade on AdaniENT- neckline is too broadIs the stock ready to give a solid breakdown again? With such a broad neckline and the inherent volatility of Adani Enterprises post-Hindenburg, traders need to be cautious. This pattern suggests a significant move could be coming, but whether it will break down further or consolidate depends largely on how the market digests both technical levels and any further fundamental developments around the company.

Adani ENterpriseHindenburg Research on August 10 released a new report alleging market watchdog Sebi chairperson Madhabi Buch. The report alleged that Madhabi and her husband Dhaval Buch were involved in Adani Group's offshore funds. The report said that these obscure financial systems were allegedly used in the “money siphoning scandal."
The Stock is already finding pressure to cross 3300 mark.
I personally feel if the sentiment worsons then its an opportunity to buy...
Below 3127 on closing basis it will find more pressure for profit booking...
Support levels are marked for entry
Now 3360-70 will act as strong resistance short term (couple of months)
Happy Trading.

Adani Enterprises Levels For 12 August-14 AugustImportant support and Resistance Levels For Adani Enterprises.
When Market touches the level, the price action plays important roles.
For More Learning Reach out to us.

ADANIENTERPRISES TRENDLINE RESISTANCE BREAKOUTAdanienterprises breaking a trendline
with good volume
#target can be 3600-4000
EDUCATIONAL IDEA
