Advanced Strategies & Market Microstructure1. Understanding Market Microstructure
Market microstructure refers to the study of the processes and outcomes of exchanging assets under explicit trading rules. It examines how the design of markets, order types, transaction costs, and participant behaviors influence price formation and liquidity. Key components include:
Order Types and Order Books:
Limit Orders: Orders placed to buy or sell at a specific price or better. They contribute to market liquidity but may not be executed immediately.
Market Orders: Orders executed immediately at the best available price. They consume liquidity and can cause price impact.
Stop Orders: Orders triggered when a specific price is reached, often used for risk management.
Order Book Dynamics: The limit order book represents the supply (asks) and demand (bids) at various price levels. Advanced traders analyze order book imbalances to anticipate short-term price movements.
Liquidity and Depth:
Liquidity refers to how easily an asset can be bought or sold without significantly impacting its price.
Depth measures the volume of buy and sell orders available at each price level in the order book. Greater depth reduces price volatility for large trades.
Market Participants:
Retail Traders: Typically trade smaller volumes and are often more reactive to news.
Institutional Traders: Manage large portfolios, often using sophisticated algorithms to minimize market impact.
Market Makers: Provide liquidity by continuously quoting bid and ask prices, profiting from the spread.
High-Frequency Traders (HFTs): Use ultra-fast algorithms to exploit tiny inefficiencies and respond to market signals in milliseconds.
Price Formation and Efficiency:
Prices are influenced by both the fundamental value of an asset and the microstructure effects such as order flow, transaction costs, and latency.
Bid-ask spreads, adverse selection, and order anticipation can create temporary mispricings, offering opportunities for advanced strategies.
2. Advanced Trading Strategies
Advanced trading strategies often exploit subtle features of market microstructure. These strategies are quantitative in nature, often automated, and rely on rigorous risk management.
Algorithmic Trading:
Algorithms automate trade execution to improve efficiency and reduce market impact.
Common algorithmic strategies include:
VWAP (Volume Weighted Average Price): Executes trades in line with historical volume patterns to minimize market impact.
TWAP (Time Weighted Average Price): Spreads trades evenly over time to avoid influencing the market.
Implementation Shortfall Algorithms: Optimize trade execution by balancing the trade-off between market impact and opportunity cost.
Statistical Arbitrage:
Exploits temporary price discrepancies between related securities.
Examples include:
Pairs Trading: Long one security and short another correlated security when the spread deviates from its historical mean.
Index Arbitrage: Exploits differences between the price of an index and its constituent stocks.
Requires sophisticated models to account for transaction costs, slippage, and risk exposure.
Liquidity Provision and Market Making:
Market makers profit from the bid-ask spread while managing inventory risk.
Advanced market-making strategies use predictive models to adjust quotes dynamically, considering order book imbalances, volatility, and competitor activity.
Momentum and Trend-Following Strategies:
Focus on capturing price trends over short or intermediate time horizons.
Microstructure signals such as large trade imbalances, sudden order book depletion, or unusual volume spikes often trigger entries or exits.
Requires careful attention to execution speed and transaction costs.
High-Frequency Trading (HFT) Strategies:
Leverage extremely low-latency infrastructure to capture opportunities that exist for milliseconds.
Examples include:
Latency Arbitrage: Exploiting delays in price updates across exchanges.
Quote Stuffing: Temporarily overwhelming competitors’ algorithms with large numbers of orders (controversial and regulated).
Sniping and Pinging: Detecting large hidden orders by sending small test orders.
Dark Pool Strategies:
Dark pools are private trading venues where orders are not displayed publicly.
Advanced traders use tactics such as iceberg detection (identifying hidden large orders) or dark-to-light routing to execute trades without revealing intentions to the broader market.
3. Risk Management in Advanced Strategies
Even sophisticated strategies are exposed to significant risk. Microstructure-based trading faces unique challenges, including:
Execution Risk: Poor timing or large trades can move the market against the trader.
Latency Risk: Delays in market data or execution can erode profits, especially in high-frequency trading.
Adverse Selection: Trading against better-informed participants can lead to losses.
Inventory and Position Risk: Market makers and liquidity providers must carefully manage holdings to avoid overexposure.
Regulatory Risk: Algorithmic and HFT strategies are heavily regulated to prevent market manipulation.
Advanced risk management techniques involve dynamic hedging, stop-loss protocols, portfolio diversification, and real-time monitoring of order book conditions.
4. Technology and Infrastructure
Advanced strategies are heavily dependent on cutting-edge technology:
Low-Latency Networks: Minimize transmission delays between exchanges and trading servers.
Co-location Services: Traders place servers physically close to exchange matching engines for faster execution.
Big Data and AI: Machine learning models analyze market patterns, predict short-term movements, and adapt strategies in real time.
Quantitative Analytics: Statistical models and simulations assess the profitability and risk of various execution tactics.
5. Market Microstructure Implications for Strategy Design
Understanding market microstructure is crucial for designing strategies that are both profitable and sustainable:
Spread and Transaction Cost Analysis: Strategies must account for bid-ask spreads, fees, and slippage.
Order Book Dynamics: Anticipating where liquidity will appear and disappear can optimize entry and exit points.
Information Asymmetry: Awareness of informed vs. uninformed order flow can improve trade timing.
Volatility and Market Impact Models: Predicting how trades influence price ensures minimal adverse impact on execution.
Regulatory Compliance: Algorithms must adhere to rules on market manipulation, quote behavior, and reporting obligations.
6. Future Trends in Market Microstructure and Strategy
The field continues to evolve rapidly due to technological innovation and regulatory developments:
AI-Driven Execution: Adaptive algorithms that learn market patterns in real time.
Cross-Asset and Cross-Market Arbitrage: Exploiting inefficiencies across asset classes and global exchanges.
Decentralized Finance (DeFi) Microstructure: Applying traditional market microstructure concepts to blockchain-based exchanges and automated market makers.
Sustainable and ESG-Informed Trading: Incorporating environmental and social factors into trading strategies.
Conclusion
Advanced trading strategies and market microstructure are deeply intertwined. Microstructure provides insights into how trades are executed, how liquidity and prices behave, and how different participants interact. By leveraging this knowledge, sophisticated traders can design strategies that optimize execution, manage risk, and exploit inefficiencies. In a competitive and technologically evolving market, the ability to integrate microstructure insights with algorithmic execution is often what separates consistently profitable traders from the rest. Understanding these dynamics is not just an academic exercise—it is a practical necessity for anyone looking to succeed in modern financial markets.
Advancedpatterns

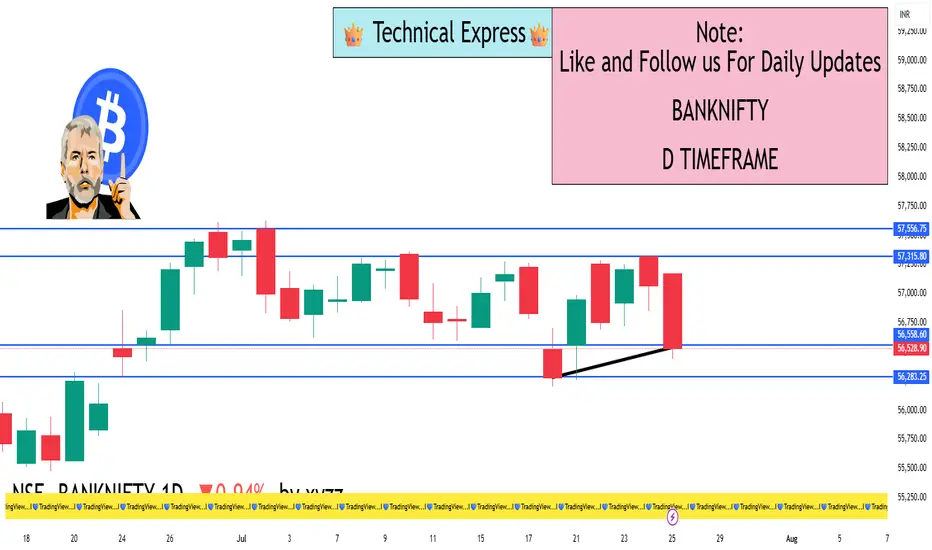
BANKNIFTY 1D TimeframeClosing Value: 56,528.90
Net Change: −537.15 points (−0.94%)
Opening Price: 57,034.40
Day’s High: 57,170.70
Day’s Low: 56,439.40
Trend: Bearish
📊 Technical Analysis
✅ Candle Pattern:
A strong bearish candle was formed.
Price opened higher but failed to sustain and closed near the day’s low — a sign of heavy intraday selling.
🔻 Support Zones:
56,400 – Immediate support (also the day's low)
56,000 – Psychological round number
55,750 – Medium-term support (from earlier price consolidation)
🔺 Resistance Zones:
56,800 – Near-term resistance
57,000 – Critical level; needs to be reclaimed for bullish reversal
57,300 – Stronger resistance zone based on recent highs
📈 Indicator Summary:
RSI (Relative Strength Index): Likely below 50, signaling weakening bullish momentum
MACD (Moving Average Convergence Divergence): Bearish crossover remains intact
Volume: Higher than average, suggesting institutional selling pressure
🧠 Market Sentiment:
Bearish sentiment prevailed across major banks including HDFC Bank, ICICI Bank, Axis Bank, Kotak Bank, and SBI
Pressure also visible in PSU banks (like PNB, Bank of Baroda, Canara Bank)
Overall market mood was risk-averse due to global uncertainty and potential interest rate impact
Foreign Institutional Investors (FIIs) continued their selling streak
Traders remain cautious ahead of upcoming quarterly bank results
✅ Conclusion:
Bank Nifty is currently in a short-term downtrend.
If 56,400 breaks decisively, it may head toward 56,000 and 55,750.
For bulls to regain strength, Bank Nifty must cross back above 57,000 with strong volume and momentum.

USDINR plan for next week’s This is the plan of USDINR breakout for next upcoming seasons according to price action advanced analysis upcoming target of this currency pair apx is 6-7% in one month

CRYPTO HIGH PROBABILTY SETUP FOR BIGGER GAINS (CHAINLINK USDT)Crypto is the most thrilling thing that one can trade as the price moments are very volatile like supercars speed on the highway. Due to these volatile price moments and the fact that the market remains open 24 x 7. It gives big returns within less period of time and also when it falls it falls badly. So trading it one can make a fortune out of it and also one can lose his entire capital within seconds.
So it's very important to have a good probability setup based on PRICE ACTIONS as it works almost everywhere in the world and also you need to have to make a trading plan in such a way that it eliminates emotion out of trading as we all know in trading SKILL are just 10% and execution and risk management is also just 10% rest 80% is emotion and psychology.
So the best way to eliminate emotions is to keep a stop loss such that even if it hits 10 times in a row you are not affected by it and when you make money you make a good chunk of money in one trade. That can be done by taking trade-in important areas where there is LIQUIDITY and BIG MONEY is also present to entre in the trade.
So here I am sharing analysis of CHAIN/USDT where the plan is to take the trade-in such an area where above liquidy is there and once taken out gives a very big move within no time and if fails also there is a short-selling idea that one can execute to catch the downside also in case of surprise events or shakeouts.
Trade Analysis I have explained on charts.
Hope you enjoy and learn something from it👍
- Pranesh Sahoo

#banknifty analysis for 19th AprilThe short-term trend is still negative & the trend doesn't change until we get a weekly closing above 33,300 levels.

COFFEEDAY SEEMS TO BE A SELLLEVELS MENTIONED IN THE CHART.
Disclaimer:
It is very important to do your own analysis before making any investment based on the chart mentioned here.
Trade wisely!

LET'S DRIVE WITH ASHOK_LEYLANDTwo possibilities (zones) arise from the chart –
• Buy
• Sell
BUY ZONE:
i. As FLAG completion is observed, the stock should move upwards.
ii. While moving upward it can face resistance around 133.95 to 135.75 due to formation of Double Top and 618 level.
iii. If it breaks above then it can move up to 146.40 to 152.00
SELL ZONE:
i. If the stock move gets resisted around 133.95 to 135.75 then it can see a downfall up to 109.25 which is support level considering Monthly Time Frame trend line.
ii. A support level at 109.25 should help to initiate an up-move until 146.55. Here BAT pattern formation gets completed and SELL gets initiated with a Stop Loss of 152 and Targets of 132.15 and 123.45 respectively
OTHER DETAILS CAN BE FETCHED BY HOVERING THE CURSOR ON THE CHART
Disclaimer:
• It is very important to do your own analysis before making any investment based on the chart mentioned here.
• Trade wisely!
