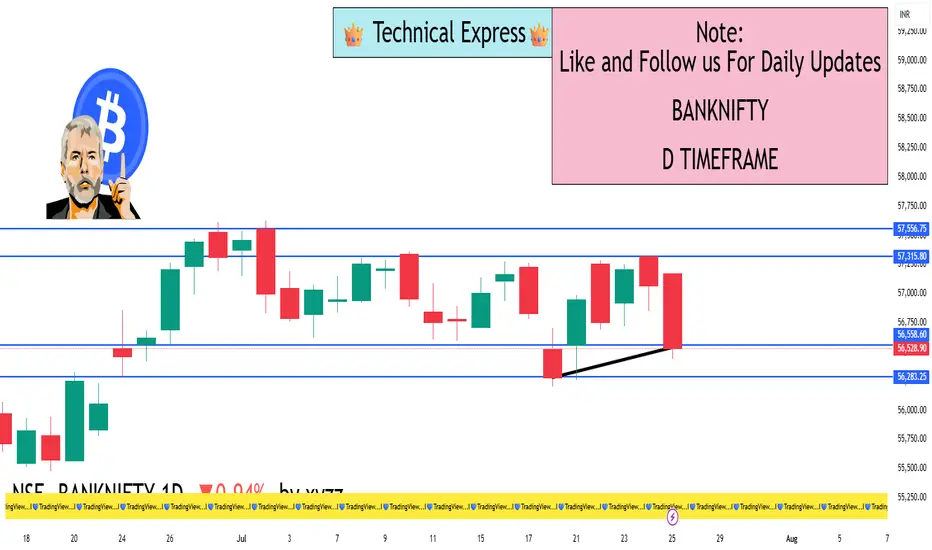
BANKNIFTY 1D TimeframeClosing Value: 56,528.90
Net Change: −537.15 points (−0.94%)
Opening Price: 57,034.40
Day’s High: 57,170.70
Day’s Low: 56,439.40
Trend: Bearish
📊 Technical Analysis
✅ Candle Pattern:
A strong bearish candle was formed.
Price opened higher but failed to sustain and closed near the day’s low — a sign of heavy intraday selling.
🔻 Support Zones:
56,400 – Immediate support (also the day's low)
56,000 – Psychological round number
55,750 – Medium-term support (from earlier price consolidation)
🔺 Resistance Zones:
56,800 – Near-term resistance
57,000 – Critical level; needs to be reclaimed for bullish reversal
57,300 – Stronger resistance zone based on recent highs
📈 Indicator Summary:
RSI (Relative Strength Index): Likely below 50, signaling weakening bullish momentum
MACD (Moving Average Convergence Divergence): Bearish crossover remains intact
Volume: Higher than average, suggesting institutional selling pressure
🧠 Market Sentiment:
Bearish sentiment prevailed across major banks including HDFC Bank, ICICI Bank, Axis Bank, Kotak Bank, and SBI
Pressure also visible in PSU banks (like PNB, Bank of Baroda, Canara Bank)
Overall market mood was risk-averse due to global uncertainty and potential interest rate impact
Foreign Institutional Investors (FIIs) continued their selling streak
Traders remain cautious ahead of upcoming quarterly bank results
✅ Conclusion:
Bank Nifty is currently in a short-term downtrend.
If 56,400 breaks decisively, it may head toward 56,000 and 55,750.
For bulls to regain strength, Bank Nifty must cross back above 57,000 with strong volume and momentum.
Advancedpatterns

USDINR plan for next week’s This is the plan of USDINR breakout for next upcoming seasons according to price action advanced analysis upcoming target of this currency pair apx is 6-7% in one month

CRYPTO HIGH PROBABILTY SETUP FOR BIGGER GAINS (CHAINLINK USDT)Crypto is the most thrilling thing that one can trade as the price moments are very volatile like supercars speed on the highway. Due to these volatile price moments and the fact that the market remains open 24 x 7. It gives big returns within less period of time and also when it falls it falls badly. So trading it one can make a fortune out of it and also one can lose his entire capital within seconds.
So it's very important to have a good probability setup based on PRICE ACTIONS as it works almost everywhere in the world and also you need to have to make a trading plan in such a way that it eliminates emotion out of trading as we all know in trading SKILL are just 10% and execution and risk management is also just 10% rest 80% is emotion and psychology.
So the best way to eliminate emotions is to keep a stop loss such that even if it hits 10 times in a row you are not affected by it and when you make money you make a good chunk of money in one trade. That can be done by taking trade-in important areas where there is LIQUIDITY and BIG MONEY is also present to entre in the trade.
So here I am sharing analysis of CHAIN/USDT where the plan is to take the trade-in such an area where above liquidy is there and once taken out gives a very big move within no time and if fails also there is a short-selling idea that one can execute to catch the downside also in case of surprise events or shakeouts.
Trade Analysis I have explained on charts.
Hope you enjoy and learn something from it👍
- Pranesh Sahoo

#banknifty analysis for 19th AprilThe short-term trend is still negative & the trend doesn't change until we get a weekly closing above 33,300 levels.

COFFEEDAY SEEMS TO BE A SELLLEVELS MENTIONED IN THE CHART.
Disclaimer:
It is very important to do your own analysis before making any investment based on the chart mentioned here.
Trade wisely!

LET'S DRIVE WITH ASHOK_LEYLANDTwo possibilities (zones) arise from the chart –
• Buy
• Sell
BUY ZONE:
i. As FLAG completion is observed, the stock should move upwards.
ii. While moving upward it can face resistance around 133.95 to 135.75 due to formation of Double Top and 618 level.
iii. If it breaks above then it can move up to 146.40 to 152.00
SELL ZONE:
i. If the stock move gets resisted around 133.95 to 135.75 then it can see a downfall up to 109.25 which is support level considering Monthly Time Frame trend line.
ii. A support level at 109.25 should help to initiate an up-move until 146.55. Here BAT pattern formation gets completed and SELL gets initiated with a Stop Loss of 152 and Targets of 132.15 and 123.45 respectively
OTHER DETAILS CAN BE FETCHED BY HOVERING THE CURSOR ON THE CHART
Disclaimer:
• It is very important to do your own analysis before making any investment based on the chart mentioned here.
• Trade wisely!
