BYD Company Limited (BYDDY) AnalysisCompany Overview:
BYD Company Limited OTC:BYDDY is a Chinese EV and battery manufacturing leader, investing CNY 100B to dominate the intelligent EV market with AI-driven systems and advanced driver assistance—offered at no extra cost to consumers.
Key Catalysts:
Product Expansion & Global Reach 🌍
2024 saw the launch of flagship EV models across multiple segments.
New market entries in Colombia and Oman are accelerating international sales.
Vertical Integration Advantage 🏭
BYD’s fully integrated supply chain covers everything from battery production to final assembly.
This enables cost control, rapid innovation, and resilience against supply chain disruptions.
AI & Smart Mobility Leadership 🤖
Intelligent vehicle systems enhance driving experience and safety.
Strategic investment positions BYD as a global disruptor in next-gen mobility.
Investment Outlook:
Bullish Case: We are bullish on BYDDY above $12.00–$13.00, supported by global expansion, vertical integration, and AI-driven innovation.
Upside Potential: Price target: $20.00–$22.00, reflecting market share gains and technological leadership.
📢 BYD—Driving the Future with AI, Global Reach, and Vertical Strength. #BYD #EVs #ElectricVehicles #AI #Batteries
AI

AI-Powered Algorithmic Trading 1. Introduction: The Fusion of AI and Algorithmic Trading
Algorithmic trading (or algo trading) refers to the use of computer programs to execute trading orders based on pre-defined rules. These rules can be based on timing, price, quantity, or any mathematical model.
Traditionally, algorithms were static—they executed strategies exactly as they were coded, without adapting to market changes in real time.
AI-powered algorithmic trading is different.
It integrates machine learning (ML) and artificial intelligence (AI) into trading systems, making them dynamic, adaptive, and self-improving.
Instead of blindly following a fixed script, an AI algorithm can:
Learn from historical market data
Identify evolving patterns
Adjust strategies based on changing conditions
Predict potential price movements
Manage risk dynamically
The result?
Trading systems that behave more like experienced human traders—except they operate at lightning speed and can process massive datasets in real time.
2. Why AI is Revolutionizing Algorithmic Trading
Before AI, algorithmic trading was powerful but rigid. If market conditions changed drastically—say, during a financial crisis or a geopolitical shock—the system might fail, simply because it was designed for "normal" conditions.
AI changes that by:
Pattern recognition: Detecting non-obvious market correlations.
Natural language processing (NLP): Interpreting news, earnings reports, and even social media sentiment in real-time.
Reinforcement learning: Learning from past trades and improving performance over time.
Adaptability: Shifting strategies instantly when volatility spikes or liquidity dries up.
In essence, AI empowers trading algorithms to think, not just follow orders.
3. Core Components of AI-Powered Algorithmic Trading Systems
To understand how these systems work, let’s break down the core building blocks:
3.1 Data Collection and Preprocessing
AI thrives on data—without quality data, even the most advanced AI model will fail.
Sources include:
Historical price data (open, high, low, close, volume)
Order book data (bid/ask depth)
News headlines & articles
Social media (Twitter, Reddit, StockTwits sentiment)
Macroeconomic indicators (interest rates, GDP growth, inflation)
Alternative data (satellite images, credit card transactions, shipping data)
Data preprocessing involves:
Cleaning: Removing errors or irrelevant information
Normalization: Scaling data for AI models
Feature engineering: Creating meaningful variables from raw data (e.g., moving averages, RSI, volatility)
3.2 Machine Learning Models
The heart of AI trading lies in ML models. Some popular ones include:
Supervised learning: Models like linear regression, random forests, or neural networks that predict future prices based on labeled historical data.
Unsupervised learning: Clustering methods to find patterns in unlabeled data (e.g., grouping similar trading days).
Reinforcement learning (RL): The AI learns optimal strategies through trial and error, receiving rewards for profitable trades.
Deep learning: Advanced neural networks (CNNs, LSTMs, Transformers) to handle complex time-series data and sentiment analysis.
3.3 Trading Strategy Generation
AI models help generate or refine strategies such as:
Trend-following (moving average crossovers)
Mean reversion (buying dips, selling rallies)
Statistical arbitrage (pairs trading, cointegration strategies)
Market making (providing liquidity and profiting from the bid-ask spread)
Event-driven (earnings surprises, mergers, economic announcements)
AI adds a twist—it can:
Adjust parameters dynamically
Identify optimal holding periods
Combine multiple strategies for diversification
3.4 Execution Algorithms
Once a trading signal is generated, execution algorithms ensure it’s carried out efficiently:
VWAP (Volume-Weighted Average Price) – Executes to match market volume patterns
TWAP (Time-Weighted Average Price) – Executes evenly over time
Implementation Shortfall – Balances execution cost vs. risk
Sniper/Stealth Orders – Hide large orders to avoid moving the market
AI improves execution by:
Predicting short-term order book dynamics
Avoiding periods of low liquidity
Detecting spoofing or manipulation
3.5 Risk Management
Risk is the biggest enemy in trading. AI systems incorporate:
Dynamic position sizing – Adjusting trade size based on volatility
Stop-loss adaptation – Moving stops based on changing conditions
Portfolio optimization – Balancing risk across multiple assets
Stress testing – Simulating extreme scenarios
AI models can predict drawdowns before they happen and adjust exposure accordingly.
4. Advantages of AI-Powered Algorithmic Trading
Speed: Executes trades in milliseconds.
Scalability: Can trade hundreds of assets simultaneously.
Objectivity: Removes human emotions like fear and greed.
Complex analysis: Processes terabytes of data that humans cannot.
Adaptability: Learns and evolves in real-time.
5. Challenges and Risks
AI isn’t a magic bullet—it comes with challenges:
Overfitting: AI may perform well on historical data but fail in real markets.
Black box problem: Deep learning models can be hard to interpret.
Data quality risk: Garbage in = garbage out.
Market regime shifts: AI models may fail in unprecedented situations.
Regulatory concerns: AI-driven trading must comply with strict financial regulations.
6. AI in Action – Real-World Use Cases
6.1 Hedge Funds
Firms like Renaissance Technologies and Two Sigma leverage AI for predictive modeling, order execution, and portfolio optimization.
6.2 High-Frequency Trading (HFT)
Firms deploy AI to detect microsecond price inefficiencies and exploit them before competitors.
6.3 Retail Trading Platforms
AI bots now help retail traders (e.g., Trade Ideas, TrendSpider) identify high-probability setups.
6.4 Sentiment-Driven Trading
AI scans Twitter, news feeds, and even Reddit forums to detect shifts in sentiment and trade accordingly.
7. Future Trends in AI-Powered Algorithmic Trading
Explainable AI (XAI): Making AI decisions transparent for regulators and traders.
Quantum computing integration: For lightning-fast optimization.
AI + Blockchain: Decentralized trading strategies and data verification.
Autonomous trading ecosystems: Fully self-managing portfolios with zero human intervention.
Cross-market intelligence: AI detecting correlations between equities, forex, commodities, and crypto in real-time.
8. Building Your Own AI-Powered Trading System – Step-by-Step
For traders who want to experiment:
Data sourcing: Choose reliable APIs (e.g., Alpha Vantage, Polygon.io, Quandl).
Choose a framework: Python (TensorFlow, PyTorch, scikit-learn) or R.
Feature engineering: Create technical and sentiment-based indicators.
Model training: Use supervised learning for prediction or reinforcement learning for strategy optimization.
Backtesting: Test strategies on historical data with realistic transaction costs.
Paper trading: Simulate live markets without risking real money.
Live deployment: Start with small capital and scale gradually.
Continuous learning: Update models with new data frequently.
9. Ethical & Regulatory Considerations
AI can cause market disruptions if misused:
Flash crashes: Rapid, AI-triggered selling can collapse prices.
Market manipulation: AI could unintentionally engage in manipulative patterns.
Bias in models: If training data is biased, trading decisions could be skewed.
Regulatory oversight: Authorities like SEBI (India), SEC (USA), and ESMA (Europe) monitor algorithmic trading closely.
10. Final Thoughts
AI-powered algorithmic trading is not just a technological leap—it’s a paradigm shift in how markets operate.
The combination of speed, intelligence, and adaptability makes AI an indispensable tool for modern traders and institutions.
However, successful deployment requires:
Robust data pipelines
Sound risk management
Ongoing monitoring and adaptation
In the right hands, AI can be a consistent alpha generator. In the wrong hands, it can be a high-speed path to losses.
The future will likely see more human-AI collaboration, where AI handles data-driven decisions and humans provide oversight, creativity, and strategic vision.
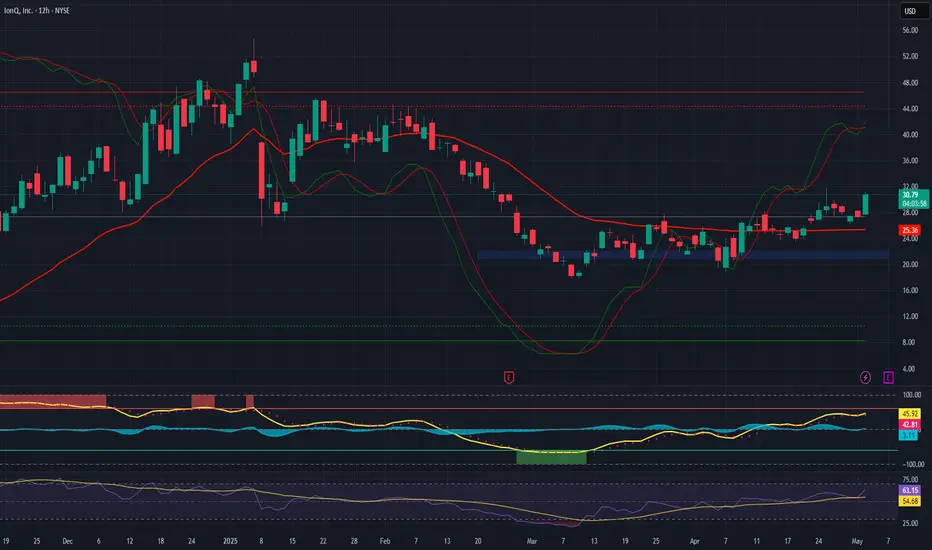
IonQ, Inc. (IONQ) – Engineering the Future of Quantum Advantage Company Snapshot:
IonQ NYSE:IONQ is at the forefront of quantum computing, leveraging trapped-ion technology and cutting-edge system design to push toward error-tolerant, commercially viable quantum systems.
Key Catalysts:
Breakthrough Hardware Milestone 🎯
2025 goal: >99.9% fidelity in two-qubit gates
Critical threshold for building error-corrected, scalable quantum systems
Unlocks use cases in logistics, cryptography, finance, and AI
Photonic Interconnects = Modular Scaling 🔗
Enables quantum modularity, allowing distributed systems to act as one
Tackles scalability bottlenecks inherent in current quantum architectures
Prepares IonQ for enterprise-scale applications beyond research labs
Global Expansion via Strategic Partnerships 🌍
Tapping into Asia and Europe through partnerships like Intellian
Expands footprint while diversifying revenue streams
Positions IonQ for recurring enterprise contracts and national defense engagements
Sector Leadership + Deep IP Moat 📚
Leading patent portfolio in trapped-ion quantum architecture
Early mover advantage in commercial quantum cloud offerings via AWS, Microsoft Azure, Google Cloud
Investment Outlook:
✅ Bullish Above: $21.00–$22.00
🚀 Upside Target: $45.00–$47.00
🔑 Thesis: Hardware breakthroughs + modular scale + global commercialization = long-term quantum upside
📢 IONQ: Converting quantum potential into practical, profitable systems.
#QuantumComputing #IONQ #DeepTech #AI #AdvancedComputing #CommercialQuantum
Hang Seng Index (HSI) 's Price Action vis-à-vis Major PivotsHSI seems to have broken out of last year's high (Oct 2024) and Jan 2023 high, and retested it too.
The index is about 67% from Jan 2024 low.
The next major pivot is Feb 2021 High, after that Oct 2007 High and then Jan 2018 High (all are marked on chart).
The price seems to be gaining momentum and moving parabolically, as marked on chart.
It seems price will move higher over months, of course there would be retracements.
As always it won't be as predictable as I have hypothesized above.
Nevertheless at this juncture price action is positive and depending upon price action further into the months the hypothesis will succeed or fail.
Trade Safe

Silver Futures: Navigating the Bullish Breakout
The Silver Futures chart presents a compelling picture, but as we know, navigating the market demands more than just technical analysis. Let's break down what we see:
Bullish Signals: The decisive breakout above the VWAP, coupled with the series of green Heikin Ashi candles, paints a bullish picture. The recent breach of the Base Camp level further strengthens this positive outlook.
VWAP as a Guide: The VWAP is now acting as dynamic support, offering potential buying opportunities on dips. However, remember that even in a bullish scenario, the market can be unpredictable.
Beyond the Chart: While technicals are promising, external factors can sway silver prices. Keep an eye on global economic indicators, geopolitical tensions, and any news that might impact precious metals.
Applying the Wisdom:
Don't Get Complacent: Even with a bullish setup, risk management is paramount. Set stop-losses to protect your capital in case of unexpected reversals.
Stay Informed: Technical analysis is valuable, but it's only one piece of the puzzle. Stay updated on fundamental factors that can influence silver's price trajectory.
Avoid Blind Faith in Tips: This bullish setup might attract stock tips, but remember, no one can predict the market with certainty. Do your own research and make informed decisions.
In Conclusion:
The Silver Futures chart is signaling a potential bullish trend. However, successful trading involves more than just following signals. Combine technical analysis with a keen understanding of market dynamics, risk management, and a healthy dose of skepticism towards "hot tips." This approach will increase your chances of navigating the market successfully, even when faced with its inherent unpredictability.
Disclaimer: This is an analysis, not financial advice. Trading involves risk; conduct your own research and consider your risk tolerance before making any investment decisions

ARkM: good time to accumulatePrice enter and react at demand zone, now it can reach supply zone around $1.2. We can wait to buy between 0.9 and 1.0

🚀 AI Breaks Out of Channel, Forms Bullish Cup and Handle!💎 Paradisers, #AI has broken out of the descending channel and formed a cup and handle pattern, which increases the likelihood of a bullish move.
💎 If #AIUSDT breaks above the resistance level, we can expect a bullish move up to the next resistance level.
💎 In the case of a pullback, we can anticipate a potential triple bottom pattern from the demand level, so be cautious here. It can provide a good risk-reward (RR) long setup from this point.
💎 However, in the case of a breakdown of the demand level, it will invalidate all the bullish signs. In that case, it would be better to wait for more favorable price action to develop.

TCS - Swing Trade - 22nd February #stocksTCS (1D TF) - Swing Trade Analysis given on 22nd Feb, 2024
Pattern: FALLING WEDGE
- Pullback candle at Support - Done ✓
- Volume spike at Support - Done ✓
- Trendline Resistance Breakout - In Progress
- Retest & Consolidation - In Progress
#stocks #swingtrade #chartanalysis #priceaction #traderyte #TCS #stockmarket #sharemarket #viral #sharemarketindia #StockMarketindia

The graph is bullishGrt coin is absolutely bullish as its broke out the weekly structure as AI narrative shows potential growth in next crypto bull market we can do investment in the graph for next bull run ☄️

Ocean Protocol (OCEAN) Price Prediction 2024, 2025–2030Ocean Protocol (OCEAN) Price Prediction 2024, 2025–2030
A symmetrical triangle is a chart pattern that shows two converging trend lines that connect a series of sequential peaks and troughs. The trend lines should converge at a roughly equal slope.
Ocean Protocol price prediction 2025
The Ocean Protocol price prediction for 2025 is currently between $ 0.409910 on the lower end and $ 1.921728 on the high end. Compared to today’s price, Ocean Protocol could gain 362.55% by 2025 if OCEAN reaches the upper price target.
Ocean Protocol price prediction 2030
The Ocean Protocol price prediction for 2030 is currently between $ 0.884510 on the lower end and $ 2.71 on the high end. Compared to today’s price, Ocean Protocol could gain 551.37% by 2030 if it reaches the upper price target.

LAI/USDT: This is 20x Potential in Bull Market but Why ?LAYERAI/USDT Technical and Fundamental Analysis:
#LAYERAI - Unlocking the Power of AI and Taking Control of Your Data
Technical and Fundamental Analysis: Strong
10x-20x Potential Gem
Breaking Resistance Levels
Best Accumulation Zone: $0.008-$0.009
Why Invest in #LAYERAI?
Layer AI is an innovative AI-based project that empowers individuals to reclaim control over their online data. Monetize and sell your data to tech giants like Google, Amazon, and Meta, unlocking the true value that belongs to you.
How to Get Started:
Accumulate Smartly: Start accumulating in the best zone of $0.008-$0.009.
Risk Management: Invest a small fund due to the critical role of risk-reward in cryptocurrency.
Follow us for More crypto quality analysis.
Thank you

UMA (UMA): AI coin is underpriced by the market – Time to buy?The start of 2023, the broader crypto market is bullish and its positive sentiment at the current bullish momentum could see UMA prices bounce higher.
Can the UMA token price regain momentum and test new highs this year? Let's perform an analysis of the price of the UMA coin, but first like, share and comment.
The UMA/USDT price is trading on the 4H chart inside a bullish channel (green lines) and close to the resistance just above it at § 2,173 (purple line), which once broken, projects a rise in the UMA prices up to the next resistance at the $3,045 range (purple line), with some correction in UMA prices on the way to gain momentum before breaking through the resistances above. On the other hand, if UMA prices miss the lower line of the bullish channel (green lines) it should test the support at $1,648 (purple line).
The technical indicator of blue line and yellow line moving averages are supporting the UMA price action in favor of the direction of the uptrend in the very short term. Please read the warning below before making any decision.
ALERT: As this analysis is public and market knowledge, it is easy for the market and the big manipulators to play against this analysis, if it is not convenient for the market, so that it can be misconfigured and invalidated, therefore the analysis price is always constantly updated, and can change in a matter of minutes, depending on which way the market manipulates the price.

Long Term View on Kellton TechLooking very attractive at recent levels. On the verge of giving a quick 10%-12%.
