Breakout vs Fakeout: Master this logic to become a better TraderBreakouts can be deceiving. In this video, I dive deep into the psychology and structure behind breakouts vs fakeouts, how to spot the traps, and how to trade them with precision.
Alltimehigh


APOLLOHOSP Soon to ATH??!!!Yessss!!!!!
Chart patterns looks prudent for the above titled opinion
Rounding bottom....with a Inverted H&S pattern awaiting a Breakout!!!!!!
Expecting a Breakout by this week or next.
We can make our entry after the breakout solid candle....
Just add it to your watchlist and keep an eye on it!!!!
will update once the breakout happens!!!!!
just my opinion....not an advice nor tip....
Thank you!!!!!!

AUBANK back to All Time High.AUBANK is a few points away from the price where it started.
The trading strategy is to wait for the resistance range 250-246.90 for a retest of the all-time high and upper targets of 261.50 to 268 as new highs.
Upon rejection or confirmation of rejection of this resistance level, prices will fall to 231 and 221, respectively, as T1 and T2.

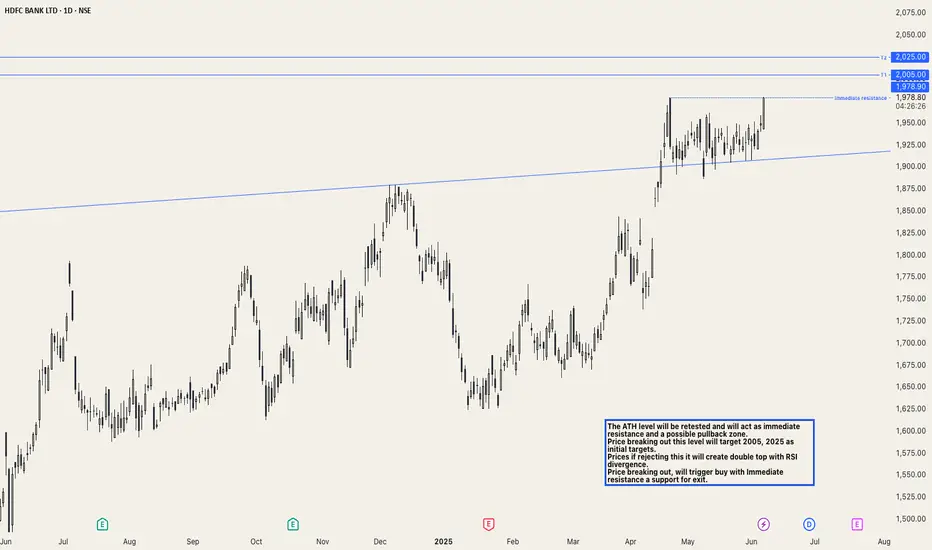
HDFCBANK: All Time High retest, for new ATH.The ATH level will be retested and will act as immediate resistance and a possible pullback zone.
Price breaking out this level will target 2005 and 2025 as initial targets.
Prices if rejecting this, it will create a double top with RSI divergence.
Price breaking out will trigger a buy, with Immediate resistance a support for exit.
Bajaj Finance - Breakout Confirmed! Heading Toward ₹11,850?Bajaj Finance (BAJFINANCE) has broken out of its multi-year consolidation range with strong momentum. The ascending trendline and breakout suggest a bullish continuation toward ₹11,850. Watch for pullbacks to enter long positions.
Key Observations:
1. Ascending Trendline Support:
- The stock has consistently respected the ascending trendline since 2021, with multiple bounces (marked by green arrows), indicating strong bullish momentum.
2. Breakout Above Resistance:
- After consolidating between for nearly two years, the price has finally broken above the resistance zone, confirming a bullish breakout.
3. Upside Potential:
- Based on the height of the previous consolidation range, the breakout target is projected at ₹11,850.
5. Strong Base Support:
- The ₹6,500–₹7,000 zone remains a strong support area in case of any pullbacks.
---
Disclaimer:
This analysis is for informational and educational purposes only and does not constitute financial advice. Trading involves risk, and past performance is not indicative of future results. Always conduct your own research and consult with a qualified financial advisor before making any investment decisions.*

MCX - 2 Months Consolidation Breakout - All Time HighMulti Commodity Exchange of India Ltd
1) Time Frame - Daily.
2) The Stock has been in a Consolidation since (October, 2024). Now, It has given a Consolidation breakout & Closed at it's Life Time High with good volume & good bullish momentum candle in Daily Time Frame.
3) The stock may find it's next resistance around the price (7900 - 14.15% from the current price 6920) .
4) Recommendation - Strong Buy .

C&H BREAKOUT IN SHREE PUSHKARShree pushkar 345, gave multi year breakout on daily weekly charts. Classical cup and handle pattern breakout with fibonacci extension showing target of 500 coming soon. above 500 we will review

all time high breakoutGillette India LTD has broke its all time high with good volume on both daily and weekly timeframe.

Bitcoin Breakout the Channel Pattern. All-Time High ???A Channel Pattern has formed, and a Breakout occurred above the Pattern. Next, the market is expected to reach the Resistance zone. If the market Breakout above the resistance zone, Bitcoin is expected to enter a very Bullish Uptrend and Possibly reach an All-Time High.

All time high breakout Sharda cropchem has given breakout of it's all time high with good volume and has sustained it successfully. Short term and mid term momentum is also good in the stock indicating strength in the trend.

Apple Next move is the Pole Target at 269 USDApple is forming a Flag Pattern, and Breakout above the Pattern is expected. The Next Target is the Pole Target price at $269, offering a potential Profit with an 18.8% ROI.
I want to help People Make Profit all over the "World".

ALL TIME HIGH BREAKOUTEclerx services LTD has given breakout of all time high with good volume on both daily and weekly timeframe.

Dow Jones Next Target is $44,309Dow Jones has Breakout of the Channel Pattern and continues its Uptrend. The First Target is $44,309, and the Second Target is the Top of the Rising Channel Pattern.
I want to help People to Make Profit all over the "World".

Gulf Energy Development : Next Target is 69 THB, Fibonacci levelIn Gulf Energy Development, Falling Wedge Pattern Breakout and Reached the Target with +34% Profit. Now market Breakout above the Resistance level, so Next Target is 1.6 Fibonacci levels 69 THB.
I want to help people to Make Profit all over the "World".

Medi Assist Health (MEDIASSIST) by KRS ChartsDate:11th Sept 2024
Time: 10:43 AM
Why MEDIASSIST ❓❓
1. Broken Range in June 2024 and was range-bound around previous Resistance.
2. Again, in Sept with Huge Volume and Huge Green candle broke out range and successfully retest recently.
3. All over movement so far is sideways to turning Bullish.
4. Recently made All Time High and I'm expecting it to reach 742 Rs.
SL will be 641 Rs with 1D closing basis

Advanced Info Service, Triangle Pattern Target, Gain +20% PROFITAdvanced Info Service, Triangle Pattern formed and Breakout above the Pattern. So the Next Target is 333 THB. Offering a Potential Profit of +20% ROI. Can you Guess the "Second Target"???.
I want to help People to Make Profit all over the "World".

Rico Auto INDS NSE (ALL TIME HIGH)Date - 1st March 2024
Rico has already breached All time high price level which was 114 Rs.
Expecting huge target of 220 from current price 115 of Cup & Handle pattern.
Wave Count also in Favour 5th leg on monthly timeframe is still remaining.
for the safer side majority of your entry should be on retest that shown in chart.
5ema is also supporting on monthly basis so can carry with it.
Thank You.

Tilaknagar IndustriesTilaknagar Industries Ltd. is primarily involved in manufacturing and sale of Indian Made Foreign Liquor (IMFL).
Company has broken the all time high and now it has also re-tested this level and ready to give big return in next few months.
Good to buy in the bottom.

FEDERAL BANK reversal candidate in short termNSE:FEDERALBNK looking good for reversal after correction.
Closed just at Resistance zone. If sustains above resistance which is 190-192 can show Positive move till 195-198 in very short term.
above 198-200 zone stock will head towards new life time high and 1st levels will be 215-220.
very Short term support is at 187-188 and mid term support is 182.
No buy sell recommendation. trade with your own study and risk management
just for education purpose

HDFCBANK BREAKOUTHDFCBANK 3-year trend has broken and is moving bullish. hope HDFC may hit 2000 in the coming months

MOTHERSON at All time high BreakoutNSE:MOTHERSON stock is consolidating at All Time High levels after strong run.
Yesterday spike in volume indicates strong accumulation in consolidation phase and stock is getting ready for breakout.
After Resistance Breakout above 210 stock will make fresh higher highs again.
Support levels in short term at 192-195 and for mid to long term at 185
on the upside 230 and 250 possible with current pattern.
Education purpose only. No buy sell recommendation

LONG APAR INDUSTRIES - BREACHED TRENDLINE Buy APARINDS!!
Breached Trendline in 1D Time Frame. It will go up from here. Hold till it falls below the Trendline.
Buy - 10150
Target - No Target
SL- 10000
All The Best!!
Note: This is just for educational purposes. I am not SEBI registered. Do consult your financial advisor before investing.
