CALLED IT - Bitcoin $107K TO $66K (-40% DROP) 🚨 CALLED IT - $107K TO $66K (-40% DROP)
Remember my warning on October 18, 2025?
When everyone was screaming "TO THE MOON" at $107K, I showed you the bearish divergence and said:
"$104K breakdown could trigger a crash to $73K and $49K."
👉 RESULT: Bitcoin dropped from $107K → $66,700
That's -40% Correction, EXACTLY as predicted.
🔰PROFIT BOOKED:
→ Short from $107K to $66,700
→ $40,000+ per CRYPTOCAP:BTC move captured
→ Those who followed saved their portfolio from -40% destruction
🔰 WHAT THE CHART SHOWED:
✓ Weekly bearish divergence confirmed
✓ $104K support trendline broken
✓ Support 1 ($73K) - SMASHED
✓ Now testing $66K-$68K zone
✓ Support 2 ($48K) still possible if this breaks
🔰 THE LESSON:
This is WHY I always tell you: Never blindly follow moonboys.
Everyone wants to hear "$200K coming" but nobody wants to hear "protect your capital."
Retracements happen in EVERY market. Even in bull runs.
Am I bullish long-term? YES.
Do I ignore warning signs? NEVER.
🔰 If you followed this analysis, you either:
Saved your portfolio from -40% crash
Made massive profit on the short
Bought the dip at better prices
This is the power of REAL technical analysis, not hopium.
👉 Share this with someone who needs to see it.
More updates coming. Stay connected.
ALTS

$ETH UPDATE: NOW 48% DOWN FROM MY WARNINGCRYPTOCAP:ETH UPDATE: NOW 48% DOWN FROM MY WARNING
When #ETHEREUM Broke $3,700-$3,600 Support, I warned you about a major breakdown.
✅ From $3,700 → $1,928 (48%) in Just 3 Months
✅ Previous Entry at $2,200-$2000 FILLED
NEW ACCUMULATION ZONE:
🔹 $2,000 - $1,500 (Start Building Positions)
🔹 $1,700 (0.618 Fib - Strong Support, Bid Placed)
🔹 $1,300 (0.786 Fib - Worst Case Scenario Bid)
Why I'm Still Confident:
→ $10K Target (5x from current levels)
→ $15K Target (Extended cycle target)
This is NOT for short-term trades.
This is LONG-TERM spot accumulation.
The best opportunities come when everyone else is fearful.
Fibonacci levels don't lie:
0.618 at $1,700 = Historical bounce zone
0.786 at $1,300 = Maximum pain / Maximum opportunity
My Approach:
Scale in. Don't all-in.
Place bids at key levels.
Let the market come to you.
Remember: In crypto, 500-1000% moves happen every cycle. But only for those who accumulate during fear, not FOMO.
NFA. ALWAYS DYOR.

OCTOBER 18: I CALLED $107K CRASH. TODAY: BITCOIN -44% AT $60K.OCTOBER 18: I CALLED $107K CRASH. TODAY: BITCOIN -44% AT $60K. RECEIPTS INSIDE.
They Called Me "FUD Spreader" When I Warned You On October 18, 2025.
Bitcoin Was At $107K.
Everyone Screamed "BUY THE DIP"
I Showed You The Bearish Divergence And Said: "Protect Your Capital."
THE NUMBERS DON'T LIE:
Bitcoin: $107,000 → $60,000
Total Drop: -44%
Short Profit: $47,000 Per BTC
IF YOU FOLLOWED THIS ANALYSIS:
✅ You Saved Your Portfolio From -44% Destruction
✅ You Made Massive Profits On The Short
✅ You're Now Positioned To Buy At 44% Discount
✅ You Ignored The Noise And Followed The Chart
WHAT HAPPENED:
Weekly Bearish Divergence ✓ CONFIRMED
$104K Support Breakdown ✓ BROKE
$73K Support Level ✓ SMASHED
$66K Zone ✓ CRUSHED
Now At $60K Testing Critical Support
WHAT'S NEXT:
$48K-$49K Zone Still In Play If $60K Breaks.
This Is NOT About Being Bearish.
This Is About PROTECTING CAPITAL And Buying Smart.
Bull Market Will Continue.
But Corrections Are PART Of The Journey.
Now You Can Start Accumulation Bitcoin From $60K Level Slowly
THE DIFFERENCE:
❌ Moonboys: "Buy At $107K, HODL Forever"
✅ Real Analysis: Save 44%, Re-Enter Lower
This Is Why Technical Analysis Matters.
This Is Why You Don't Follow Blind Hopium.
Drop Comment If You Followed This Call.
More Updates Coming. The Opportunity Isn't Over.

$ADA ALTSEASON SETUP | 4,500%+ EXPANSION IF SUPPORT HOLDSCRYPTOCAP:ADA ALTSEASON SETUP | 4,500%+ EXPANSION IF SUPPORT HOLDS
#ADA Is Trading Inside A HTF Bullish OB After A ~93% Corrective Move From Its Local Macro High, Positioning Price At A Critical Accumulation Vs Invalidation Zone.
Technical Structure
✅ Previous Cycle ATH At $3.1 (+1,300% Expansion)
✅ BIG Correction PHASE: −78% From $1 Local High Within Last 6 Months
✅ Multi-Year Strong Support Holding Above $0.24 Level
✅ HTF Bullish OB Active At $0.18–$0.13
✅ Structure Remains Bullish As Long As $0.13 Holds (HTF Close)
✅ Strict STOP LOSS For High Risky Trader: $0.0755 (HTF Close)
Historical Context:
2021 Bull Run: +3,400% Expansion To $3.10
2021-2026 Correction: -92.89% Decline Into Accumulation Phase
HTF Demand Zone: $0.18–$0.13 (Accumulation & Liquidity Absorption)
Reclaim Zone: $0.4374 (Trend Confirmation Area)
Bull Market Expansion Targets: $1.20 → $3 → $5 → $10+ (Full Cycle Expansion Projection)
This $0.18–$0.13 Zone May Be The Last Accumulation Opportunity For ADA Bulls Before The Next Parabolic Phase.
Invalidation: Weekly Close Below $0.13
Disclaimer: This Is TA Only. Not Financial Advice. Always Do Your Own Research And Manage Risk.

$HYPE MASTERCLASS: 60% DOWN, 86% UP From My AnalysisGETTEX:HYPE MASTERCLASS: 60% DOWN, 86% UP - THIS IS WHY YOU FOLLOW THE CHARTS
Remember My Analysis? Let me Break Down the FULL Trade:
WHAT I CALLED ON 23 OCTOBER 2025:
➜ SHORT Setup Signal at $50
➜ Predicted Dump to $20
➜ Marked $20-$15 as PRIME Accumulation Zone
WHAT HAPPENED:
✅ Price dumped EXACTLY to $20
✅ 60% profit on SHORT from $50 to $20
✅ Strong Bounce from Predicted Accumulation Level
Now Trading at $35-$38 Which is 86% Profit on LONG From $20 Entry.
THE RESULTS:
If You Followed the Complete Plan:
✅ Booked 60% SHORT Profits
✅ Flipped to LONG at $20
✅ Now Sitting on 86% SPOT Gains (No Leverage!)
THE LESSON: This is What SMART Trading Looks Like:
Don't Buy Tops
Don't Sell Bottoms
NO FOMO
LONG TERM POTENTIAL: $50 / $100 / $200 / $500
Did You Catch BOTH Moves?
Not financial advice. ALWAYS DYOR.

CALLED ETH CRASH AT $3,700. NOW 65% DOWN. CALLED ETH CRASH AT $3,700. NOW 65% DOWN. ACCUMULATION ZONE ACTIVATED
REMEMBER MY WARNING?
When ETH Broke $3,700-$3,600 Support, I told you: "Major Breakdown Incoming"
THE RESULT:
✅ Entry Warning: $3,700
✅ Current Price: ~$1,700
✅ Total Drop From Our Entry: -54% (65% from Peak in Last 6 months)
ACCUMULATION ZONES:
✅ Zone 1: $2,000-$1,800 - FILLED (First Bids Triggered)
🎯 Zone 2: $1,400-$1,270 (0.786 Fib) - BIDS PLACED
→ This is maximum Pain Zone
→ Historical Bounce Level
→ Best Long-Term Entry
WHY I’M LONg-TERM BULLISH ON CRYPTOCAP:ETH :
→ U.S. ETH ETFs Have Accumulated 6M ETH ($55B) in ~18 months
→ Bitmine Continues aggressive Accumulation, Now Holding 4.28M ETH (~$13B+)
→ Combined with Other ETH-Strategy Firms, Institutions Now Control ~13M ETH
This Level of Structural, Long-Term Demand is Extremely Bullish for Ethereum’s Next Cycle.
Long-Term Targets: $10,000-$20,000 (5-10x Potential)
MY APPROACH:
1️⃣ Scale in Slowly (Not All-In)
2️⃣ Place Bids at Key Technical Levels
3️⃣ Let Market Come to Me
4️⃣ Think in Years, Not Weeks
THE MINDSET (THE REALITY):
❌ Most Bought at $3,700 (Greed)
✅ I'm Buying at $1,800 (Fear)
This is how generational wealth is built in crypto.
IMPORTANT:
This is NOT Short-term Trading, This is LONG-TERM Accumulation
65-80%% Corrections = Normal in Crypto
Next Bull Run = 500-1000% Moves
THE FIBONACCI PROOF:
0.618 Fib ($1,700) = Current Support Test
0.786 Fib ($1,270) = Maximum Opportunity
More Downside Possible Before Reversal.
But When $10K-$20K Hits, You'll Remember this Post.
NFA. ALWAYS DYOR. Scale in Smart.

$WLFI CRASH ALERT: TRUMP's Crypto - Dump to $0.07 or Pump to ATH⚠️ $WLFI CRASH ALERT: TRUMP's Crypto at Critical Zone - Dump to $0.07 or Pump to ATH?
World Liberty Financial ($WLFI), President Donald Trump's Crypto Project Continues Trading in a Clear Bearish Structure on the Daily TF. $WLFI Now Down 78% from ATH $0.4780, Now Trading at $0.1306.
Bullish Scenario:
If Price Holds $0.113 – $0.125 Support, Expect A Relief Bounce Toward $0.18 – $0.20 (+40%) Resistance (Still Within Bearish Channel).
Breakout Confirmation:
Break Above $0.20 With High Volume + HTF Candle Close → Opens Path Toward NEW ATH Targets Around $1.00
Bearish Scenario:
Breakdown Below $0.113 Support → Expect Another 40% Drop From Breakdown Level.
Downside Target: $0.07
Risk Warning:
Never Trade Blindly. Always Trade With Confirmations And Strict Stop Loss.
Educational Purpose Only – Not Financial Advice

The Ugly Truth Behind Cathie Wood's $1.5M Bitcoin Prediction⚠️ The Ugly Truth Behind Cathie Wood's $1.5M Bitcoin Prediction Nobody Talks About (The $1M Bitcoin Trap Exposed)
Cathie Wood Just Predicted $1.5M Bitcoin By 2030. Before You Get Excited, Let Me Show You Something Important.
Her Prediction Track Record:
1️⃣ November 2020: Target: $400K-$500K
2️⃣ May 2021: Target: $500K By 2026
3️⃣ September 2021: Target: $500K by 2026
4️⃣ January 2022: Target: $1M+ by 2030
5️⃣ February 2023: Target: $1M-$1.48M by 2030
6️⃣ January 2024: Target: $1.5M by 2030 (Raised 50%)
6️⃣ November 2024: Target: Base $650K, Bull $1.5M by 2030
7️⃣ February 2025: Target: Bull $1.5M, Base $710K, Bear $300K
8️⃣ April 2025: Target: Up to $2.4M by 2030
9️⃣ November 2025: Target: $1.2M by 2030 (Reduced from $1.5M)
Notice The Pattern? The Target Year Keeps Shifting But The Big Numbers Stay In Headlines.
🔰 Ask Yourself This:
If Institutions Truly Believed Bitcoin Will 15x From Here, Why Would They Tell You?
Why Reveal Their “Secret” To Millions Of Retail Investors?
Think About It. When They Announce Massive Targets, Retail Holds Expecting $1M While Institutions Quietly Take Profits. Then They Buy Back Cheaper When You Panic Sell The Dip.
This Is How Exit Liquidity Works.
🔰 The Reality Check:
I Am Not Against Bitcoin Reaching $1M. It Absolutely Can Happen.
But Here Is What Nobody Tells You: Bitcoin Is Not Magic. It Does Not 10x Overnight Because Someone On TV Said So.
$1M Bitcoin Is Possible But Realistic Timeframe Is 5–10 Years Of Holding Through Multiple Cycles, Crashes And Recoveries.
🔰 My Honest Take:
➡️ Institutions Are Not Your Friends. They Are Not Sharing Alpha, They Are Creating Liquidity.
➡️ When ARK Says Buy, Ask Yourself: Who Are They Selling To?
➡️ Big Targets Make Great Headlines But Terrible Trading Strategies.
🔰 What You Should Do Instead:
👉 Never Make Financial Decisions Based On Influencer Predictions.
👉 Do Your Own Research With Proper Calculations.
👉 Have Your Own Entry And Exit Strategy.
👉 Understand That Wealth Building Takes Time Not Tweets.
CryptoPatel Summary:
🔹 Yes Bitcoin Can Reach $1M. I Support That Long Term Vision.
🔹 But It Will Take Years Of Patience, Not Months Of Hopium.
🔹 The Difference Between Retail And Institutions? They Have A Plan. Do You?
🔹 Stop Being Exit Liquidity. Start Being Strategic.
Save This Post. Your Future Self Will Thank You.
Follow @CryptoPatel For Real Talk, Not Hype.
NFA & DYOR

$ZEC Update: 3 Perfect Calls. 3 Massive Wins. What's Next?CRYPTOCAP:ZEC Update: 3 Perfect Calls. 3 Massive Wins. What's Next?
Let Me Walk You Through How We Played This:
📍 Feb 2024: Called CRYPTOCAP:ZEC at $20–$24. Everyone Laughed. Said I Was Crazy.
📍 Nov 2025: Price Exploded to $750. +3100% Gains for Believers.
📍 Call #1: SHORT: Told You to Exit/Short Around $700–$750. Price Dumped 55% After My Warning. Shorts Printed Heavy.
📍 Call #2: LONG: Told You to Go Long After the Dump at $300. Price Pumped to $560. That's 86% Profit booked.
📍 Call #3: EXIT: Warned Again that Price Had high Chances to Dump from $500 Level. Same thing Happened.
Now Look Where We Are: CRYPTOCAP:ZEC Trading at $276
↓ 60% Down from our First Short Entry
↓ 50% Down from our Second Exit/Short Warning
3 Calls. 3 Wins. No Luck, Just Charts.
What's Next?
I Still Believe ZEC Can Hit: → $190 → $100 (Major HTF/FVG Level)
The Unfilled HTF FVG Below Hasn't Been Swept yet. Structure Says Lower Before Any Real Reversal.
Keep These Levels on Your Radar if you're Looking to Enter.
Don't Chase. Don't FOMO. Wait for the Levels.
Hope you Enjoyed the Accuracy. More Coming.
Who's Been Following Since $20? 👇
NFA | ALWAYS DYOR

$100M Private Sale at $0.40... Now CMP Trading at $0.135$100M Private Sale at $0.40... Now Retail Can Buy at $0.135. First Time Retail Gets Better Entry Than VC
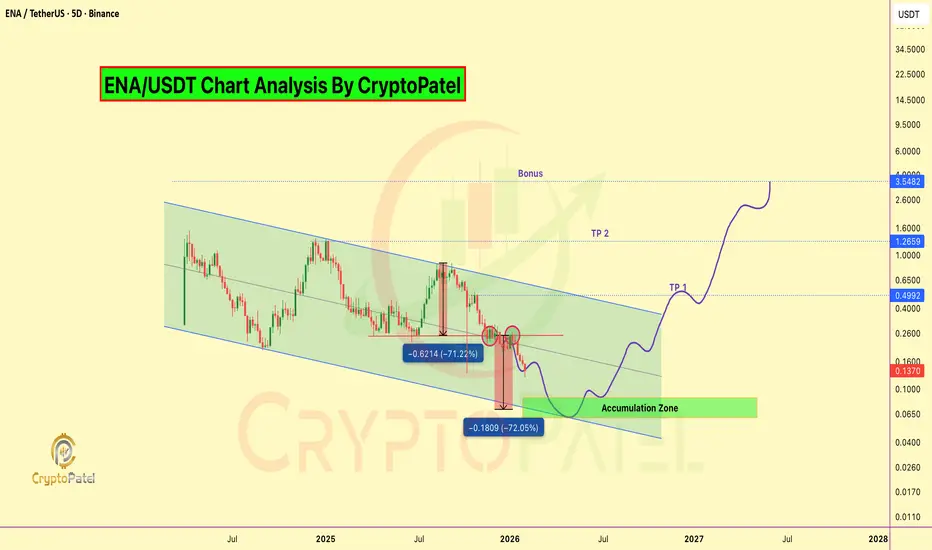
#ENA Is Trading Inside A Long-Term Descending Channel On The HTF Chart Since 2024.
Price Has Completed A Deep Multi-Leg Correction And Is Now Testing A Major Demand Zone At Channel Support.
Current Technical Structure:
✅ Descending Channel Intact
✅ ~92% Down From ATH
✅ Price Near Lower Channel Support
✅ Strong Accumulation Zone: $0.08–$0.06
✅ H&S Bearish Target For Long Term Accumulation is $0.07
✅ ~66% Below Private Investor Price (VC Discount Zone)
✅ Trump's World Liberty Financial Bought ~$5.15M ENA At ~$0.891 (Now ~$0.135 → ~85% Drawdown / ~$4.37M Unrealized Loss)
CryptoPatel Targets: $0.50 / $1.26 / Bonus $3+
As Long As ENA/USDT Holds Above The Accumulation Zone, A Relief Rally And Trend Reversal Remain Probable.
Why It Could Pump
✅ EURONEXT:USDE is now 3rd Largest Stablecoin ($5.8B)
✅ Fee Switch Coming Q1 2026 - stakers Get Protocol Revenue
✅ Building Own Blockchain
✅ Institutional Product (iUSDe) Launching Soon
✅ Major TradFi Backing
⚠️ Risks to Watch
❌ Heavy token unlocks until 2028
❌ Down 85% from ATH
❌ Similar model concerns to Terra/Luna
❌ Depends on positive funding rates
Invalidation & Risk Note: This is a high-risk, high-reward setup with elevated volatility. Strict risk management is essential.
TA Only. Not Financial Advice. ALWAYS DYOR.
$BTC UPDATE: 22% DOWN FROM MY SHORT ZONECRYPTOCAP:BTC UPDATE: 22% DOWN FROM MY SHORT ZONE
When Most MoonBoys Were Calling $200K–$500K... I Shared Shorts at $95K-$98K.
Today: Bitcoin Touched $75,500 ✅
Results Without Leverage: +22%
With 5x Leverage: ~100%+ ProfitIf You Followed the Setup and Now Time to Book Profits.
The Trend Was Clear:
→ Bear Flag Breakdown
→ H&S Failure
→ Lower Highs, Lower Lows
This is Why We Trade Structure, Not Hopium.
Risk Management Saved Portfolios.
Stop Losses Kept You in the Game.
Moon Boys Don't Teach You Risk Management.
Charts do.
Always Trade with a Plan. Always manage Risk.
Hope You Saved Capital & Banked Gains.
Not financial Advice. ALWAYS DYOR.

UPDATE: $BTC Breakdown Playing OutUPDATE: CRYPTOCAP:BTC Breakdown Playing Out
Bitcoin dumped below $85k, now trading near $84.4k.
We called shorts at $95k–$98k, and price rejected from ~$98k, delivering nearly 12% downside already.
The bear flag breakdown remains active, downside continuation favored.
Targets: $75k → $70k
Invalidation: HTF close above $90,600
Until then: sell rallies, respect the trend.
Not financial advice. DYOR.

$PUMP MACRO SETUP | 1,000%+ UPSIDE IF HTF BASE HOLDSNYSE:PUMP MACRO SETUP | 1,000%+ UPSIDE IF HTF BASE HOLDS
#PUMP Is Trading Inside A HTF Accumulation Zone After Completing A Long-Term Descending Wedge, Signaling A Potential Macro Trend Reversal.
Technical Structure:
✅ Multi-Month Descending Wedge Breakout Confirmed
✅ Clean Breakout + Retest Of HTF Neckline
✅ Inverse H&S Pattern NeckLine Very Close to Breakout
✅ Strong Demand Holding Inside $0.0025 – $0.0022
✅ Structure Invalidate Below $0.00168 (HTF Close)
✅ Sustained Acceptance Above Accumulation Signals Continuation
CryptoPatel Expansion Targets: $0.00504 → $0.00867 → $0.01500 → $0.02297+
High R:R Setup If HTF Demand Holds And Expansion From The Base Continues.
❌ Invalidation: HTF Close Below $0.00168 Opens Downside Risk And Invalidates The Reversal Structure.
TA Only. Not Financial Advice. ALWAYS DYOR.

BTC Confirms Bearish Structure After Neckline RejectionBTC Confirms Bearish Structure After Neckline Rejection
#Bitcoin has rejected the 94k–98k neckline resistance, confirming a bearish market structure.
➡️ Resistance: 94k–98k
➡️ Supports: 80k → 75k → 70k
Structure shows a confirmed Head & Shoulders Pattern Failed, Followed by a bear flag breakdown, trend remains decisively bearish.
Outlook:
Below 90k, downside continuation is favored.
Measured move points to 75k–70k (~22% downside).
Bullish bias only returns on a strong reclaim and acceptance above 92k.
Until then: sell the rallies, respect the trend.
Not financial advice. DYOR.

$SAND MACRO SETUP | 7,800%+ CYCLE EXPANSION IF HTF DEMAND HOLDSCSE:SAND Is Trading At A Major HTF Accumulation Zone After A ~99% Decline From ATH, Forming A Long-Term Base Inside A Multi-Year Descending Channel.
Technical Structure:
• Strong Demand Holding At $0.14 – $0.11
• Price Reacting From HTF Trendline Support
• Structure Remains Valid Above $0.10 (HTF Close)
• Break Above $0.22 – $0.26 Required For Bullish Continuation
Expansion Targets (HTF): $0.65 → $1.50 → $3.50 → $8.48+ (ATH Zone)
This Remains A High R:R Macro Setup If HTF Demand Holds And Price Breaks The Descending Channel.
Invalidation:
HTF Close Below $0.10 Opens Downside Toward $0.05 – $0.035, The Last Major Bullish Order Block.
TA Only. Not Financial Advice. DYOR.

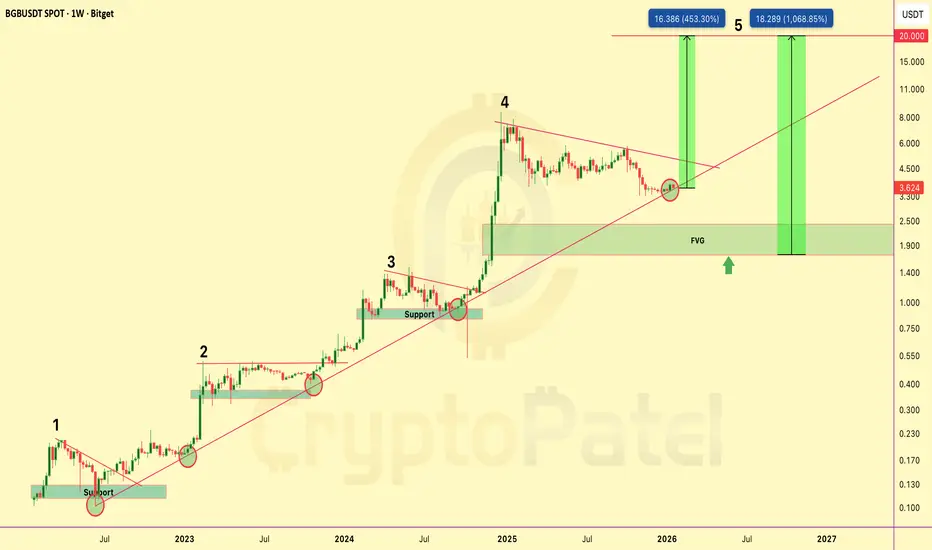
$BGB PRICE PREDICTION | 450%–1000% POTENTIALBGB is trading inside a well-defined long-term rising channel on the weekly timeframe, respecting bullish market structure since 2022.
Price has completed a full accumulation → expansion cycle and is currently undergoing a healthy corrective phase before the next impulsive move.
Technical Structure
Long-term ascending trendline remains intact
Clear 5-wave Elliott structure on HTF
Wave 4 correction following a strong impulsive expansion
Price reacting from dynamic channel support
HTF Fair Value Gap (FVG): $2.40 – $1.70
Bullish structure maintained above $3.40
Upside Targets (Wave 5 Extension)
$10
$15
$20
Alternative Scenario
If price breaks below $3.40 and an HTF candle closes below this level, there is a high probability of a move toward the $2.00 support and HTF FVG zone, which would represent a strong long-term accumulation area rather than trend invalidation.
Bias & Invalidation
As long as BGB/USDT holds above the rising channel support, the macro bullish bias remains intact.
Invalidation: Weekly close below the rising channel.
Technical analysis only. Not financial advice. DYOR.
$ASTER PRICE PREDICTION | HTF ACCUMULATION | 2400% MACRO POTENT?SEED_WANDERIN_JIMZIP900:ASTER is currently trading inside a high-timeframe accumulation base after a prolonged downtrend.
Price compression near major demand suggests trend exhaustion and a potential volatility expansion ahead.
Market Structure Overview
✅ Prolonged downtrend → exhaustion phase
✅ HTF accumulation forming
✅ Descending trendline pressure building
✅ Volatility compression → expansion setup
SEED_WANDERIN_JIMZIP900:ASTER is already ~78% down from its September 2025 ATH, significantly improving risk–reward for long-term positioning.
Key Accumulation Zones
Zone 1: $0.70 – $0.60 ✅ (Filled – bounce expected)
Zone 2 (Macro flush scenario): $0.45 – $0.35
→ Strong long-term accumulation zone if broader market weakness persists
Upside Targets (CryptoPatel View)
$1.50 → $2.00 → $5.00 → $10.00 → $20.00
Macro extension: $20 – $30 (long-term, high-risk / high-reward)
Invalidation: Loss of HTF demand structure → High-risk hold
Market Talk
As per public disclosures circulating on 2 Nov 2025, CZ was reportedly exposed to SEED_WANDERIN_JIMZIP900:ASTER below ~$0.91, holding approximately 2.09M ASTER.
While not a signal, this adds sentiment confidence to the long-term accumulation narrative.
Long-Term Thesis
This phase appears to be early accumulation, not confirmation.
If HTF demand holds and structure flips bullish, $5–$10 becomes realistic, with $20+ as a full-cycle expansion scenario.
Disclaimer:
This is technical analysis & market discussion only — not financial advice.
Always manage risk and do your own research.

$ONDO ALTSEASON SETUP | 5,000%+ EXPANSION IF MACRO DEMAND HOLDSONDO is currently trading at a major weekly demand zone after an ~85% drawdown from ATH. While price action remains weak, on-chain data suggests silent accumulation, indicating potential smart money positioning ahead of the next cycle.
Market Structure (Weekly)
Bearish divergence confirmed at $2.14, marking the macro top
Breakdown + retest of the $0.73–$0.80 support zone → now acting as resistance
Price has entered a high-timeframe demand zone between $0.30–$0.20
A final retracement into bullish order flow ($0.32–$0.20) remains possible
Bullish bias remains valid above $0.20 (weekly close)
On-Chain Context (Jan 18, 2026 – 1.94B ONDO Unlock):
Whale spot orders dominating market activity
$0.35–$0.40 acting as an accumulation range
90D CVD trending higher → buy pressure outweighs sell pressure
Taker-buy dominance → aggressive smart money absorption
This behavior suggests unlock supply is being absorbed, not distributed.
Upside Projections (HTF Expansion)
Targets: $0.70 → $1.00 → $2.00 → $5.00–$10.00
Structure supports a potential RWA-led expansion into 2026 if demand holds
Key Level to Watch
Invalidation: Weekly close below $0.20
This $0.32–$0.20 zone may be the final bullish base for ONDO ahead of the next alt-season cycle
TA Only. Not Financial Advice. DYOR.

$DYDX PRICE OUTLOOK | 3000%+ POTENTIAL FROM MACRO SUPPORT?DYDX/USDT PRICE OUTLOOK | Macro Support & High R:R Setup
DYDX is currently trading at a major higher-timeframe demand zone on the 2-week chart, following an extreme ~99.45% drawdown from its all-time high. Historically, such deep retracements often precede long-term re-accumulation phases, especially when aligned with structural support.
Market Structure Overview
Price remains within a multi-year descending channel active since 2022. The current price action is testing the lower boundary of this channel, which aligns with a clearly defined horizontal accumulation zone ($0.15–$0.20). This creates a strong confluence-based support region.
Technical Confluence
Descending channel support respected on HTF
Strong historical demand at $0.15–$0.20
~99% retracement from ATH completed
Compression near support suggests potential volatility expansion
Bias remains bullish as long as HTF structure holds
Upside Levels (If Breakout Confirms)
Resistance 1: $0.84
Resistance 2: $2.19
Resistance 3: $4.39
ATH Supply Zone: $27.85
A confirmed HTF close above descending trendline resistance would validate a structural trend reversal. The measured move from this base projects toward $3.85, representing a potential ~3200% upside from current levels.
Invalidation
Any 2-week candle close below $0.15 invalidates the accumulation thesis and requires reassessment.
Conclusion
This setup reflects a classic falling-wedge / descending-channel structure meeting historical demand. While risk remains elevated, the risk-to-reward profile is asymmetric at this level. Patience, confirmation, and position sizing are essential.
Analysis Type: Technical Analysis
Timeframe: Long-Term / Positional
Bias: Accumulation → Trend Reversal (Conditional)
TA only. Not financial advice. Always manage risk.

$XRP PRICE PREDICTION | MULTI-YEAR BREAKOUT TOWARD $10+?CRYPTOCAP:XRP is trading above a confirmed multi-year breakout zone on the higher timeframe after completing a long accumulation phase.
Price has already delivered a strong expansion move and is now building structure for the next leg higher.
TECHNICAL OVERVIEW (HTF):
✔ Descending Wedge Breakout (2020–2024)
✔ 600%+ Expansion From $0.60 Breakout
✔ Fair Value Gap / Accumulation Zone: $1.30 – $1.90
✔ Higher-Timeframe Bullish Structure Intact
✔ Bullish Bias While Price Holds Above $1.30
TARGETS (CryptoPatel): $3.50 / $5.00 / $8.70 / $10+
INVALIDATION:
❌ HTF Close Below $1.30
Technical analysis only. Not financial advice. DYOR.

$FET Price Prediction | 5000% Potential From Macro Support?Market Context
NYSE:FET is currently trading at a major Higher Timeframe (HTF) support zone after a deep corrective move from cycle highs.
Price has retraced ~97% from ATH, a level historically associated with long-term re-accumulation phases.
Technical Overview (HTF)
✔ Macro ascending channel support intact (since 2020)
✔ Strong HTF demand zone at $0.20 – $0.19
✔ 97%+ retracement from ATH completed
✔ Channel support + demand confluence holding
✔ Bullish structure as long as price holds above $0.19
This area represents a high-risk / high-reward macro support with asymmetric upside potential.
Upside Targets (CryptoPatel Levels) $0.60 / $1.00 / $2.80 / $5.00 / $10.00
➡️ This implies a potential ~50x (5000%) move if the macro structure plays out.
⚠️ Invalidation Level
❌ HTF close below $0.19
A breakdown below this level would invalidate the macro bullish thesis.
Conclusion
As long as FET/USDT holds above $0.19, the macro bullish bias remains valid.
This zone could act as a long-term accumulation base before the next expansion phase.
TA Only | Not Financial Advice
Always manage risk and DYOR.

$AXS Crashed 98% From Its ATH. Now It Just Pumped 65% In One DayNYSE:AXS Crashed 98% From Its ATH. Now It Just Pumped 65% In One Day. Here’s What Changed:
After A Brutal -99.67% Drop From Its $166 ATH to $0.55, NYSE:AXS Is Finally Showing Strength.
Price Surged 65%+, Reclaiming $2 With $1.18 Billion+ Volume And Is Up Over 190% In The Past Month
Driven By A Major Tokenomics Upgrade:
🔹 Launch Of bAXS (1:1 Backed By AXS)
🔹 Rewards Stay Inside The Ecosystem
Technical View
Strong Bounce From $0.80–$1.00 Accumulation Zone
Now Holding $1.50–$2.00 As Support
New Accumulation Zone: Around $1.50-$1.20
Next Resistance Sits Around $3.80
Key Invalidation Below $0.75
Narrative: Gaming Tokens Are Catching Bids Again:
RON +20% | SAND +30% | MANA +21%
#AXS Was The King Last Cycle: Is NYSE:AXS Setting Up For A Run Back To Its $166 ATH?
NFA | DYOR

Altseason 2026 Will Be Bigger Than 2017 & 2021 Combined Altseason 2026 Will Be Bigger Than 2017 & 2021 Combined 🚀
OTHERS/BTC (Altcoins Vs Bitcoin) Is Back At The Same Support Level That Triggered Every Major Altcoin Cycle.
2017: +423% Rally
2021: +503% Rally
2026: ~702% Projected Move
Every Cycle This Ratio Bounces, Small Caps Go Parabolic And 10x–100x Opportunities Are Born.
The Only Question That Matters Now:
Are You Early Or Too Late?
NFa & Always DYOR
