Will Polkadot Hit $50 Again ?Polkadot Looks Ready to Explode — $3 Might Be the Bottom, and $30+ Could Be Next
DOT is consolidating in the $4–$3 Accumulation Zone, right at the retest of a multi-year trendline breakout.
🔹 IMO: Best accumulation range = $4.00–$3.00
🔹 Holding this zone could trigger a macro reversal
🔹 HTF structure favors bullish continuation if support holds
Targets = Key resistances: $9.24 / $16.67 / $40.85
Expecting $30+ this bull run- $50 is the bonus target.
❌ Invalidation: HTF close below $3 = Exit
NFa & DYOR
ALTS

ENA/USDT Now 200% up from our EntryMIL:ENA Update: Strong Momentum in Just a Few Days
I shared an early entry below $0.25, and now MIL:ENA is trading above $0.67 that’s nearly 2.8x your capital from our entry.
Both Target 1 and Target 2 have already been hit.
I remain very bullish on MIL:ENA for the long term, with a potential to reach $5. However, keep in mind the risk is higher at this stage, but the reward could be significant if it reaches that level.
If you entered early, consider booking some profits or at least secure your principal and let the rest ride.
Thanks to everyone who trusted my analysis, slow and steady can bring big returns.
NFA & DYOR

is $VIRTUAL about to fly to $8?Don’t ignore this setup – is SPARKS:VIRTUAL about to fly to $8?
Price action is currently displaying a bullish flag structure on the daily chart — a continuation pattern following a strong impulse leg.
🔸 Impulse Move (Flagpole): +335% vertical rally
🔸 Consolidation Phase: Descending parallel channel forming the flag
🔸 Market Structure: Bullish continuation intact as long as the lower trendline holds
Technical Levels:
▪️ Support Zone: $1.30–$1.10 (confluence of demand & trendline support)
▪️ Breakout Confirmation: Clean daily close above $2.00 with elevated volume
▪️ Projected Target: $8.18 (measured move = flagpole height from breakout level)
Observations:
▪️ No structural breakdown observed — price respecting flag support
▪️ Volume remains muted during consolidation — typical in bullish flags
▪️ Breakout potential increases if price compresses toward apex with decreasing volatility
Invalidation: Break below $1.10 on high volume would shift bias neutral/bearish.
Strategy: Watch for breakout + retest confirmation above $2.00 to target $8.18. Risk can be defined below lower trendline support.
Note: NFa & DYOR

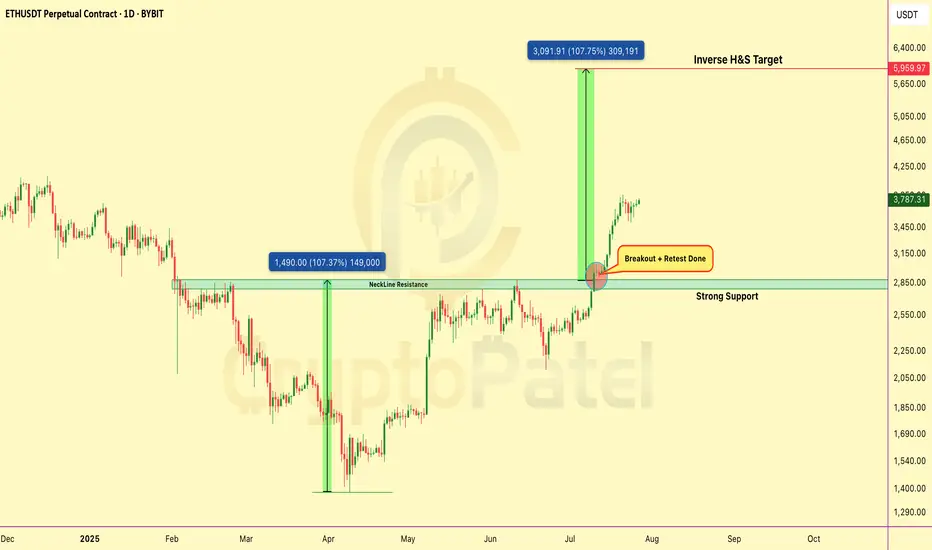
Ethereum Breakout Confirmed – Retest CompletedCRYPTOCAP:ETH has broken out Inverse Head & Shoulders on daily chart.
✅ Neckline breakout above $2,850
✅ Retest successful – strong support confirmed
✅ Targeting full move toward $6,000
Structure is bullish, momentum building. As long as #Ethereum holds above the neckline, continuation is likely.
Note: NFA & DYOR
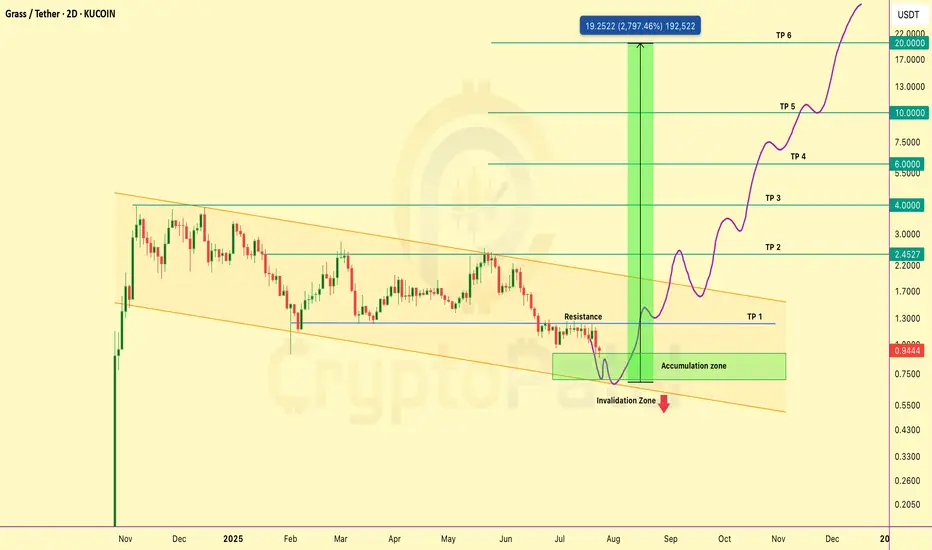
GRASS could grow 10x in this bull run: Don’t ignore this AIGRASS could grow 10x in this bull run: Don’t ignore this AI project
Price is consolidating inside a falling wedge and holding the key accumulation zone around $0.60–$0.85.
A breakout above trendline resistance could trigger a strong bullish move.
🔸 Structure: Falling wedge
🔸 Invalidation: Close below $0.55
Targets on breakout: $1.30 / $2.45 / $4 / $6 / $10 /$20
Fundamental Highlights
🔹 DePIN x AI powered by Solana
🔹 Share your unused internet and earn $GRASS
🔹 Backed by Polychain & Tribe Capital
🔹 Over 2M users across 190 countries
🔹 ZK-proof privacy, passive income, and scalable L2 infra
🔹 Only 29% supply unlocked, next major unlock in Oct 2025
This isn’t just another altcoin. GRASS is building the decentralized data layer for AI.
NFA & DYOR
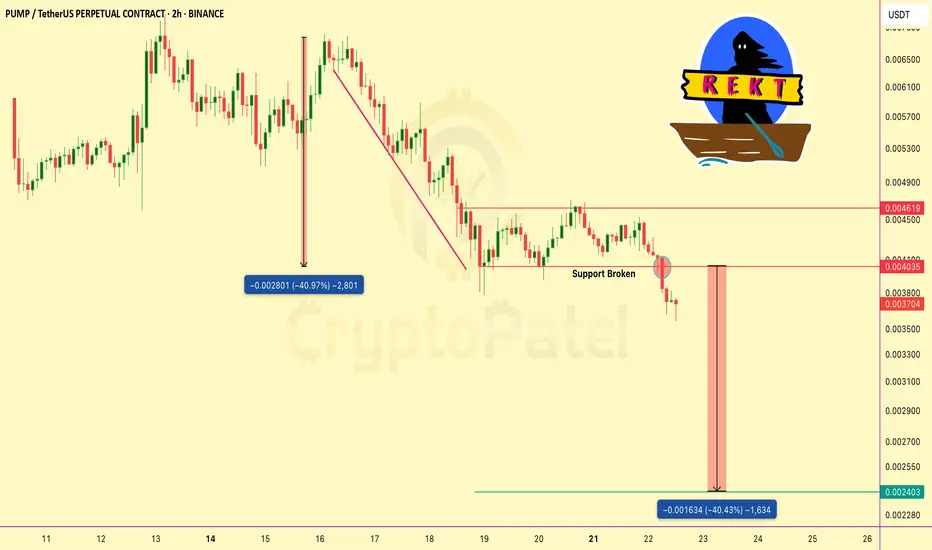
PUMP just lost a major support level—is another 40% drop coming?Caution: PUMP just lost a major support level — is another 40% drop coming?
The chart shows a clear breakdown in structure after price lost key support at 0.004035.
That level acted as a strong base during the recent consolidation, but once broken, it triggered strong selling pressure.
Retest Failed:
Price attempted to reclaim the support zone but faced rejection and a bearish retest, confirming the breakdown.
Previous Drop:
🔸 We already saw a major drop of nearly 50% earlier.
🔸 Now, the projected move suggests a similar drop is likely, targeting the 0.0024 zone and a possible liquidity pool and demand area.
Bias:
🔸 Momentum remains bearish below 0.004035.
🔸 Unless price reclaims and holds above that level, the structure favors downside continuation.
Keep managing your risk. Avoid chasing entries blindly. More updates soon.
NFa & DYOR
will $LTC/USDT ready for $500 in bull run?CRYPTOCAP:LTC Took Off from $55 — Now Gaining Momentum Again, and $500 Might Be Closer Than You Think
CRYPTOCAP:LTC has delivered strong gains from both our entries:
✅ First entry at $55 — now up 140%
✅ Second entry at $70 — currently up 85%
Currently, CRYPTOCAP:LTC is trading around $117, sitting right at a key resistance level.
If this resistance breaks, we could see a strong rally toward $300–$500 in this bull run.
My Target:
I’m still expecting $500 as a realistic target and anything beyond that is a bonus.
NFA & DYOR

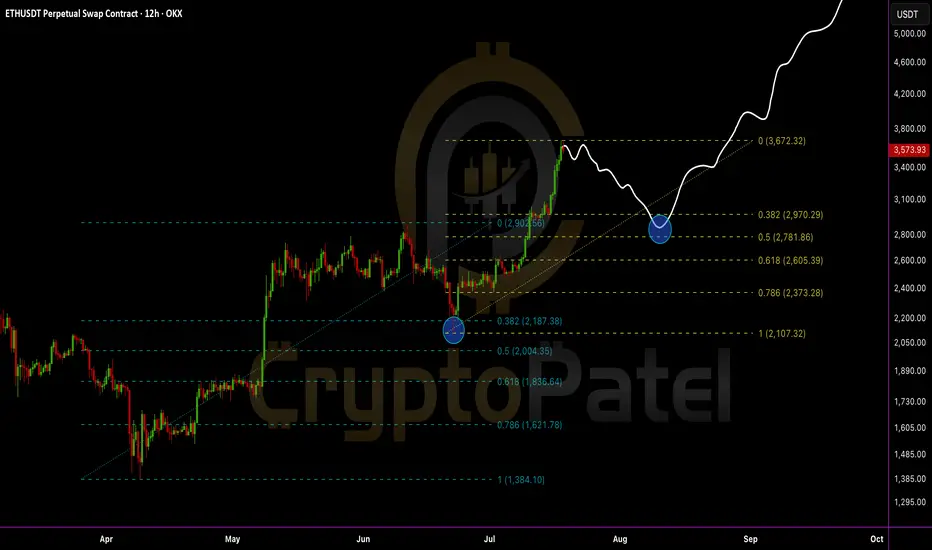
Everyone’s bullish now… but smart traders are waiting for this EEthereum just tapped a key resistance near $3,672 and is starting to show signs of cooling off.
A healthy retracement could bring ETH back to:
0.382 Fib – $2,970
0.5 Fib – $2,781
0.618 Fib – $2,605 (Strong demand zone)
IMO, we can expect ETH to revisit the $2,700–$3,000 zone before the next leg up.
This area will be the golden re-entry for long-term targets of $6,000–$8,000.
Stop-loss: Recent high and candle close above $3,675
Structure remains bullish:
✅ Previous dips into Fibs triggered strong buybacks
✅ Clean higher highs and higher lows
✅ Demand zone + retracement = opportunity
My View: Let price pull back. Then load up again. Bigger wave incoming.
DYOR | NFA
$XRP just broke its all-time high: $3.66CRYPTOCAP:XRP just broke its all-time high: $3.66 — and this is just the beginning?
After years of waiting, XRP finally explodes past $2 and hits $3.66 this bull run. It’s not just a win for XRP holders — it’s a lesson in patience, conviction, and catching early setups before the hype.
Why it matters now:
🔹 While everyone’s chasing the latest meme coin, XRP silently did a clean 7x from $0.50.
🔹 Regulatory clarity is improving — XRP’s bullish narrative is finally unfolding.
🔹 Market rotation is real: old giants like XRP are moving again, and this signals strength in Layer 1 comeback plays.
Quick breakdown:
📌 First signal at $0.50 → 7x
📌 Second entry below $2 → already 2x
📌 Current price: $3.66 (ATH)
📌 Many ignored it, some mocked it — but price tells the truth.
Patience beats hype. Quality setups > chasing pumps.
Save-worthy takeaway:
If you ever feel FOMO, remember this:
The best trades aren’t loud. They’re early, quiet… and require conviction.
What’s your biggest “I told you so” moment in this bull run?👇
Let’s hear your favorite early calls — drop them in the replies!

is Ethereum ready to $10,000Ethereum just broke out of a massive inverse head & shoulders and it’s flying past $3,400 again after 5 months. 🚀
Chart looks Bullish for a run toward $6K… but don’t be surprised by a dip to ~$2,800 first.
ETH is super bullish.
Next stops: $6K → $8K → $10K.
NFA & DYOR

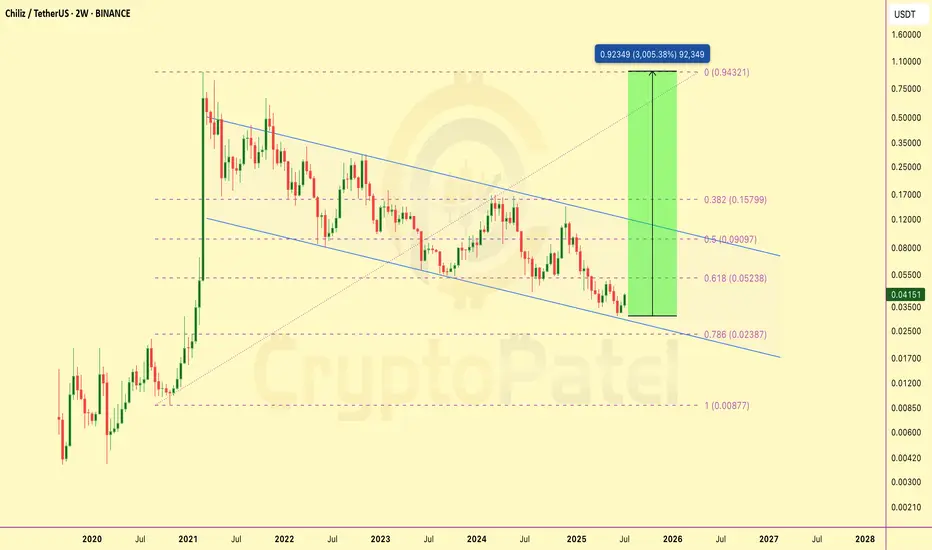
$CHZ did a 30x in 2021. Nobody cared until it was too lateBack in 2021, Chiliz ( GETTEX:CHZ ) delivered a 30x move — climbing from a $130M to $4B market cap in just a month. That move was fueled by strong fundamentals and massive hype around fan tokens.
Fast forward to now — price is sitting at the bottom of a multi-year falling wedge on the 2W timeframe. It just tapped the 0.786 Fibonacci retracement and showed a strong bounce with rising volume — a classic sign of potential reversal.
With solid partnerships, real-world utility, and a historical setup this clean, I’ve started building my position here. If the wedge breaks out, upside targets line up around $0.05 → $0.09 → $0.15 → $0.90 — back toward ATH levels.
Bottom might be in. Watch this closely.
Note: NFa & DYOR
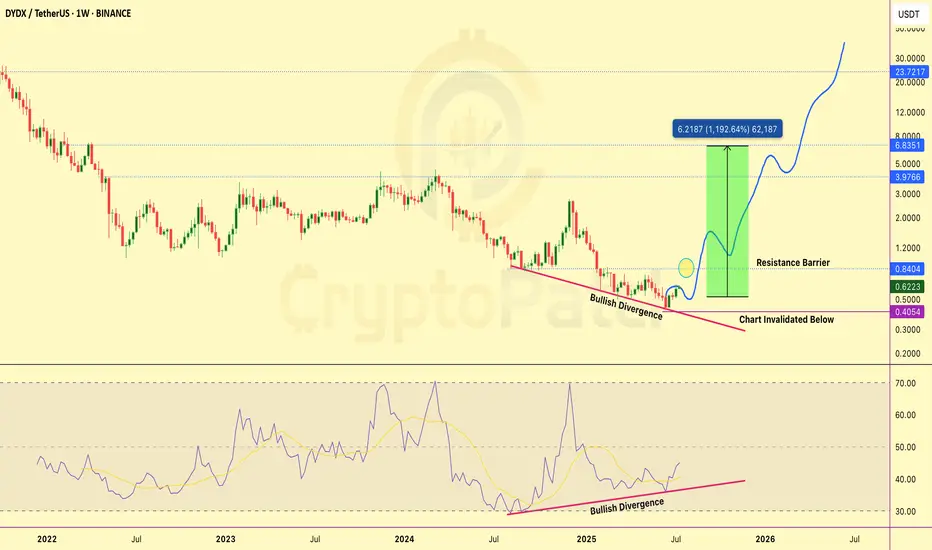
DYDX could be one of the biggest 10x plays this cycle DYDX is finally showing strong reversal signals after months of downtrend.
What’s happening?
We’ve spotted a clear Bullish Divergence on both the price chart and RSI. While the price made lower lows, RSI is printing higher lows — a classic signal that selling pressure is weakening and buyers are stepping in quietly.
Key Levels to Watch:
🔹 Support (Invalidation Zone): $0.405
🔹 If price breaks below this level, the bullish setup is invalid.
🔹 Resistance Barrier: $0.84
Once DYDX closes above this level, a major breakout could unfold.
Upside Potential (if breakout confirmed): $0.84 / $3.97 / $6.83 / Bonus
RSI is also trending upward, confirming hidden strength in the move. Volume is gradually picking up too — another positive sign.
If this divergence plays out fully, we’re looking at a potential 10x+ move from here. Keep a close eye on the $0.84 breakout zone — it could be the ignition point for a major rally.
Always trade with SL and proper risk management.
This is NOT financial advice. Just sharing what I see on the charts.
THETA Price Prediction: Can It 20x From This Weekly Support ZoneMYX:THETA is now trading at a strong support area — the same zone where it started big moves in the past.
In previous cycles, from this level:
🔹 THETA went up over 2,700% (to $15.38)
🔹 Later, it again moved up around 570% (to $3.23)
🔹 Now, it's showing signs of a similar bounce from the same level.
Possible Future Price Levels:
Targets: $0.95 / $3.18 / $7.51 / $14.02
These are levels to watch if the upward trend continues.
⚠️ Risk Point:
If THETA falls and stays below $0.65, the setup will no longer be valid and it may go lower.
THETA – Fundamental Overview
🔹 THETA is a blockchain built for decentralized video streaming.
🔹 It lets users share internet bandwidth to help deliver videos and earn TFUEL in return.
Key Use Cases:
🔹 Powering video apps like Theta.tv
🔹 Creator-focused NFTs and content access
🔹 Web3 streaming, gaming, and AI tools
Backed by Big Names:
Google Cloud, Samsung, Sony, CAA, and more.
Real adoption, not just hype.
Token Model:
🔹 THETA: Staking + governance
🔹 TFUEL: Gas + rewards
Fixed supply = No inflation risk
Why It Matters:
As Web3 and AI grow, THETA could become the backbone of content delivery.
Key Takeaway:
🔹 This zone has worked well as a bounce point before.
🔹 THETA is reacting from it again now.
🔹 The potential reward is high, and the risk is limited if managed properly.
Keep an eye on it. This might be a good setup for long-term traders.
Let us know your thoughts & Would you invest in projects like THETA? 👇
Note: NFA & DYOR

If $NEAR hits $50, will you regret not buying at $2?🚨 NEAR/USDT Weekly Chart Update 🚨
NEAR has bounced from a strong weekly support level inside a multi-year triangle. This bounce looks powerful and could be the start of a major move.
🔹 Current Price: $2.51
🔹 Entry Zone: $2.00–$2.50
🔻 Invalidation Level: Below $1.80 (if price drops here, the setup fails)
This bounce could lead to a big rally in the coming months.
🟢 Target Levels:
$3.30
$7.77 – Mid-term resistance
$16.72 – Bullish target
$30 to $50 – Long-term upside if momentum builds
That’s up to 2000% potential upside from current levels.
Pullbacks between $2.50–$2 can offer another good entry.
Key Point: This bounce from support looks like the early stage of a larger uptrend. It's a good time to position slowly and carefully — but always manage your risk.
What’s your view on NEAR’s bounce?
Note: NFA & DYOR

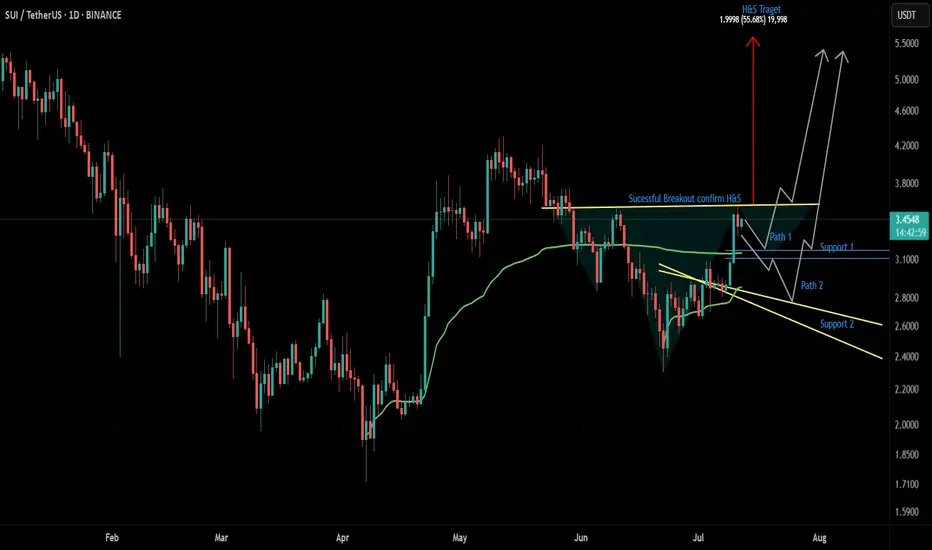
$SUI Inverse H&S FormingA large inverse Head & Shoulders pattern appears to be forming on $SUI. The $3.1758 zone looks like a solid area to long — potentially marking the bottom of the second shoulder. If a deeper correction occurs, I'm also watching the $2.7473 level for another possible long entry.
My plan is to pre-position by longing near the second shoulder. Once $3.5902 breaks and we get a successful retest, the pattern would be confirmed. From there, a 50% move up toward the neckline target of $5.6252 could follow.
This is not financial advice. Trade at your own risk.
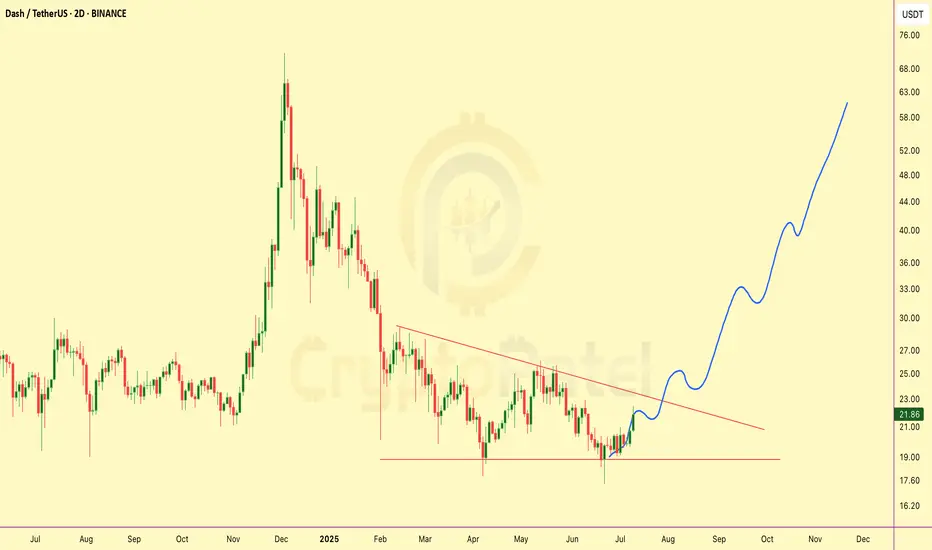
$DASH breakout loading… 100%+ upside in sight!NASDAQ:DASH breakout loading… 100%+ upside in sight!
Price swept liquidity and bounced strong. Now aiming for a major trendline breakout. If it clears, $50 → $60+ is on the cards.
Drop your target
Retweet if you see the setup
Note: NFA & DYOR
$ETH IS FLIRTING WITH A MASSIVE BREAKOUTCRYPTOCAP:ETH IS FLIRTING WITH A MASSIVE BREAKOUT
Price is hovering just below the HIGH LIQUIDITY ZONE at $2,867 — a major inflection point!
✅ Break above… We could see a parabolic push toward ATHs.
❌ Rejection = A sharp correction might hit hard.
It’s make or break time for Ethereum.
What’s your plan if this breaks?
NFA & DYOR

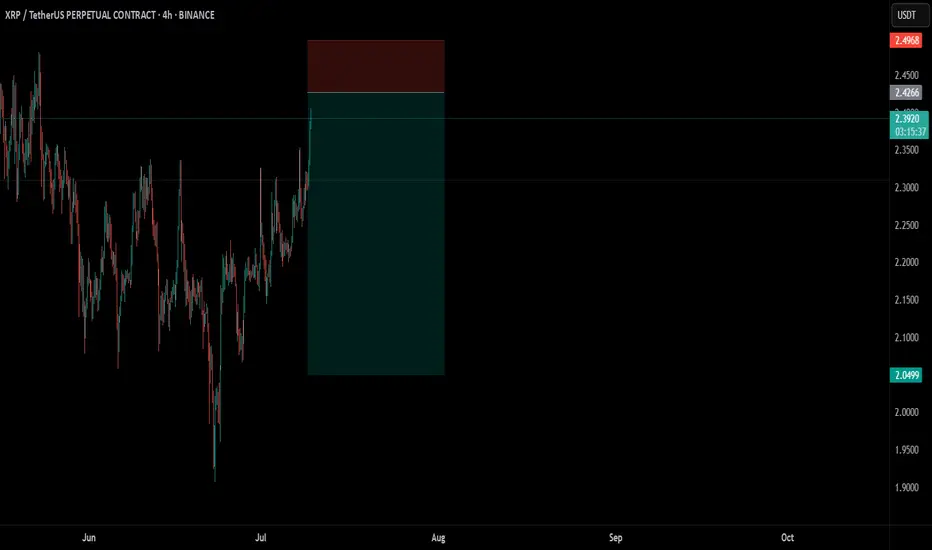
XRP Short OpprtunityThe $2.4261 level looks like an attractive entry point for a small CRYPTOCAP:XRP short position, as it aligns with a historical demand zone.
This is not financial advice. Always trade at your own risk.
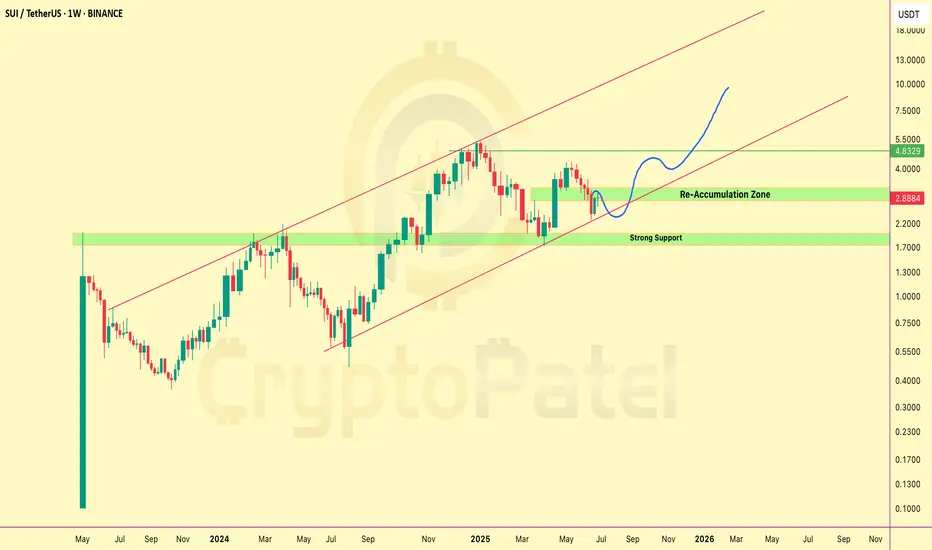
SUI to $10, $20.. Even $50? The Setup Looks Insane-Weekly ChartSUI is trading around $2.89, currently sitting in a key re-accumulation zone after a correction.
Trend: Still holding inside a long-term uptrend channel — structure remains bullish.
Support Zones:
🔹 $2.00–$2.50 is a strong demand area
🔹 $1.70 is a critical support — bullish above this,
but if price breaks below, we may enter major bearish mode
What to watch: If SUI holds this zone and continues upward:
🔹 Short-term target: $5/$10
🔹 Long-term potential: $20 → $50
I’m watching the $2.50 zone closely for possible long entries.
This could be a solid long-term opportunity if support holds.
NFA. DYOR.
ETH Long Setup: Key Support Zone at $2,453.72The $2,453.72 zone on CRYPTOCAP:ETH looks promising for our next potential long setup.
It’s a key support level and holds significant liquidity—definitely a zone worth watching.
This is not financial advice. Always trade at your own risk.

BCH Could 10x in the Next Bull Run — But Not YetBCH Could 10x in the Next Bull Run — But Not Yet
Bitcoin Cash is still trading inside a big falling channel.
Every time price hits the lower zone at Bull Flag, it bounces back up — this is the strong Support / Entry Zone.
Right now, BCH is near the upper Trendline Resistance (~$550-$580).
But IMO, we could see one more retracement before the next big bull run. I’m expecting price to revisit the $250–$210 zone before the next leg up.
However, if BCH breaks and holds above $640, that would confirm a bull flag breakout — turning the structure fully bullish with potential long-term targets between $1,800 – $4,000+ by 2026–2027.
Stay alert. The setup is big — but timing is key.
Note: NFA & DYOR

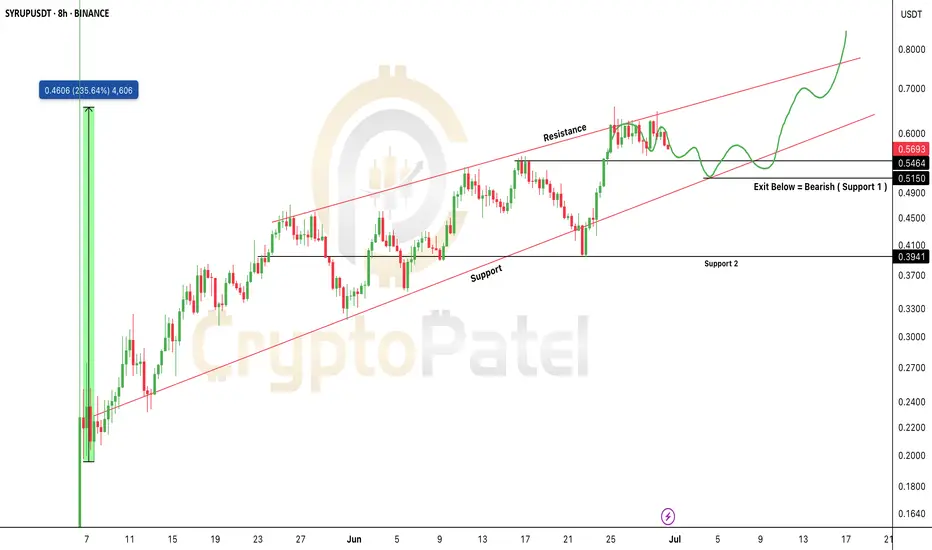
$SYRUP Price Prediction Analysis as per Ascending ChannelSYRUP/USDT – Technical Chart Update (8H Timeframe)
SYRUP is trading inside a clean ascending channel, showing a bullish structure with higher highs and higher lows.
Key Levels to Watch:
Support: $0.51
Resistance Targets: $0.70 → $0.80+
Exit Level: Bearish if price breaks below $0.51
Current Setup:
Price is respecting the lower trendline of the channel. A bounce here could lead to another leg up toward resistance.
Strategy:
Bullish bias as long as SYRUP holds above $0.51
Ideal zone to look for buy opportunities on dips
Exit or hedge if price closes below $0.51
Important Note:
If CRYPTOCAP:SYRUP holds the $0.51 support, it could soon enter the $1 club 🚀
But if it drops below $0.50, we may see a 30–50% retracement.
So always watch the chart closely before entering any trades.
Note: NFA & DYOR
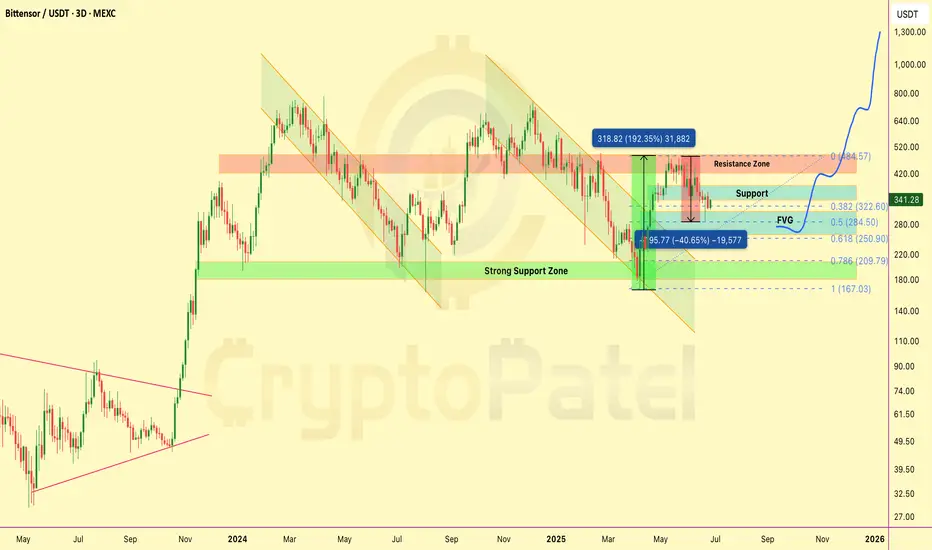
$TAO dumped 40% — exactly as predicted.LSE:TAO dumped 40% — exactly as predicted.
If you didn’t buy the top, you saved cash.
If you shorted near $500, you printed 200%+ profit on 5x.
Now what?
Price bounced cleanly from our FVG zone
Accumulation zone: $250–$200 — it’s coming...
I’m still aiming for $3,000–$5,000 this cycle.
Don’t rush. Accumulate smart.
Patience = profits.
What’s your LSE:TAO game plan now? 👇