*Ambuja Cement cmp 634 by Monthly Chart views since listed* *Ambuja Cement cmp 634 by Monthly Chart views since listed*
- Add the stock to your watchlist and Keep it on radar for new ATH Milestone in the making process
- *A Blast from the past to ponder upon. Is it like History going to repeat itself with the Rising Parallel Price Channel continuation ?*
Ambujacement

ambuja cement are accumulation ambuja cement high vol activity detected and the institution entered the market and institution collected the required volume and The institution are going to up the Ambuja cement

AMBUJA CEMENTS LTD Looks BullishAMBUJA CEMENTS LTD is trading above it's All time high (ATH) and is at 617.60. Next Target seems to be at 767 as per Fib Retracement.
Note: This Idea is just for educational purpose. Do not trade based on this idea. Do you own analysis before trading.

Ambuja Cement : About to give huge breakout 📈 Exciting Bullish Pattern Alert! 🐂
📊 Pattern: Broadening Pattern
📌 Symbol/Asset: AMBUJACEM
🔍 Description: Stock has formed Broadening Pattern and its around the resistance of the pattern.
We can see huge momentum if stock is able to cross 530-540 levels on the upside.
👉 Disclosure: We are not SEBI registered analysts, this is not a buy or sell recommendation.

2 Amazing swing trade ideas for 5 December I daily make educational content videos for swing / positional trading

Swing Buy Opportunity in Ambuja CementsRefer the chart for Entry,Target and SL.
NOTE: This trade is only for Equity Swing buy and not to be considered for options trading.
Please do follow Position Sizing and Risk Reward Ratio while planning any trades.
Note: This information is for education purpose only and please do your own research and consult your financial advisor prior to taking any action.
TO CONNECT WITH ME CHECK OUT MY BIO.
If you like this Idea, Please do like my ideas and share it with your friends. check my bio.
Please boost my ideas and send cheers as it acts as a motivation to keep posting my analysis.
Thank you

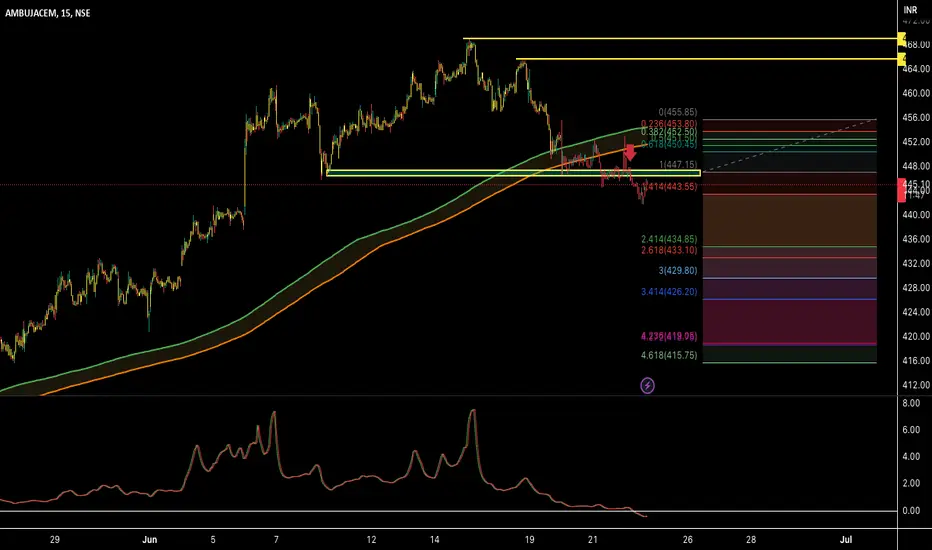
Ambuja cement to take long entryLong Ambuja above 450 for the target level of 482-500. All important levels have been marked on the charts. The logic behind the trade:
1) Stock price rising from the lower channel. Bullish candles have been seen from the support of the channel.
2)Entry after the BO of 50 EMA level.
3) Support taking from 200 EMA level.
Also, volume & RSI divergence will lead to a High probability that the stock will bounce back.
This is for your educational purpose only.

swing trading idea AMBUJA CEMENT longoverall trend is up so my view is bullish, entry and exit price will be like this: buy above 442.05 tgt 469 sl 419

AMBUJA CEMENTS - BULLISH IN LONG TERM!BUY - AMBUJA CEMENTS LTD
CMP - Rs. 378
Target - 1: Rs. 472
Target - 2: Rs. 586
.
.
.
Technicals - Harmonic Patterns
.
Comment: Consolidation must take place in order to achieve Target - 2
.
.
Follow me for more!

AMBUJA CEMENTS 1H TFLooking good for short opportunities once the trendline is broken can give a nice momentum as it's been a buying trendline.
Please do follow me for more such trades nd do check out my previous analysis.

AMBUJA SHORTtime frame 15 min, price moving below my moving average with a momentum on downside post retest.
Ambujacement 1Dtf breakdown Ambuja cement 1Dtf breakdown from a beautiful trendline with six previous supports
Bearish in both 1htf and 1dtf

Ambuja cement given breakout of falling trendlineMACD, RSI, and price action indicating a price reversal from these levels. Please keep a watch for tomorrow. Chances are high we can see upside till 415+ levels. right now it is trading at 406.
Use proper stop loss to go long.
Please like, follow and comment.
thankyou

Ambuja Cement: Is there life in this cement?Technical Analysis :
Strength : Weak
Chart Type: Daily
Chart Pattern : Ascending Triangle
RSI : Above 50
Price : Above 20 MA and below 200 MA
View: Breakout and Positive results
Targets : 415, 426, 437, 450
Supports : 394, 375
The price is currently below the 200-day moving average. This suggests that there is a possibility that the price may not move soon, but instead slowly move up.

AMBUJA CEMENTS | GOOD INVESTMENT BETAmbuja Cement looks a good bet for investment, we saw a great rally in Cement Stocks but this couldn't perform because of Adani Saga.
To motivate us, Please like the idea If you agree with the analysis.
Happy Trading!
InvestPro India Team

AMBUJA CEMENTSMarket Cap 115,614 Cr.
Promoter holding 63.2 %
Pledged percentage 100 %
Stock P/E 63.1
Industry PE 29.3
Dividend Yield 1.09 %
ROCE 22.1 %
ROE- 11.8 %
OPM 13 %
Debt to equity 0.02
Free Cash Flow 3,013 Cr.
EPS 9.04 vs 14

AMBUJACEM- The Crash Is Coming #Ambujacem
forming a corrective pattern 'ABC' with a triangle in B.
It should be retrace 100% very soon.
expecting Wave C = 0.618 Wave A i.e near 415-420.

#Ambuja Cements trying to break strong resistance!Stock is facing strong resistance at marked levels with supportive Trendline, keep watch for BO for a good returns.

2 Amazing Support based Ideas for the upcoming week I daily make educational content videos for swing / positional trading

Trade Idea on Ambuja Cement with Price action notes In the above chart, the price action goes like this.
1) 50-60% Fibo retracement zone - Stock after a substantial fall getting lots and lots of demand from this zone
2) Its fibo retracement - Used from a swing low to swing High
3) Its called a counter trendline - stock currently getting demand on the extended CT, as a result of breakout and bigger time frame retest
4) It's called a trendline, made from a swing low point to another swing low, extended forward, giving a demand zone
5) Its called a Confluence zone, Candlestick pattern is bullish pressure, lower wick multiple rejection on W time frame and cluster of many other demand areas
6) 3 Yellow lines are potential Target zones from CMP.

Ambuja cementAmbuja cement
415 above sustain 10 minutes candle then buy intraday
(why buy logic SL HUnting Technic many seller stop loss put above 415 above market break Then buy)
+ trendline support,okh
Condition Apply only 415 above

AMBUJA CEMENT INTRADAY SET FOR 21.02.2023So , here I share with you the strategy for Intraday Trading for AMBUJA CEMENT . On daily time frame the Stock with CMP as 352.45 has already entered the reversal pattern and has potential to go trend up till 595. On lower time frame , i.e. 15 Mins , the stock is in range. If Stock Breaks this range , as detailed in the chart , we can enter the trade with different entry levels and targets.
Remember , the Chart has just entered the uptrend and thus we shall only look for the opportunities to buy.
Our First Condition to enter the trade is Break out @ 356.75
Technical Indicators on 15 mins candle :
CMP : 352.45
MA50 : 350.07
MA200 : 352.31 ( Making Golden Cross Over)
RSI : 55.62
ADX(14) : 24.26 ( Directional Strength )
ATR (14) : 2.6 ( High Volatile )
To understand Market Structure at daily frame, please refer to the link.
Share your Views and boost my idea if you agree :)

AMBUJACEM @ 349 - Analysis on 20-Feb-2023AMBUJACEM @ 349 - Analysis on 20-Feb-2023
As long as 271/132 holds support, We can see 586, 777-823, 1089-1133 in the long run.
