SILVER RANGE CONSOLIDATION Silver Strong weekly resistance 90-96$
Above 84$
Let’s test 90$ and pullback for next leg up.
Entries valid after 90$ test and pullback.
Till then look for weekly close above 90$_96$
Analysis

EURUSD - 4H - SHORTFOREXCOM:EURUSD
Hello traders , here is the full multi time frame analysis for this pair, let me know in the comment section below if you have any questions, the entry will be taken only if all rules of the strategies will be satisfied. wait for more Smart Money to develop before taking any position . I suggest you keep this pair on your watchlist and see if the rules of your strategy are satisfied...
Keep trading
Hustle hard
Markets can be Unpredictable, research before trading.
Disclaimer: This trade idea is based on Smart money concept and is for informational purposes only. Trading involves risks; seek professional advice before making any financial decisions. Informational only!!!

Market Fundamentals: A Comprehensive Overview1. Definition and Importance of Market Fundamentals
Market fundamentals can be defined as the underlying forces or conditions that influence the supply and demand of financial instruments, ultimately determining their prices. These fundamentals are rooted in economic indicators, corporate performance, geopolitical developments, and investor sentiment.
The importance of market fundamentals lies in their ability to:
Provide a rational basis for valuing securities.
Help predict long-term trends in asset prices.
Allow investors to identify mispriced assets and investment opportunities.
Assist in understanding macroeconomic conditions and their impact on various sectors.
By studying market fundamentals, investors can make informed decisions rather than relying solely on speculation or short-term price fluctuations.
2. Key Components of Market Fundamentals
Market fundamentals consist of various factors that can be broadly categorized into economic fundamentals, financial fundamentals, and qualitative factors.
a) Economic Fundamentals
Economic fundamentals are indicators that reflect the overall health of an economy and influence market performance. These include:
Gross Domestic Product (GDP): GDP measures the total value of goods and services produced within a country. A growing GDP signals economic expansion, increased corporate earnings, and potentially higher stock prices. Conversely, declining GDP indicates a slowdown or recession, which can negatively affect markets.
Inflation Rates: Inflation measures the general rise in prices over time. Moderate inflation is often a sign of a healthy economy, but high inflation erodes purchasing power and can lead central banks to raise interest rates, impacting asset prices.
Interest Rates: Set by central banks, interest rates influence borrowing costs, corporate profits, and consumer spending. Lower interest rates encourage investment and spending, typically boosting stock markets, whereas higher rates can dampen economic activity.
Employment Data: Employment levels, wages, and unemployment rates reflect economic productivity and consumer purchasing power. Strong employment data usually boosts market confidence, while rising unemployment may lead to reduced spending and market corrections.
Trade Balance and Currency Strength: A country’s imports, exports, and currency value affect corporate earnings, particularly for multinational companies. A strong currency can reduce export competitiveness but lower import costs.
b) Financial Fundamentals
Financial fundamentals focus on the health, performance, and valuation of individual companies or sectors. Key metrics include:
Revenue and Earnings Growth: The primary indicators of corporate performance are revenue (sales) and net income (profit). Consistent growth signals strong management and potential for long-term stock appreciation.
Profit Margins: Profitability ratios, such as gross, operating, and net profit margins, measure efficiency and cost management. High margins often indicate competitive advantage and financial strength.
Return on Equity (ROE) and Return on Assets (ROA): ROE shows how effectively a company uses shareholder capital, while ROA measures how efficiently assets generate profits. Higher returns typically attract investors.
Debt Levels: The debt-to-equity ratio and other leverage indicators reveal financial risk. Excessive debt can lead to solvency issues, especially in economic downturns, while manageable debt supports growth and expansion.
Cash Flow: Cash flow from operations reflects a company’s ability to generate liquidity for reinvestment, debt servicing, and dividends. Strong cash flow indicates financial stability.
Valuation Metrics: Ratios such as Price-to-Earnings (P/E), Price-to-Book (P/B), and Price-to-Sales (P/S) help investors assess whether a stock is overvalued, undervalued, or fairly priced relative to its fundamentals.
c) Qualitative Factors
Not all market fundamentals are quantitative. Qualitative factors also play a crucial role in determining asset value:
Management Quality: The experience, strategy, and integrity of a company’s leadership affect its long-term success. Good management can navigate market challenges effectively.
Industry Position and Competitive Advantage: Companies with strong brand recognition, technological superiority, or unique market niches tend to outperform competitors.
Regulatory Environment: Government policies, taxation, and regulations can impact profitability and market behavior. For instance, subsidies or trade tariffs can boost or hinder specific sectors.
Geopolitical Stability: Political unrest, international conflicts, and diplomatic relations influence investor confidence and capital flows, affecting markets.
3. Market Fundamentals in Different Asset Classes
Market fundamentals apply across various financial markets:
Equities (Stocks): Stock prices are influenced by company earnings, sector performance, and macroeconomic indicators. Strong fundamentals often indicate long-term investment potential.
Bonds: Bond prices are affected by interest rates, inflation, and credit ratings. Investors look for stable returns and low default risk.
Commodities: Commodity prices depend on supply-demand dynamics, production costs, geopolitical events, and weather conditions. For example, oil prices are highly sensitive to OPEC decisions and global demand trends.
Foreign Exchange (Forex): Currency values are influenced by trade balances, interest rates, inflation, and political stability. Strong economies and fiscal policies attract foreign investment, strengthening the currency.
4. Fundamental Analysis vs. Technical Analysis
While market fundamentals focus on intrinsic value, technical analysis examines historical price patterns and trading volumes to predict short-term market movements. Both approaches complement each other:
Fundamental analysis is long-term oriented, aiming to identify undervalued or overvalued assets.
Technical analysis is short-term oriented, useful for timing entries and exits based on market psychology and trends.
Savvy investors often combine both to make well-informed decisions.
5. Challenges and Limitations of Market Fundamentals
Despite their importance, relying solely on fundamentals has challenges:
Market Sentiment: Emotional behavior, speculation, and herd mentality can cause prices to deviate from fundamental values. For example, during a bubble, assets may be overvalued despite weak fundamentals.
Data Accuracy: Economic and corporate data can be revised, delayed, or manipulated, affecting analysis accuracy.
Complex Interdependencies: Globalization means that local economic changes can have far-reaching effects, making prediction more complicated.
Time Lag: Fundamental changes often take time to reflect in market prices, leading to potential short-term volatility.
6. Practical Applications of Market Fundamentals
Investors and traders use fundamentals to:
Identify long-term investment opportunities by spotting undervalued assets.
Develop portfolio strategies that align with economic cycles and sector performance.
Assess risk by evaluating financial stability, debt levels, and external threats.
Make informed decisions during mergers, acquisitions, and capital investments.
For institutions, market fundamentals guide policy-making, monetary decisions, and strategic planning.
7. Conclusion
Market fundamentals form the backbone of informed investment decision-making. By examining economic indicators, corporate financial health, and qualitative factors, investors can assess the intrinsic value of assets and anticipate market trends. While markets can be influenced by sentiment and speculation, a strong grasp of fundamentals provides a reliable framework for long-term financial success.
In an increasingly complex and interconnected world, understanding market fundamentals is not just a tool for investors but a necessity for navigating the dynamic landscape of global finance. By combining analytical rigor with strategic insight, individuals and institutions alike can make smarter, more sustainable decisions, achieving financial growth while mitigating risk.

Intraday Institution Trading in Nifty and Banknifty BANKNIFTY Institutional Behavior
BANKNIFTY moves faster due to lower liquidity + banking stock hedging.
Institutions:
Accumulate ATM options early
Trigger stop hunts near high OI strikes
Expand range post 11:30 AM when gamma pressure builds
High-Probability Institutional Intraday Trades
VWAP Reclaim + OI Unwinding → Trend day setup
High OI Rejection + IV Drop → Mean reversion
Break of Call-Writer Zone with Volume → Momentum expansion
Institutional Rulebook
Trade levels, not emotions
Follow option writers, not candles
Price moves to hurt the maximum number of option holders

Advanced Intraday Institution Option TradingAdvanced Intraday Institutional Option Trading
Institutional intraday option trading focuses on order flow, volatility expansion, and hedging behavior, not prediction. Institutions deploy capital where liquidity, gamma, and vega sensitivity allow fast risk adjustment—usually in near-expiry (0DTE–3DTE) index options.
Institutional Interpretation
Max Call OI at 21,500 → Heavy call writing → Resistance
Rising Put OI at 21,400 → Strong downside hedge → Support
IV spike on Calls above 21,500 → Short covering risk → Breakout fuel
Balanced IV at ATM → Volatility expansion likely
High-Probability Intraday Trades
Gamma Scalping: Buy ATM options when IV expands + price holds VWAP
Directional Break: Long calls above call-writer resistance with OI unwinding
Volatility Fade: Sell options after IV spikes near key levels
Key Rule
Institutions trade structure, not direction.
Retail trades candles. Smart money trades the option chain.

Long Term Investment What is Bank Nifty (for long-term view)
Nifty Bank tracks India’s top banking stocks (HDFC Bank, ICICI Bank, SBI, Axis, etc.).
It’s:
🚀 High growth–oriented
📉 More volatile than Nifty 50
💰 Strongly linked to credit growth, interest rates, and the economy
Long-term verdict:
Great for growth if you can tolerate volatility.
Best ways to invest in Bank Nifty for the long term
1️⃣ Bank Nifty Index Mutual Funds (BEST for most people)
Passive funds that track Bank Nifty
Ideal for SIP + long horizon (7–10+ years)
Why this works
No stock picking risk
Lower expense ratio
Automatic rebalancing
👉 Suitable if you want set it and forget it

Option TradingRetail and Institutional Option Trading
Retail traders usually focus on buying options, hoping for fast price movement. Institutions, on the other hand, mostly sell options because time decay (Theta) works in their favor.
Key differences:
Retail traders chase momentum and news
Institutions focus on probability, statistics, and data
Retail uses indicators
Institutions use Option Chain, OI, volume, and volatility
Retail looks for big wins
Institutions look for consistent returns
Institutions understand that 90% of options expire worthless, which is why option writing dominates institutional strategies.

Technical Analysis Vs Institutional Trading Option Trading Part1Technical Analysis (TA):
Uses charts & indicators to time entries/exits.
Best for directional option trades (calls/puts), short-term moves.
Institutional Trading:
Focuses on liquidity, options flow, open interest, gamma.
Best for selling premium and trading ranges with lower risk.
Bottom line:
👉 TA = when to trade
👉 Institutional = where & why price moves
👉 Best edge = use both together
Professional Reality (Important)
📌 Institutions don’t predict direction — they manage risk
📌 Retail traders try to be right — institutions try to get paid
📌 Options are a probability business, not a prediction game

DMART 1 Week Time Frame 📊 Recent Price Range (Last Week)
Stock was trading around ₹3,780–₹3,900 in the recent trading sessions.
Weekly price change has been relatively modest, showing a small rise over the past week (~+1–2%) in some data and a slight variation in others due to different closing levels.
🛑 Weekly Support Levels
These are key zones where the price may find buying interest / downside support over a short 1‑week horizon:
1. ₹3,665–₹3,705 — Short-term pivot/support cluster (near prior recent lows).
2. ₹3,531–₹3,597 — Lower support range that may act if the stock breaks below near‑term levels.
3. ₹3,340 — Broader 52‑week low area (reference of major historical support).
📈 Weekly Resistance Levels
These are zones where the price may see selling pressure / upside barriers in the near term:
1. ₹3,841–₹3,881 — Near current pivot and first resistance for short‑term trading.
2. ₹3,929–₹3,950+ — Next upside resistance from classic pivot methods.
3 .Above ~₹4,000 — Psychological and technical interest level (also broker target levels in wider timeframe).
📌 Summary — 1‑Week Key Levels to Watch
Level Type Price Zone
Immediate Support ₹3,665 – ₹3,705
Deeper Support ₹3,531 – ₹3,597
Short‑Term Resistance ₹3,841 – ₹3,881
Higher Resistance ~₹3,929 – ₹3,950+

DMART - What can you possibly expect next......💹 Avenue Supermarts Ltd (DMart)
Context: Q3 FY26 Results vs Market Expectations
Chart View: Daily
Market Context: When Good Results Are Not Enough
DMart reported growth in both revenue and profit in its latest quarterly results. The company continues to add stores, customer demand remains steady, and the business model is stable. There was no major negative surprise in the results, and the long-term business story remains intact.
However, the stock market does not react only to whether results are good or bad. It reacts to whether results are better or worse than what the market was expecting. Before the results, many participants were expecting faster sales growth, better margin improvement, and clearer signs of stronger earnings momentum.
The reported numbers, although positive, did not go much beyond these expectations. Because of this, the stock price did not show a strong positive reaction. When a stock is already trading at higher valuations, the market looks for improvement, not just stability.
This difference between expectations and actual results explains the price behaviour. When expectations are high and results only meet them, prices often move sideways or see short-term selling. This does not mean the business is weak — it simply means the market is adjusting its expectations.
From a chart point of view, the stock is facing selling pressure near earlier price levels. Buying interest is limited for now, and price action suggests the stock is taking time to absorb the results rather than moving in a clear direction.
While DMart continues to report double-digit growth, the market is becoming cautious about the pace of that growth. Revenue growth in the latest quarter was lower than the company’s longer-term average and also slower than the rate at which new stores are being added. This suggests pressure on same-store sales. In addition, margins are facing challenges due to intense competition, price cuts in daily-use products, and changes in GST rates. These factors explain why the stock price has remained under pressure despite healthy headline numbers.
The key learning for beginners is simple: stocks do not always go up after good results. Sometimes prices move sideways to allow expectations to cool down. Patience and understanding the bigger picture are more important than reacting emotionally to quarterly numbers.
⚠️ Disclosure & Disclaimer
This post is shared only for educational and informational purposes. It is not investment advice or a recommendation. Stock market investments involve risk. Please consult a SEBI-registered financial advisor before making any investment or trading decisions.
🚀 Stay Calm. Stay Clean. Trade With Patience. Trade Smart | Learn Zones | Be Self-Reliant

Gold Key zones for Downtrend I think 🤔 gold is retreat from my entry key zones due to its correction I expecting one more push towards downside then we plan next setup let's see how it works like 📉📈

IndusInd Bank Ltd || 1 Day || Cup and handle IndusInd Bank Ltd — Detailed Analysis
Company Intro:
IndusInd Bank Ltd is one of India’s leading private sector banks offering retail, corporate, and digital banking services across the country. The bank has a strong footprint in consumer credit, deposits, and transaction banking, catering to millions of customers across urban and semi-urban regions.
Technical Perspective — Cup & Handle Breakout
The daily chart shows a classic Cup & Handle pattern, a bullish continuation setup formed over several months.Price has decisively broken above the key breakout level ~₹890, validating the pattern’s breakout.This breakout suggests a shift from consolidation to an upward trend re-acceleration.
Sustained trading above ₹890 keeps the structure bullish in the short to medium term.
📍 Resistance Levels (Upside):
• ₹930 — immediate minor resistance
• ₹1,030 — major resistance zone above
📍 Support Levels (Downside):
• ₹830 — key support if price retraces below ( Bearish)
• ₹710 — structural support
Trend Bias:
• Bullish above ₹890
• Neutral to Bearish below ₹830 / ₹710
Latest Update
Some macro/sector views indicate a softer Q3 earnings outlook relative to peers.
Source _Business Today
Broader corporate news includes regulatory probes related to past accounting discrepancies which the company is cooperating with.
Source _The Economic Times
👉 If you need analysis on any company or stock, comment below.
This analysis is for educational purposes only and should not be considered as investment advice. The author is not responsible for any losses arising from the use of this information. Investors are advised to consult a SEBI-registered investment advisor before taking any trading or investment decisions.

CONCOR – 1D | 10-Year Support & Trendline BreakoutCompany Intro:
Container Corporation of India Ltd (CONCOR) is a Navratna PSU and India’s largest integrated logistics company, operating inland container depots (ICDs), container freight stations (CFS), and rail-based logistics services. It plays a key role in India’s EXIM trade and domestic freight movement.
Technical View (Daily Chart):
CONCOR has broken out above a 10-year long-term support trendline, indicating a structural trend reversal, The stock has given a strong close near ₹525, confirming bullish intent and acceptance above the breakout zone.
Levels to Watch:
CMP: ₹523
Immediate Resistance / Target: ₹600
Breakout Confirmation Level: ₹525 (strong close above this keeps momentum positive)
Immediate Support: ₹480
Major Support: ₹446
As long as the stock holds above ₹480, the trend remains positive with a higher probability of moving towards ₹600 in the near term.
Positive Triggers
Government’s continued push for rail-led logistics, DFC (Dedicated Freight Corridor) and multimodal transport benefits CONCOR directly.
Volume recovery in EXIM and domestic logistics improves revenue visibility.
PSU logistics stocks are seeing renewed investor interest due to valuation comfort and long-term infrastructure growth.
For analysis of any stock, feel free to comment the stock name below.
This analysis is for educational and informational purposes only. It does not constitute investment advice or a recommendation to buy or sell any security. Market investments are subject to risk, and past performance does not guarantee future results. Please consult a SEBI-registered financial advisor before making any investment decisions. The author is not responsible for any losses arising from the use of this information.

LXEO FLAG & POLELXEO made a FLAG & POLE formation and breakout. We can expect flag target to $12.8 and pole target to $15.5. Entry price above $10.35 with a stoploss of $8.9
We can expext strong resistance at $11.5
Please make your own analysis before taking any trade.

Clean Trendline Respect on Weekly Chart – 500 DaysPattern Context
Price has been respecting a well-defined descending trendline on the weekly timeframe, with each rally stalling below the previous swing high and reinforcing the broader lower‑high, lower‑low sequence.
Candlestick Behavior
Showing how supply continues to respond at the same diagonal zone. This reaction visually confirms how aggressively the market has been defending the pattern’s upper boundary without implying what comes next, keeping the focus strictly on how price has behaved historically around this line.
Observational Takeaway
This chart serves as a clear example of how a simple, clean trendline can organize price behavior over multiple months and frame where participation repeatedly shifts. The emphasis here is on observing how consistently the structure has been respected and how each touch has shaped the ongoing sequence, allowing traders to study price interaction with a dominant trend rather than anticipate future outcomes.
Disclaimer
This post is for educational and informational purposes only and is not investment advice, stock tips, or a recommendation to buy or sell any security. Readers should do their own research, consider their personal risk tolerance, and consult a registered financial professional if needed before making any trading or investment decisions.
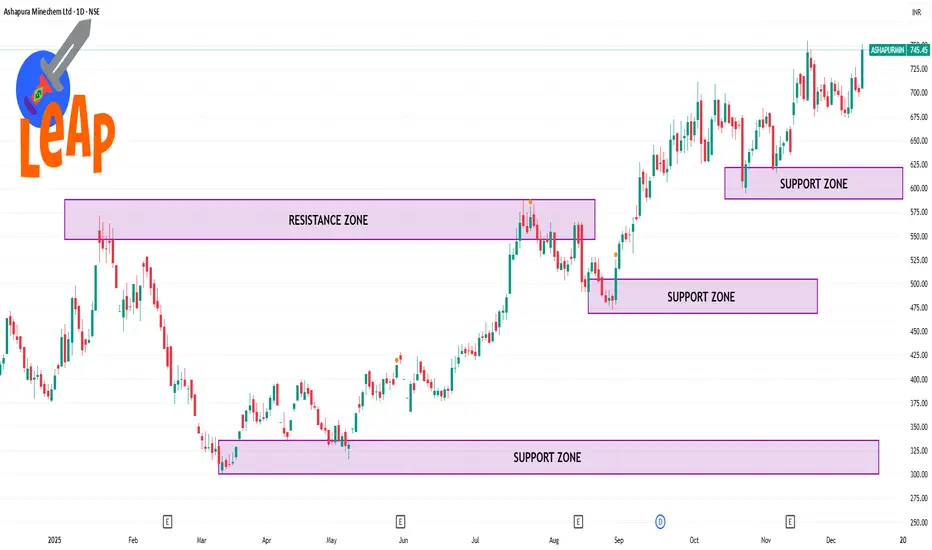
ASHAPURMIN 1 Day Time Frame 📌 Current Live Price (Daily)
Approx ₹745.4 on NSE at latest available update.
This reflects the recent trading session where the stock moved between ~₹705 (low) and ~₹751 (high) before settling near ₹745.45.
📊 Daily Technical Levels (Pivot / Support / Resistance)
🔹 Pivot Point Levels (based on yesterday’s range)
(These can be used for today’s intraday bias)
Daily Pivot: ~₹733.8
Support 1: ~ ₹716.6
Support 2: ~ ₹687.8
Support 3: ~ ₹670.6
Resistance 1: ~ ₹762.6
Resistance 2: ~ ₹779.8
Resistance 3: ~ ₹808.6
(Classic pivot method daily)
Fundamental Analysis Basics (P/E, P/B, ROE, ROCE)1. Price-to-Earnings Ratio (P/E Ratio)
What it Means
The P/E ratio tells you how much investors are willing to pay today for ₹1 of a company’s earnings. It connects a company’s market price with its profit generation ability.
Formula:
P/E = Current Market Price ÷ Earnings Per Share (EPS)
Why P/E Matters
A high P/E suggests that investors expect strong future growth.
A low P/E may indicate undervaluation, or that the company is facing growth challenges.
How to Interpret P/E
High P/E (>30): Market is optimistic, often seen in growth sectors like technology or consumer internet companies.
Moderate P/E (15–30): Indicates stable performance, common in quality midcaps and blue-chip stocks.
Low P/E (<15): Might indicate a value pick or a fundamentally weak company.
Limitations
P/E does not work well if profits are volatile or negative.
P/E differs widely across sectors—comparing a bank with a tech company is misleading.
Best Use Cases
Compare P/E with the stock’s historical average.
Compare P/E with the industry average.
Use Forward P/E (P/E using estimated future earnings) to understand growth visibility.
2. Price-to-Book Ratio (P/B Ratio)
What it Means
The P/B ratio compares the company’s market value with its book value (net assets). It tells how many times investors are paying relative to assets.
Formula:
P/B = Market Price per Share ÷ Book Value per Share
Book Value per Share = (Total Assets – Total Liabilities) ÷ Number of Shares
Why P/B Matters
Useful for asset-heavy sectors such as banks, NBFCs, manufacturing, and PSU companies.
Helps understand whether the stock trades above or below its actual net worth.
How to Interpret P/B
P/B < 1: Stock may be undervalued; the company trades below its net worth.
P/B between 1–3: Normal valuation for most companies.
P/B > 3: Indicates premium valuation; market expects strong future returns.
Limitations
Not useful for asset-light businesses like IT, FMCG, or digital companies where the real value lies in brand and intellectual property.
P/B alone does not measure profitability or efficiency.
Best Use Cases
Combine P/B with ROE to judge whether a company is generating strong returns on its net assets.
Valuable for evaluating banks and financial institutions.
3. Return on Equity (ROE)
What it Means
ROE shows how efficiently a company generates profits using shareholder equity. It reflects management’s ability to create value.
Formula:
ROE = Net Profit ÷ Shareholder’s Equity × 100
Why ROE Matters
High ROE indicates that the company uses shareholder money efficiently.
It reflects competitive advantage, pricing power, and strong demand.
How to Interpret ROE
ROE > 20%: Excellent – shows strong efficiency and high margins.
ROE 15–20%: Good – typical for stable companies.
ROE < 10%: Weak – indicates poor profitability or inefficient use of equity.
Limitations
ROE can be misleading if the company has very high debt; equity becomes smaller because debt funds the assets.
A temporary profit spike can artificially inflate ROE.
Best Use Cases
Compare ROE with the industry average.
Use ROE along with P/B to identify high-quality compounders.
Check 5–10 year ROE trends for consistency.
4. Return on Capital Employed (ROCE)
What it Means
ROCE measures profitability based on all capital employed, including equity and debt. It gives a more holistic view than ROE.
Formula:
ROCE = EBIT ÷ (Equity + Debt) × 100
Here, EBIT (Earnings Before Interest and Taxes) measures operating profit.
Why ROCE Matters
Shows how efficiently the company generates profits using both debt and equity.
Crucial for capital-heavy industries like manufacturing, steel, energy, or infrastructure.
How to Interpret ROCE
ROCE > 20%: Excellent capital allocation, highly efficient.
ROCE 15–20%: Good and sustainable.
ROCE < 12%: Weak returns relative to capital employed.
Limitations
ROCE may fluctuate due to capital expansion cycles.
Not very useful for debt-free companies where ROE already gives similar insight.
Best Use Cases
Compare ROCE with the company’s cost of capital (WACC).
High ROCE indicates strong pricing power and effective management.
How These Ratios Work Together
Using P/E, P/B, ROE, and ROCE in isolation is incomplete. Successful investors combine them for a full picture of valuation and performance.
1. P/E + ROE → Identifying Growth at Reasonable Price (GARP)
High ROE + reasonable P/E = High-quality stock at fair valuation.
Example: A company with ROE 20% and P/E 18 is usually attractive.
2. P/B + ROE → Banking and Financial Analysis
High ROE + moderate P/B = efficient bank with good asset quality.
A bank with ROE 17% and P/B 1.5 is stronger than a bank with ROE 10% and P/B 1.
3. ROCE + P/E → Capital-Intensive Business Screening
High ROCE suggests strong return on capital.
If P/E is low while ROCE is high, the stock may be undervalued.
4. ROE vs ROCE → Debt Analysis
ROE > ROCE: Company uses leverage (debt) to boost shareholder returns.
ROCE > ROE: Limited debt; equity is used more efficiently.
Practical Example (Simplified)
Suppose a company has the following metrics:
P/E = 20
P/B = 3
ROE = 22%
ROCE = 18%
Interpretation:
P/E 20 → Fair valuation.
P/B 3 → Market expects strong future performance.
ROE 22% → Very efficient with shareholder capital.
ROCE 18% → Strong use of total capital.
Conclusion:
This is a high-quality growth company trading at a fair-to-premium valuation.
How Investors Use These Ratios in Real World
1. For Long-Term Investors
Focus on businesses with consistently high ROE and ROCE.
Avoid companies with declining profitability, even if valuation looks low.
2. For Value Investors
Look for low P/E and low P/B stocks with improving ROE/ROCE.
These indicate potential turnarounds.
3. For Growth Investors
Accept high P/E if ROE and ROCE remain elevated for multiple years.
Growth sustainability is more important than cheap valuation.
4. For Traders
Use ratios to identify strong fundamentally-backed stocks for swing or positional trades.
Conclusion
P/E, P/B, ROE, and ROCE are essential tools of fundamental analysis. P/E and P/B help measure valuation, while ROE and ROCE measure profitability and efficiency. Together, they determine whether a stock is fundamentally sound, fairly priced, and capable of delivering long-term returns. When used consistently and compared with historical data, sector averages, and market conditions, these ratios give investors a powerful framework for making informed decisions.

USDJPY SELLS📉 USD/JPY – Bearish Trend With Clean Supply Rejection
As we can see, UJ is clearly in a bearish trend, confirmed by the red dots on the left chart, where price continues to create new lows.
Price recently retraced into a well-defined Supply zone around the 156.000 level. On the right chart, structure flipped after tapping the zone, giving a clean confirmation and creating a high-quality entry opportunity.
My first partials are placed at the 15-minute low, with the remaining targets marked by the red lines below.

Understanding the Fundamental MarketCore Principles of the Fundamental Market
Intrinsic Value Assessment:
The central idea in the fundamental market is that every asset has an intrinsic or “true” value. Investors compare this intrinsic value with the current market price to determine whether the asset is undervalued, fairly valued, or overvalued. Buying undervalued assets or selling overvalued ones forms the basis of long-term profit strategies.
Focus on Economic Fundamentals:
Fundamental markets heavily rely on macroeconomic and microeconomic indicators. For example, GDP growth, inflation rates, employment statistics, interest rates, and government fiscal policies are crucial in assessing the overall economic environment. At the micro level, company-specific data such as revenue, earnings, debt levels, cash flow, and competitive positioning are analyzed to determine the financial health and growth potential of individual firms.
Long-term Investment Horizon:
Unlike traders who operate in the short-term, the fundamental market favors long-term investments. Investors anticipate that while short-term price fluctuations may occur due to market sentiment or technical factors, in the long run, the market price of an asset will converge with its intrinsic value.
Key Components of Fundamental Market Analysis
Company Analysis (Equity Market):
In the stock market, fundamental analysis involves examining a company’s financial statements—balance sheet, income statement, and cash flow statement. Key metrics include:
Earnings per Share (EPS): Indicates profitability on a per-share basis.
Price-to-Earnings Ratio (P/E): Measures whether a stock is overvalued or undervalued relative to its earnings.
Debt-to-Equity Ratio: Assesses financial leverage and risk.
Return on Equity (ROE) and Return on Assets (ROA): Evaluate efficiency in using shareholders’ capital or assets to generate profits.
Beyond numbers, qualitative factors such as management quality, brand strength, market share, regulatory environment, and competitive advantages are also critical in assessing long-term growth potential.
Macroeconomic Analysis:
The broader economy directly influences asset prices. Factors such as:
Interest rates: Higher rates may reduce borrowing and consumer spending, negatively affecting company profits.
Inflation: Rising inflation can erode the real value of returns and affect purchasing power.
Fiscal and Monetary Policies: Government spending, tax policies, and central bank interventions can stimulate or constrain market growth.
Global Events: Geopolitical events, pandemics, and trade policies also play a significant role in determining market trends.
Industry Analysis:
Understanding the industry in which a company operates helps investors identify growth opportunities or potential risks. Factors to consider include:
Market size and growth potential
Competitive dynamics
Technological innovations
Regulatory constraints
Cyclical vs. non-cyclical industry characteristics
Valuation Models:
Investors use various models to estimate intrinsic value, including:
Discounted Cash Flow (DCF) Analysis: Projects future cash flows and discounts them to present value.
Dividend Discount Model (DDM): Focuses on the present value of expected dividends.
Comparable Company Analysis: Compares valuation multiples (like P/E, EV/EBITDA) with peers.
Asset-Based Valuation: Evaluates the net asset value of a company by subtracting liabilities from total assets.
Participants in the Fundamental Market
The fundamental market attracts a wide array of participants, including:
Long-term investors: Individual and institutional investors who seek wealth accumulation over years or decades.
Mutual funds and pension funds: These funds invest in fundamentally strong companies with sustainable growth.
Value investors: Investors who follow the philosophy of buying undervalued stocks with a margin of safety, popularized by Benjamin Graham and Warren Buffett.
Corporate analysts and research houses: Professionals who provide insights into company performance and macroeconomic trends.
Advantages of Operating in the Fundamental Market
Reduced Speculative Risk: By focusing on intrinsic value, investors can avoid the herd mentality and irrational exuberance often seen in speculative trading.
Long-Term Wealth Creation: Fundamental market investments are typically more stable and generate wealth over extended periods through price appreciation and dividends.
Informed Decision-Making: Thorough research and analysis ensure that investment decisions are grounded in reality rather than market sentiment.
Alignment with Economic Growth: Investments in fundamentally strong companies often mirror real economic growth, providing consistent returns.
Challenges of the Fundamental Market
Time-Consuming Analysis: Evaluating financial statements, industry dynamics, and macroeconomic trends requires significant effort and expertise.
Market Inefficiency: In the short term, market prices may deviate from intrinsic value due to speculation, news events, or investor sentiment.
Information Overload: Investors must filter vast amounts of data to focus on meaningful indicators.
Globalization and Complexity: International exposure introduces currency risks, geopolitical factors, and cross-border regulatory challenges.
Examples of Fundamental Market Strategies
Value Investing: Buying stocks that trade below their intrinsic value and holding until the market recognizes their true worth.
Growth Investing: Identifying companies with strong revenue and earnings growth potential even if current valuations are high.
Income Investing: Focusing on companies that provide regular dividend income alongside steady capital appreciation.
Sector Rotation: Moving investments across sectors based on macroeconomic cycles and industry trends.
Conclusion
The fundamental market is the backbone of rational, long-term investing. It emphasizes in-depth research, economic understanding, and valuation analysis to identify assets with sustainable growth potential. By concentrating on intrinsic value, participants in the fundamental market can mitigate short-term volatility and speculation, building wealth steadily over time. While it requires patience, diligence, and expertise, the fundamental market offers one of the most robust approaches to navigating the complexities of modern financial markets.
Ultimately, the fundamental market is not just about buying and selling assets—it’s about understanding the economy, businesses, and human behavior to make informed decisions that align with long-term financial goals.
Sensex INDEXSensex is in bearish trend
We can see strong RESISTANCE in between 84,800 & 85,000 range. If SENSEX breaksdown 84,800 level we can expect sensex at 84,600 and further down side till 83,100 level
Strong support regions are at 84,900, 84,500, and 83,950.
After reaching 84,600 we can expect retracement till 84,900 and if resistance was not taken then only it can move till 84,000 level
This is just my analysis to best of my knowledge

KAZIA THERAPEUTICS LTD SPONSORED ADRKZIA made double bottom with divergence with good volume and breakout at $4.45 with first target of $22.5, if and second target of $41.7 and with can expect strong resistance at $41.7 and reverse might happen. If KZIA did breakout at this level we can expect rally till $79.
Analysis is made on weekly time fame for long term view
It is just my chart analysis upto best of my knowledge. As it is share market anything happen because market effects on many things happen in the world.
Thank you

Consolidation happening in BBTC (Bombay burmah trading)1. is having consolidation pattern between 1750 - 2100 levels
2. One can watch for breakout above 2100 with good Risk : Reward
3. stock has give strong results attracting buyers and accumulation seen at 1850 levels
with strong buyer coming taking stock to 2050 levels in single day
4. stock may test its all time high if breaches 2400 levels

Gold direction today November 17📊 Support – Resistance – Fibonacci Analysis
1. Trend Overview
Price has broken below the ascending channel, signaling a shift into a corrective downtrend phase.
2. Key Resistance Zone
4,215 – 4,230
Confluence of Fibonacci retracement 0.5 – 0.618
Overlaps with a supply zone + EMA89
→ Strong resistance, high probability of selling pressure.
This is also the expected pullback/retest area before the next bearish leg.
3. Key Support Levels
Support 1 – 4,000
Fibonacci extension 0.5
Horizontal support
→ Likely to generate a short-term reaction.
Support 2 – 3,890
Major downside target if the structure fully breaks
→ Primary bearish target for a deeper continuation.
4. Price Scenario
Price may pull back toward 4,215 – 4,230.
BUY GOLD : 4000 - 3997
Stoploss : 3987
Take Profit : 100-300-500pips
SELL GOLD : 4212 - 4215
Stoploss : 4225
Take Profit : 100-300-500pips
