renderwithme || Ape Technical Analysis for 2025ApeCoin (APE) AnalysisApeCoin (APE) is an ERC-20 governance and utility token tied to the Bored Ape Yacht Club (BAYC) ecosystem by Yuga Labs, designed to empower decentralized community building in Web3. Below is a comprehensive analysis of ApeCoin, covering its current market performance, technical indicators, price predictions, and fundamental factors, based on available data.
Historical Price Trends: All-Time High: $27.79 on April 28, 2022, reflecting a -98% decline to current levels.
All-Time Low: $0.349 on April 7, 2025, with the current price up approximately 93.31% from this low.
Recent Performance: Over the past week, APE has risen by 9.17%-37.09%, and over the past month, it has increased by 0.45%-58.16%. However, it has declined by -15.88% to -44.50% over the past year, indicating significant volatility and a bearish long-term trend.
Trading Volume: The 24-hour trading volume is approximately $30.92M-$61.61M, with a 7-day average of $32.61M and a 30-day average of $25.38M. This suggests moderate trading activity, with recent spikes potentially tied to ecosystem developments.
Technical AnalysisCurrent Signals: Short-Term (Daily/4-Hour): Technical indicators show a "Strong Buy" signal on 4-hour and daily charts, suggesting short-term bullish momentum. This is supported by a recent breakout above a key resistance at $0.63 and a potential retest of higher levels like $0.74 or $1.00.
Weekly/Monthly: The weekly chart shows a neutral signal, while the monthly chart indicates a "Sell" trend, reflecting longer-term bearish pressure.
Chart Patterns:A falling wedge pattern has formed on the daily chart, which could signal a bullish reversal if buying pressure increases, potentially pushing APE toward $0.80-$2.00. However, failure to sustain momentum could lead to a drop to $0.22-$0.42.
The price has broken key resistance levels (e.g., $0.63) and trendlines, with some analysts noting a "flag" pattern breakout, indicating potential for further upside if the trend holds.
Key Indicators:Moving Averages: Most moving averages suggest a "Strong Sell" on longer timeframes, indicating bearish momentum over months.
Oscillators: Neutral, with no clear overbought or oversold conditions, suggesting indecision between buyers and sellers.
Fibonacci Levels: APE is currently trading between 0.236 and 0.382 Fibonacci retracement levels, with resistance around $0.60-$1.00.
Sentiment: The Fear & Greed Index for APE stands at 66 (Greed zone), indicating positive investor sentiment, which could signal a buying opportunity for some or a potential sell-off if greed peaks.
Price PredictionsShort-Term (2025):Bearish forecasts suggest APE could drop to $0.22-$0.42 due to consolidation or lack of buying pressure.
Bullish scenarios predict a range of $0.80-$2.00, especially if an altcoin season emerges or ecosystem developments drive demand.
Medium-Term (2026-2027):Bullish predictions estimate APE reaching $2.50-$3.84 in 2026 and potentially higher in 2027 if the crypto market sees broader growth.
Conservative estimates suggest a trading range of $0.41-$0.94, reflecting continued volatility.
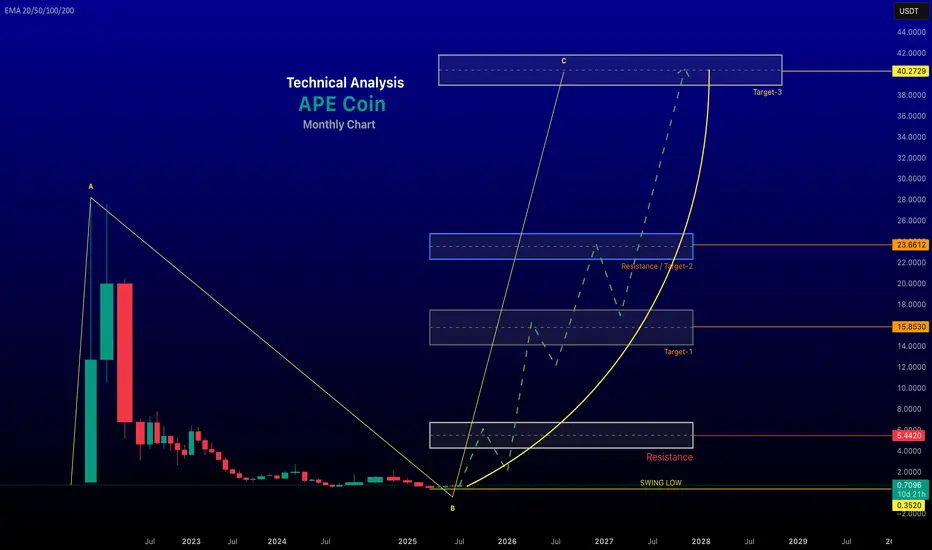
Long-Term (2030-2050):Optimistic forecasts project APE reaching $29.55-$40.15 by end of 2026, driven by potential growth in the Web3 and metaverse sectors.
Extremely bullish (but speculative) predictions for 2050 suggest prices as high as $1,050-$1,184, though these are highly uncertain due to the hype-driven nature of APE’s ecosystem.
More conservative outlooks predict modest growth to $0.73-$1.10 by 2030, contingent on sustained ecosystem adoption.
Fundamental AnalysisEcosystem and Use Case:Governance: APE is the governance token for the ApeCoin DAO, allowing holders to vote on fund allocation, partnerships, and ecosystem development. 62% of the token supply is allocated to the Ecosystem Fund to support community-driven initiatives.
Utility: APE serves as a currency for transactions within the ecosystem, providing access to exclusive games, merchandise, events, and services. It also incentivizes third-party developers to integrate APE into Web3 projects, such as Animoca Brands’ Benji Bananas.
ApeChain: The launch of Yuga Labs’ ApeChain Layer-3 platform in October 2024 briefly boosted APE’s price, but the token fell out of the top 100 cryptos by market cap in December 2024, reflecting waning momentum.
Community and Adoption:The BAYC ecosystem, backed by high-profile endorsements (e.g., Justin Bieber, Paris Hilton), remains a key driver of APE’s relevance. However, declining NFT popularity since 2021 has reduced hype, impacting APE’s value.
The ApeCoin DAO’s governance structure, including the APE Foundation and its Board, aims to foster decentralized decision-making but has faced criticism for inefficiencies and lack of community engagement.
Strengths:Strong brand association with BAYC, a leading NFT project.
Fixed supply of 1 billion tokens, preventing inflation.
Integration into Web3 projects like the Otherside metaverse and gaming ecosystems.
Weaknesses:Heavy reliance on NFT hype, which has significantly declined.
Volatility tied to market sentiment and ecosystem developments.
Criticism of the DAO’s treasury spending on “nonsense” projects, raising concerns about governance efficiency.
Opportunities:Growth in Web3 and metaverse adoption could drive demand for APE.
Partnerships with platforms like Animoca Brands and potential new use cases in DeFi or e-commerce.
Threats:Regulatory risks affecting cryptocurrencies and NFTs.
Competition from other governance and utility tokens.
Potential for further price declines if NFT market sentiment remains bearish.
Investment Advice: Always conduct thorough research and consult a financial advisor before investing, as cryptocurrencies carry significant risks.
Apecoin
#APE/USDT looking 200% Potential GETTEX:APE looks strong at this level, bouncing off support 🔥 Expecting a solid entry zone for 2x profit with minimal risk.
🔹 Accumulation Zone: $0.133 - $0.120
🔹 Target Prices (TP): $1.60 | $1.80 | $2.46 | $3.00
🔹 Stop Loss: Close below $0.160 (4H candle)
💡 Manage your risk accordingly.

APE BULLISH MARKET UPDATE #APE is flexing some muscle as it sits at a crucial support level with bullish divergence. This is a good sign for buyers, showing strength and potential for upward movement.
If buyers continue to rally, we could see a climb towards 1.30, 1.50 and possibly 1.80.

Ape coin reversal patternApe coin is reversing really nice breakout from trendline and W pattern .
Its a good fundamental coin as bull run approaching this coin can give good returns in next few month’s

APEUSDT Bullish on Long TermAPEUSDT 4th Wave is completed now 5th wave will start. Hold it tight for this roller coaster ride.

APEUSDT looking short at a good priceHello Friends,
APEUSDT is looking sort at current levels from Short to medium term. Currently as per wave analysis 3rd wave has just ended and abc should start very soon. I have personally taken short positions. Lets see.

APE/USD - Weekly Overview Looking at the Apecoin technical chart, the price level has faced significant selling pressure since August and is almost down by 43.00% since then. Considering the current trend, APE is struggling between 0.236 FIB level to 0.382 FIB level. Above 0.382 FIB level, there’s a strong resistance zone in which the price level is unable to maintain sustainability. MA-50 has also faced a negative crossover against MA-20 which can be an indication of an upcoming bearish trend
The MACD level also in the potential to have a bearish crossover while the RSI level is looking vulnerable to a breakdown below 50. Overall, the technical chart reflects a bearish formulation for Apecoin and a word for caution for the upcoming days.
Resistance: $5.50 and $6.50
Support: $4.00 and $3.50
