APOLLO: Structural Reversal from Key Support Zone🚀 Long Setup: NSE:APOLLO Micro Systems (APOLLO)
Trade Parameters
Entry Zone: ₹245.00 – ₹255.00 (Current breakout level)
Stop Loss (SL): ₹214.00 (Weekly close basis / below structural support)
Target 1: ₹300.00 (Psychological & Analyst Consensus)
Target 2: ₹355.00 (All-Time High retest)
Risk/Reward Ratio: ~1:2.8
Technical Analysis
Support Rebound: The stock has successfully defended the ₹210–₹220 horizontal support zone, which acted as a major resistance-turned-support from mid-2025.
Momentum Shift: Today's 5% Upper Circuit hit at ₹249.80, accompanied by a spike in volume, signals the end of a 3-month correction/accumulation phase.
Trend Confirmation: The price has reclaimed the 20-week EMA, shifting the medium-term bias back to bullish.
RSI Recovery: RSI is turning up from the 40-level floor, suggesting the "oversold" energy is being replaced by fresh buying interest.
Fundamental Driver
The technical move is backed by the company's Q2 FY26 performance (highest-ever quarterly income of ₹226 Cr) and a massive ₹1,500 Cr order book. The recent licensing for high-energy explosives provides the long-term thematic tailwind for the Aerospace & Defense sector.
Apollo

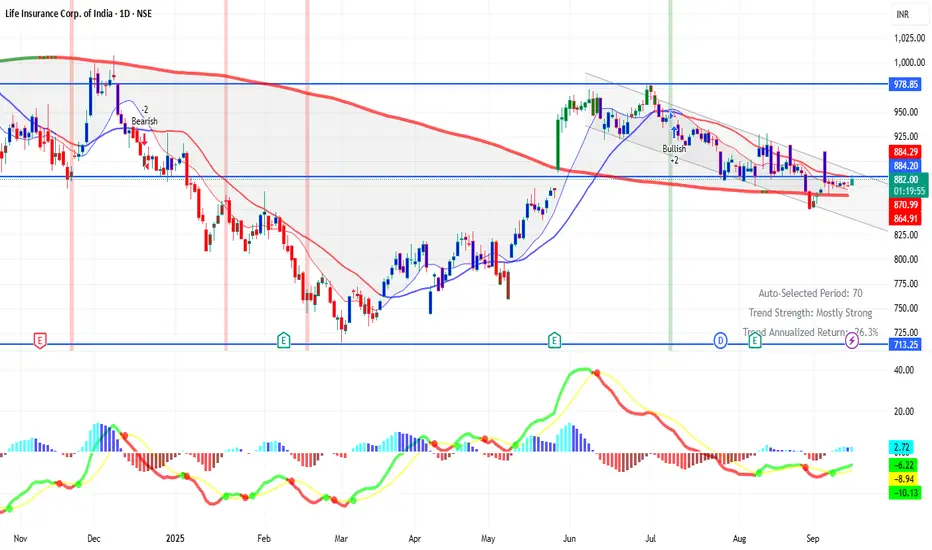
LICI 1D Time framePrice Action
Current Price: ₹882.50 (approx)
52-Week Range: ₹715.30 – ₹1,048.90
P/E Ratio: ~11.4
Book Value per Share: ~₹200+
🔹 Support & Resistance
Strong Support: ₹800 – ₹830
Immediate Resistance: ₹860 – ₹900
Next Resistance (medium-term): ₹1,000+
BUY TODAY SELL TOMORROW for 5%DON’T HAVE TIME TO MANAGE YOUR TRADES?
- Take BTST trades at 3:25 pm every day
- Try to exit by taking 4-7% profit of each trade
- SL can also be maintained as closing below the low of the breakout candle
Now, why do I prefer BTST over swing trades? The primary reason is that I have observed that 90% of the stocks give most of the movement in just 1-2 days and the rest of the time they either consolidate or fall
Round Bottom Breakout in APOLLO
BUY TODAY SELL TOMORROW for 5%

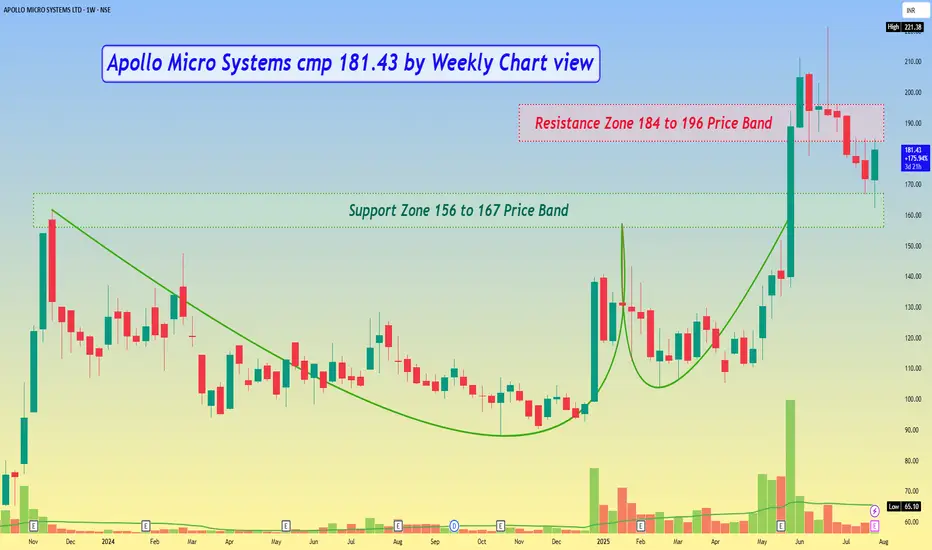
Apollo Micro Systems cmp 181.43 by Weekly Chart viewApollo Micro Systems cmp 181.43 by Weekly Chart view
- Support Zone 156 to 167 Price Band
- Resistance Zone 184 to 196 Price Band
- Support been tested retested since last week
- Volumes gradually closing in with avg traded quantity
- Price staging above EMA 20, 50, 200 with positive MACD, RSI, SAR
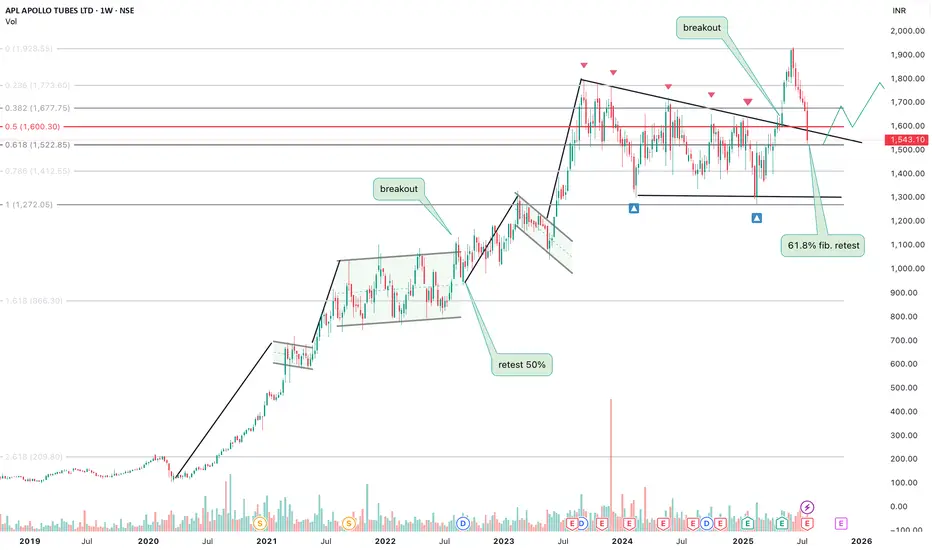
apollo tubes longThe chart has repeated its pattern of consolidation followed by breakout and retest .
we can expect a good upside momentum as it has completed its 0.618% retracement based on earlier chart formations.
the financials and companies growth looks great with increasing revenues and profits.
let me know what you investors feel in the comment.
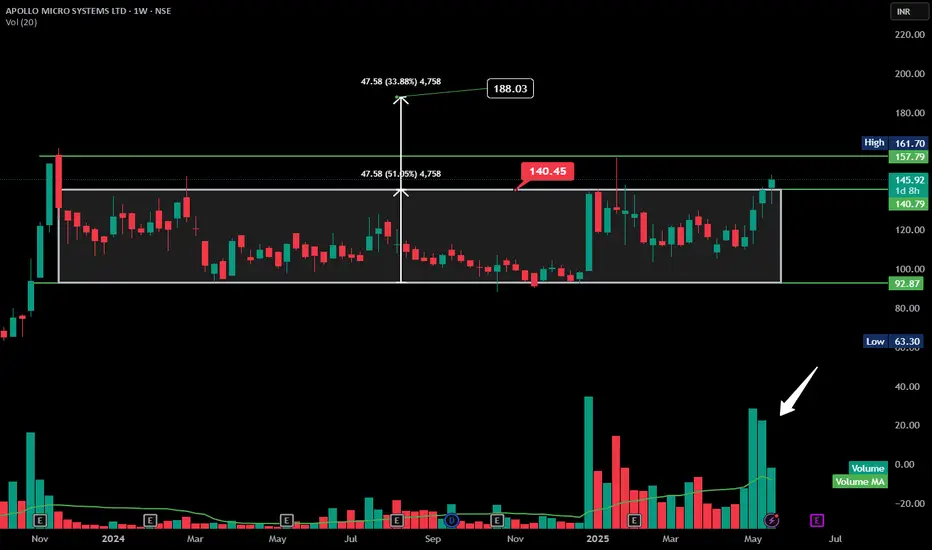
APOLLO rectangular consolidation Breakout - Good volumeHere’s a **technical analysis summary for APOLLO MICRO SYSTEMS LTD** based on the chart you provided:
---
### 📊 **APOLLO MICRO SYSTEMS LTD – Weekly Chart Summary**
* **Trend:** ✅ **Breakout Confirmed**
* Price has broken out above the rectangular consolidation zone after nearly a year of sideways movement.
* **Breakout Zone:**
* Resistance broken: **₹140.45**
* Consolidation range: ₹92.87 to ₹140.45
* **Target Projection (based on rectangle height):**
* Rectangle height = ₹47.58
* Projected Target = ₹140.45 + ₹47.58 = **₹188.03**
* **Current Price:** ₹145.92 (as of last weekly candle)
* **Volume Analysis:** 🔼
* Recent volume spikes confirm breakout strength.
* Volume > average, indicating institutional interest.
* **Support Levels:** * Lower: ₹92.87 (bottom of range)
---
### 📌 **Technical View:**
**Bullish outlook.** The breakout from a long accumulation phase with strong volume is a classic bullish signal. Price may face resistance around ₹157.79 and ₹161.70, but overall sentiment favors upside towards ₹188.
---
Apollo Micro Systems cmp 102.25 by Daily Chart viewApollo Micro Systems cmp 102.25 by Daily Chart view [ /b]
- Stock Price sustaining its upwards momentum post test retest of Support Zone Price Band
- Keep the stock on your watchlist for it's slow, steady and stable walk upside along Rising Support Trendline

Apollo Tyres - BullishBreak of strong resistance is done
Now at pullback
Old resistance can now become support
Looks good near 512 - 515
Close below 508 will negate the view
Keep in radar ...

APOLLO HOSPITAL - Inverted Head and ShoulderApollo Hospitals Enterprise Ltd, First Quarter Result FY25
➡️Recorded highest-ever revenue, up 15% YoY.
➡️PAT jumped 83% YoY led by the growth in topline.
Revenue 🔼 15% at ₹5,086 crore
EBITDA 🔼 33% at ₹675 crore
Net Profit 🔼 83% at ₹305 crore

Apollo - Flag breakout - Defence - ElectronicsApollo micro system is making flag breakout. Defence as a sector is extremely overvalued. Even apollo is trading at high valuations.

Take a look | min 20% return | swingFundamentally good stock,
For long term investment.
.
.
Entry: 535
target: 555 -585- 651
sl: 506
major stoploss / support: 485
.
Enter only after breaking & close above " Yellow box" mentioned.
Or else wait for some time.
'
;good for long term investment.
'
'
Don't make complicated trade set-up.📈📉
Keep it " simple, focus on consistency💹
Refer our old ideas for accuracy rate🧑💻
Valuable comments are welcomed-✌️
.
refer old ideas attached below

Bolo Apollo Micro ki Jai ! Apollo Micro Systems, a 40-year-old Hyderabad-based company led by B. Karunakar Reddy, has grown into a major player in India's defence and space sector. This publicly traded firm, with 350 employees including 150 engineers, prioritizes R&D and homegrown technologies, serving Defence and Space departments. To capitalize on the rising demand for indigenous defence solutions, they focus on air, land, and sea defence electronics, with a focus on surveillance tech. Their commitment is further emphasized by a 5-acre expansion in Telangana, featuring a 3,50,000 sq. ft. facility for missile and subsystem manufacturing, weapon maintenance, and UAS/UGS production.
This Rs 210 Crore investment, adhering to international standards, is expected to generate 400 jobs. The recent inauguration by Telangana's Minister highlights their contribution and reinforces the state's position as an aerospace and defence hub. With continued government support, Apollo Micro Systems is poised for a bright future in driving defence innovation in India.
According to Quarterly Results, the net sales increased by 10.9 per cent to Rs 91.34 crore, profit before tax (PBT) increased by 57.3 per cent to Rs 14.37 crore and profit after tax (PAT) increased by 50.9 per cent to Rs 9.96 crore in Q3FY24 compared to Q3FY23 while in its nine-month results, the net sales increased by 23.87 per cent to Rs 235.20 crore, profit before tax (PBT) increased by 47.1 per cent to Rs 25.93 crore and profit after tax (PAT) increased by 57.7 per cent to Rs 18.18 crore in 9MFY24 compared to 9MFY23.

APLAPOLLO : Long setup with huge upside Exciting Bullish Pattern Alert! 🐂
📊 Pattern: Broadening Pattern
📌 Symbol/Asset: APLAPOLLO
🔍 Description: Stock is in a pattern and now near to the support level.
View is bullish if support is intact.
👉 Disclosure: We are not SEBI registered analysts, this is not a buy or sell recommendation.

Apollo Hospital BULLISHHaving a bullish view in APOLLO HOSPITALS as per weekly charts.
Refer the video for details.

Apollo micro system best for medium termour stock ideas basicaly for short term medium term and long term..
our ideas for educational purpose only....

APOLLO HOSPITALS go shortAPOLLO HOSPITALS is going to touch its up trendline so till that you can go short. make your own target.
FOLLOW ME for more❤️😊

Long Setup TRADE Idea in APOLLO MICROEverything Mentioned on Chart . If you have Any question please comment down Below.
Disclaimer:- This view only for education purpose only. do your own research before get into any trade.

Apollo Hospitals possible Elliot wave countsHello Friends,
Here we had shared possible Elliott wave counts of Apollo Hospitals, in which price has given breakout along with good intensity of volumes in daily time frame, as per Elliott wave structure, chart says that either we are in impulse or in correction, in both scenarios we have to go towards north direction first then whatever may be, as per Elliott wave structure, if we are in impulse then we should have to unfold it as wave (1)-(2)-(3)-(4)-(5) in which we already had completed wave (1) and (2) and currently we are unfolding wave (3), and in other scenario, means if we are in correction phase, then we should have to unfold it as wave (A)-(B)-(C) in which we had completed wave (A) and (B), and currently we are unfolding wave (C), So whatever scenario it may be, at least we are first going towards (3) or (C).
In this study whatever major trend may be ahead, at least we can enjoy this little upward bull run as a wave (C) or wave (3)
Now in wave (C) or (3) we have completed wave 1 and 2 and currently we are unfolding wave 3, also in wave 3 we have completed wave (i) and (ii) and currently we are unfolding wave (iii).
Overall, we are in (iii) of 3 of (C) or (3).
I am not sebi registered analyst. My studies are for educational purpose only. Please Consult your financial advisor before trading or investing. I am not responsible for any kinds of your profits and your losses.
Some significant snapshots are shared below, please go throughout.
Thanks
RK💕
Price has given Breakout along with good intensity of volume and RK's Magical cloud suggests same bullish bias in daily
Price above daily upper band
Price above weekly upper band
MACD in daily positive
MACD in weekly positive along with breakout in histogram
RSI positive above 60+ in daily
DMI ADX positive in daily
DMI ADX positive in weekly
Most investors treat trading as a hobby because they have a full-time job doing something else.
However, If you treat trading like a business, it will pay you like a business.
If you treat like a hobby, hobbies don't pay, they cost you...!
Disclaimer and Risk Warning.
The analysis and discussion provided on in.tradingview.com is intended for educational purposes only and should not be relied upon for trading decisions. RK_Charts is not an investment adviser and the information provided here should not be taken as professional investment advice. Before buying or selling any investments, securities, or precious metals, it is recommended that you conduct your own due diligence. RK_Charts does not share in your profits and will not take responsibility for any losses you may incur. So Please Consult your financial advisor before trading or investing.

Apollo Hospital looks good investment betAfter breaking out from multiple resistance level with a good consolidation , Apollo looks good to test the highs once again .
Good for investment for few weeks.
Follow @piyushrawtani for more
Cheers!

APL APOLLO TUBESAPL APOLLO TUBES is creating Fallin wedge pattern in Day TF. So there must be chances for a great rally, so the Target will be 1289 & 1330. 🎯
Note : This is just for Backtesting and Educational Purpose Only.

LONG on ApolloThe reversal candle at the bottom has picked up more volume today & making a push for the top trying to get back into the trendline.

Apollo Hospital is going to be on FIRECash Segment
-> Good Buying in Cash Segment is there.
-> Doji is Formed on Weekly Chart and Triangle Pattern is Formed
-> On friday there is some Delivery Based Selling
F&O
-> In Option Chain, 4400 is Very strong Resistance, and Strong support is 4300 and 4000. If Option Chain Changes then Good Upmove is Possible.
-> Future OI is not getting built up, it is possible that Short Positions are getting converted into Long

APOLLO MICRO SYSTEMNSE:APOLLO
ROUNDING BOTTOM PERTEN
Apolllo micro system has Attempt second time break the rounding bottom formation
> 1st time stock has attempt dec 2021 @level 154/- but unfortunate fizzle out with making a just high 190.90
today stock has break the resistance of 190.90 on daily chart / expect the stock has close above 190.90
as per daily chart 1st target 245.60 with sl 178.50 closing basis
second target 273.20 (if weekly close above 190.90) then 273.20 is first target of weekly breakout with sl 168 closing basis)
if monthly candle close above 190.90 then final target stock new life high with sl 150/- closing basis
day target holding 14 days
weekly target holing 76 days
monthly target may be complete in 250 days
"Disclaimer : Education purpose only Before take any position consult with your financial adviser"
