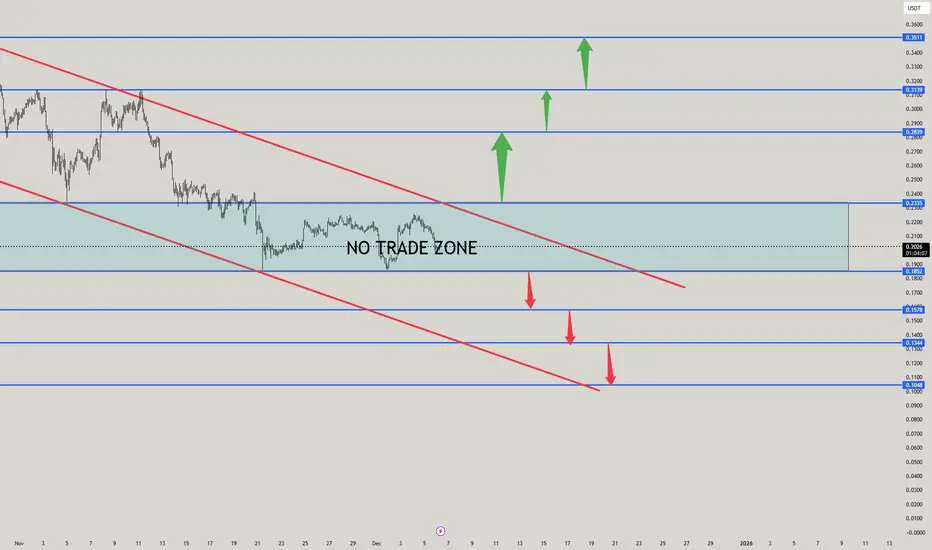
Analyse ARB/USDT✅ 1. NO-TRADE ZONE (Do Not Trade Inside)
The blue shaded region between ~0.2335 and ~0.2020 is clearly a consolidation box.
📌 Why NO TRADE here?
Price is moving sideways → no clear trend
Inside a mid-range of a falling channel → low R:R
Whipsaws → both long/short entries get trapped
Best to wait for a breakout or breakdown
🚫 Stay out until price leaves this zone with a candle close.
🟢 2. BUY SIDE ANALYSIS (Bullish Setup)
You BUY only after price breaks above the upper box (0.2335).
Buy
Arbusdtanalysis
ARBUSDT: Will This Key Support Hold or Trigger a Reversal?Yello, Paradisers! ARBUSDT has formed a descending triangle pattern accompanied by bullish divergence, and the current price rests within a key support zone, heightening the potential for an upward move.
💎If ARBUSDT shows an I-CHoCH (internal change of character) or develops bullish formations like a W-pattern or inverse head and shoulders from here, the likelihood of an upward move increases significantly.
💎A more secure signal would be a breakout with a candle close above the resistance zon
ARBUSDT: Could This Be the Next Big Breakout? Yello, Paradisers! Are you ready to catch the next big move in ARBUSDT? Let's break it down!
💎ARBUSDT has formed a falling wedge pattern and has taken liquidity, which increases the probability of a bullish move. However, there are key confirmations we need to watch for:
💎For a bullish trend confirmation, we need a breakout from both the falling wedge and the resistance zone. This will significantly increase the likelihood of a sustained upward move.
💎We can expect a bullish move from the cur