SMS Pharma Ascending channel patternNSE:SMSPHARMA
- Two ascending channel patterns (one long period & one short period).
- Breached long period channel and retested the top channel.
- Still traveling inside short period channel.
- SMS pharma is a good bet but wait for the good entry.
Note: Personally waiting for some dip. It never had a major fall after the recovery from April 2020.
Ascending Channel

BAJAJFINSV BEARISH Expecting downside
!.Falling wedge
2.Ascendingchannel inside falling wedge
Disclaimer: Please consult your financial advisor,
Investment/Trading in the securities market is subject to market risk, We are not responsible for your profit or loss

Hindalco Bearish ascending channelThe stock has formed a ascending channel and breakdown from the channel expecting down side and also formation of head and shoulder pattern
Disclaimer: Please consult your financial advisor,
Investment/Trading in the securities market is subject to market risk, We are not responsible for your profit or loss

Sonata Software Fresh BreakoutNSE:SONATSOFTW breakout from flat channel.
- Retesting the support line
- Good stock for short term trade.
- Keep an eye on it.

Biocon - Self Study ChartNSE:BIOCON Self study chart.
It's in consolidation phase after falling from ascending trend channel.

Mentorship InstaView 25 June’21: Consolidates before a New High
Nifty View: A fresh positive start to July contracts as the Nifty futures inch further up with an 89 points gain on Friday’s session. On a week on week basis the index gained 191 points - a complete recovery from the recent high volatile sell-off. The index is now back to a UP trend across all time frames and good to notice participation coming in from heavyweight banking stocks like SBIN and ICICIBANK. A look at the 125min chart of Nifty suggests a short term consolidation that has taken the shape of an Ascending Triangle. Considering the underlying trend and momentum we should be heading for a new life high early next week and a breakout above this triangular pattern. Short term supports to keep in mind is at 15,700. Stay bullish.
Thank you for following my work and please feel free to share your thoughts and suggestions.
Trade Well. Trade Wise.

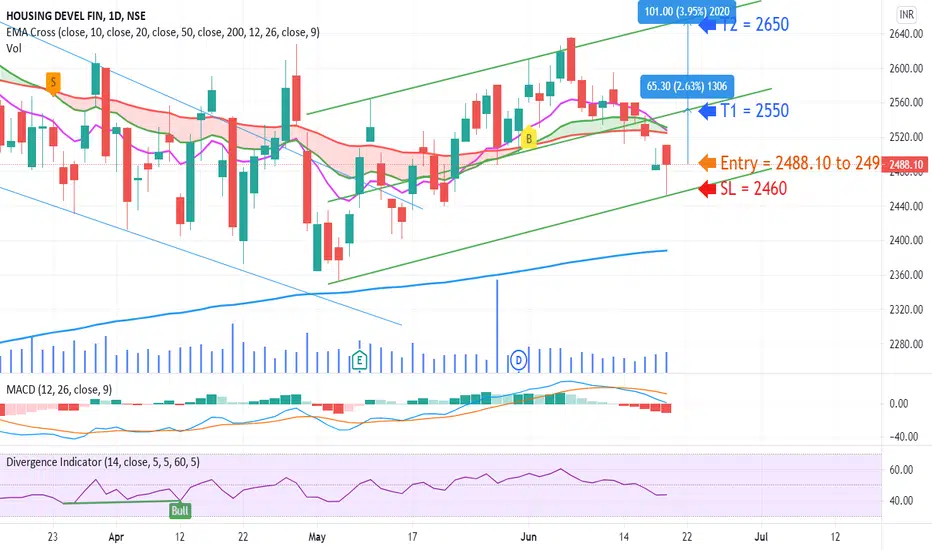
Buy HDFC Within 2490 to 2495 for Weekly Target of 2550Dear Vie wer,
This is a simple price-based analysis that includes the following key points:
1. Ascending channel is observed
2. Significant support has been taken on 19th June 2021
3. Buy in the range of 2488.10 to 2495
4. Strict Stop Loss = 2460
5. Target 1 = 2550 and Target 2 = 2650
Duration 1 to 2 weeks
Disclaimer :
This is just my personal analysis and should not be considered a buy or sell suggestion or advice. Trade as per your risk appetite and follow your financial advisor before taking any decision
If you like the analysis please hit the like button so that
DON'T MISS THIS CHANNEL BREAKOUT+RETEST !CESC : It has formed channel pattern ( slightly ascending) for 400+ days and it gave breakout on 07 june 2021. The stock is now retesting its resistance line, if the retest is successful it can give a strong up move at least equal to the breadth of the channel . Feel free to share your views/feedback, also let me know in the comments if you liked my analysis on this stock.

FOCUS ITC Ltd triangular pattern :)PROS: 1. stock forms a good good triangular pattern and now it is in near support
2. if it breakout then it will move further up and vice versa.
2.on 18th friday the last candle was a little hammer.
4. BUY SELL TARGET is at your own trading style.
CONS: 1.Stock breaks 50 EMA and also 200 EMA.
2.the last candle was hammer but its not a perfect one its a red bearish hammer.
3. if stock breaks support it will go down more maybe.
for more updates FOLLOW ME :)

SUN PHARMA TRIANGLE PATTERN :)Date: 20/06/2021.
PROS: 1. stock has a very good triangular pattern ,if it's breakout it will move further.
2. on 18th friday it forms a good bullish hammers represents buyers are in control.
3.the hammer forms at near 50 EMA and at support.
4. BUY SELL TARGET is your own trading style
CONS: 1.if its breakdown then it will move down more .
2. wait for the confirmation candle
for more updates FOLLOW ME :)

BO in IBULHSGFIN.There is an Ascending Triangle Pattern Breakout given by IBULHSGFIN on this Friday on weekly chart. So, I think we can see more upside levels on this counter.
First Targets :- 310
Second Target :- 360
Third Target :- 425
Stop loss as per risk appetite. Support is around 220.00

Gulshan Polyols- SILENT MULTIBAGGER multi-year multiple BOsNSE:GULPOLY
Breakout of Ascending Parallel Channel at 128
Multi-Year Rounding Bottom BO on Weekly Chart at 110
Buy: 165-130
Target: 198-253-287-342
SL: 110
Golden Cross Over on weekly charts
Highest Volume Ever
Weekly & Monthly RSI > 65

Sreeleathers Ltd - double bottom !!!Sreeleathers Ltd
buy only if it get 190-205 range
strict sl 170
otherwise plz avoid🙏
Seems positive in a way🍂

NIFTY 50 EXPECTING RANGE BOUND MARKETBe caution expecting a huge sell-off on 21/22 june Trend reversal day
But this week we can expect a range-bound market, market can be volatile but closing will be 15620-15950
We can expect to sell at the range of 15910-15950
Buy level of 15619
Disclaimer: Please consult your financial advisor,
Investment/Trading in the securities market is subject to market risk, We are not responsible for your profit or loss


MARICO - Candles at Channel SupportWe can see on the chart that candles are taking support at the support level of the up trending channel. The moving average set has also given a bullish crossover. Good opportunity to go long.

SRTRANSFIN - Channel patternSrtransfin is moving beautifully in this channel pattern. can be traded inside this pattern for the long side if forms a bullish candle at the current level or Short trade if breaks the TL support.

#GATI with Volume, Upper channel line#gati BO with Volume, breaks above the upper channel line of an ascending channel on Daily chart.
Note: not SEBI registered, views are personal.

NTPC bullish channel Possible breakout
Bullish channel
sectorial analysis
Disclaimer: Please consult your financial advisor,
Investment/Trading in the securities market is subject to market risk, We are not responsible for your profit or loss

Minda Corporation👉You can clearly see that the channel is broken and the bullish channel has been already set up by the bulls.
👉Keep an eye on this stock, and find the right position for long term(min 1 month).
👉According to my analysis, We can see the price striking at 160 or more in coming weeks or months.
👆Follow for more alerts👆
Happy Trading 😊💪
Note:Patience is a key to success.
Disclaimer: This is my personal analysis for educational purpose. I am not sebi registered. Do your analysis before taking a position. I am not responsible of any profit or loss.

GBP NZD BREAKOUT TO BUYWell looking for the breakout the buying candle , to enter the trade,GOOD LUCK
.
.
.
TAKE A TRADE ,SIT BACK AND RELAX
LIKE AND SHARE


Munjal Showa will Blast !NSE:MUNJALSHOW is ripe and ready to blast off in a very short term basis.
Minimum Target Rs300.
Very Bullish momentum to be seen in few weeks starting this one.
