UGRO Capital Ltd – Acending Triangle with Fundamental TailwindsTimeframe: Daily (1D)
Pattern: Ascending Triangle (Developing) – bullish continuation setup not yet confirmed.
Price Action Insight:
UGRO is forming an ascending triangle — a consolidation where higher lows push against a near‑horizontal resistance zone. A decisive breakout above the ₹189‑195 range on strong volume will signal trend continuation. Conversely, a break Trend line Breakout below key supports at ₹165 & ₹148 could trigger deeper correction.
Key Technical Levels:
Resistance Zones: ₹189–195 (primary) | ₹209 | ₹242
Support Zones: ₹165 | ₹148 | Major Base: ₹129
Recent News & Strategic Highlights
• Profectus Capital Acquisition: UGRO’s all‑cash ₹1,400 crore acquisition is expected to strengthen its lending franchise and portfolio diversity.
• Rights & Capital Raise: Up to ₹1,315 crore raised via convertible debentures and rights to support growth and reduce cost of funds. ET
• Leadership Positioning: Promotion of Anuj Pandey to CEO signals strategic continuity and risk‑focused leadership. ET
• Social Impact in MSME Lending: ~78% borrowers are first‑generation entrepreneurs gaining access to formal credit. ET
For analysis of any stock, feel free to comment the stock name below.
This analysis is for educational and informational purposes only. It does not constitute investment advice or a recommendation to buy or sell any security. Market investments are subject to risk, and past performance does not guarantee future results. Please consult a SEBI-registered financial advisor before making any investment decisions. The author is not responsible for any losses arising from the use of this information.
Ascending Triangle

IGL: DOWNTREND RESUMINGIGL 194 is looking to test 170 to 150 levels. Stock is in downtrend and now ascending triangle breakdown happening. Multiple support at 150 zone which can be testing.
View invalid above 205 levels reclaimed again.

JSW ENERGY : TRINAGULAR BREAKDOWNJSW ENERGY (W) 481. Stock moving towards 450 to 380 levels.
Ascending triangle breakdown in downtrend happening. Bigger timeframe and multiple resistance on higher zone. View invalid if sustain above 505 on weekly basis.

Silver Triangle BreakoutSilver is attempting breakout forming a ascending triangle pattern on 1h and 4h timeframe. It is also trading above 200ema.

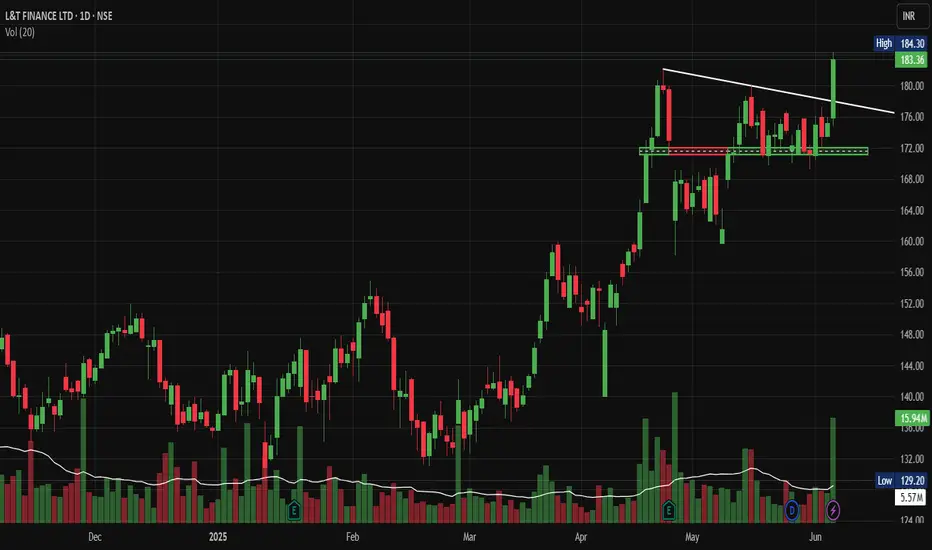
LTF Breaking Out of Consolidation and ascending triangleNSE:LTF : Breaking Out of Consolidation and ascending triangle with heavy volumes today - Is This the Next Big NBFC Move?
Price Action Analysis:
• Base Formation: Clear sideways movement between ₹160-172 levels
• Breakout Confirmation: Recent breach above ₹172 resistance with volume expansion
• Trendline Break: White descending trendline from December highs decisively broken
• Market Structure: Shift from the consolidation phase to the potential trend resumption
• Time Frame: A six-month base provides a strong foundation for sustained movement
Volume Analysis:
• Current Volume: 5.57M against 20-day average of 15.94M
• Volume Pattern: Accumulation visible during the base formation period
• Support Tests: Volume spikes coinciding with successful ₹160-164 support tests
• Breakout Volume: Adequate but not exceptional - requires monitoring for follow-through
• Distribution Signs: No significant selling pressure visible during consolidation
Key Support & Resistance Levels:
Support Levels:
• Immediate Support: ₹172 (new floor post-breakout)
• Secondary Support: ₹168 (previous resistance turned support)
• Major Support: ₹160-164 (primary consolidation base)
• Critical Support: ₹155 (breakdown level)
Resistance Levels:
• Immediate Resistance: ₹190-195 (measured move target)
• Next Resistance: ₹205-210 (psychological and technical zone)
• Long-term Target: ₹220-225 (extension target)
Trade Setup:
Entry Strategy:
• Aggressive Entry: Current levels ₹183-184 for momentum traders
• Conservative Entry: ₹175-177 on pullback to breakout zone
• DCA Approach: Scale in between ₹175-185 levels
Exit Strategy:
• Target 1: ₹192 (measured move from rectangle pattern)
• Target 2: ₹205-210 (next significant resistance)
• Target 3: ₹220+ (extension target for long-term holders)
Stop Loss:
• Closing Basis: Below ₹170
• Intraday Basis: Below ₹168
• Risk Percentage: 7-8% from current levels
Position Sizing & Risk Management:
Position Sizing:
• Conservative: 1% portfolio risk
• Moderate: 1.5% portfolio risk
• Aggressive: 2% portfolio risk (maximum recommended)
Risk Management:
• Stop Loss Discipline: Strict adherence to ₹170 closing stop
• Position Scaling: Reduce position if breaks ₹175 intraday
• Profit Booking: Book 30% at ₹192, 40% at ₹205
• Trailing Stop: Implement above ₹195 levels
Sectoral Backdrop:
NBFC Sector Positives:
• Credit Growth: NBFC credit growth outpacing bank credit
• Market Share: Gaining share in retail and SME segments
• Asset Quality: Improving collection efficiency post-COVID
• Regulatory Support: Favourable policy environment
Sector Trends:
• Digital Lending: Increased adoption of technology platforms
• Rural Focus: Growing emphasis on semi-urban and rural markets
• Partnership Models: Collaborations with fintech companies
Fundamental Backdrop:
Company Strengths:
• Group Support: Strong L&T Group parentage and backing
• Diversified Portfolio: Exposure across infrastructure and retail segments
• Quality Borrowers: Access to L&T Group ecosystem clients
• Management Quality: Experienced leadership team
Recent Developments:
• Asset Quality: Improving NPA ratios
• Profitability: Better margins and ROE metrics
• Growth Strategy: Focus on profitable growth segments
Risk Factors:
Technical Risks:
• False Breakout: Possibility of returning to the consolidation range
• Volume Confirmation: Need for sustained volume support
• Market Correlation: High beta to financial sector performance
Fundamental Risks:
• Interest Rate Risk: Rising rates impacting lending margins
• Credit Quality: Potential stress in the retail lending portfolio
• Economic Slowdown: Impact on borrower repayment capacity
• Regulatory Changes: Policy shifts affecting NBFC operations
Market Risks:
• Sector Rotation: Money moving away from financial stocks
• Liquidity Concerns: Tightening of wholesale funding markets
• Competition: Increased competition from banks and fintech
My Take:
The technical setup suggests accumulation phase completion with potential for a significant move higher. Follow the Strict Trade Plan as Explained Above.
Keep in the Watchlist.
NO RECO. For Buy/Sell.
📌Thank you for exploring my idea! I hope you found it valuable.
🙏FOLLOW for more
👍BOOST if you found it useful.
✍️COMMENT below with your views.
Meanwhile, check out my other stock ideas on the right side until this trade is activated. I would love your feedback.
Disclaimer: "I am not a SEBI REGISTERED RESEARCH ANALYST AND INVESTMENT ADVISER."
This analysis is intended solely for informational and educational purposes and should not be interpreted as financial advice. It is advisable to consult a qualified financial advisor or conduct thorough research before making investment decisions.
Supriya Lifescience (W): Bullish, Awaiting Breakout ConfirmationThe stock is in a classic bullish consolidation pattern. After establishing a major bottom in March 2023, the price has been in a clear uptrend. The current "Ascending Triangle" pattern shows that pressure is building for a significant move.
📈 1. The Dominant Pattern: Ascending Triangle
- Formation: Since October 2024, the stock has been forming a clear Ascending Triangle. This is defined by:
1. A flat, horizontal resistance line that has rejected multiple breakout attempts.
2. A rising support trendline , indicating that buyers are stepping in at progressively higher prices.
- Implication: This pattern is bullish because it shows that sellers are holding a fixed line, but buyer aggression is steadily increasing.
🚀 2. The Current Setup (The "Coiling Spring")
- Pressure Building: The stock has made several attempts to break the resistance and failed. This is normal and builds energy for the eventual move.
- Imminent Test: The stock is once again testing this critical resistance this week . The price is being compressed between the rising support and the flat resistance, which usually precedes a volatile move.
📊 3. Key Technical Indicators
- RSI: The Relative Strength Index is rising on both the Monthly and Weekly timeframes. This shows that long-term and medium-term momentum is building in favor of the buyers.
- EMAs: The short-term Exponential Moving Averages are in a "PCO" (Price Crossover) state, confirming the immediate trend is bullish.
🎯 4. Future Scenarios & Key Levels to Watch
This setup provides two very clear outcomes:
🐂 The Bullish Case (Breakout)
- Trigger: A decisive, high-volume close above the horizontal resistance of the triangle.
- Confirmation: This move would confirm the triangle is complete and the next leg of the uptrend has begun.
- Target: The next logical price target would be ₹1,300 .
🐻 The Bearish Case (Breakdown)
- Trigger: The stock fails at resistance again and, more importantly, breaks below the triangle's rising support trendline .
- Confirmation: This would invalidate the bullish pattern.
- Target: The price would likely fall to retest the next major horizontal support level at ₹710 .

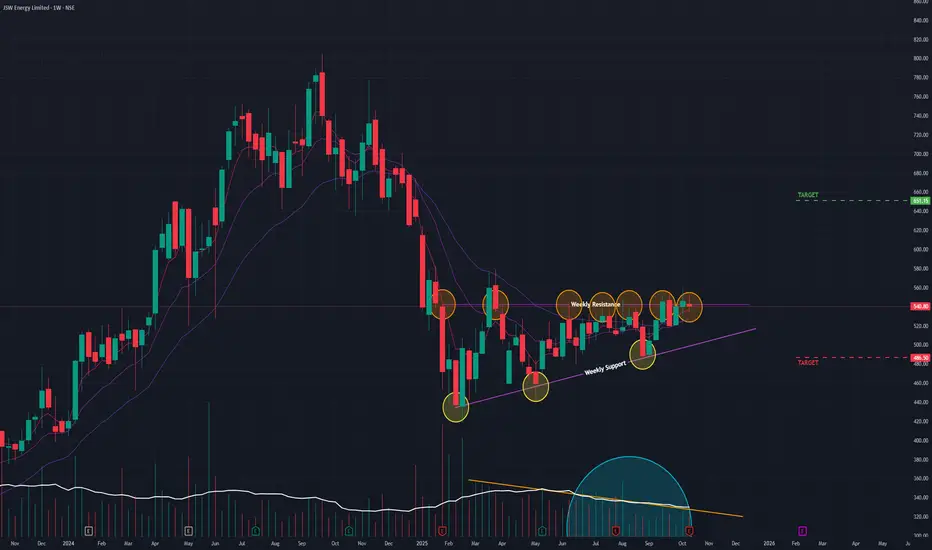
JSW Energy (W) - Coils in Bullish Triangle, Awaiting BreakoutAfter a prolonged downtrend from its September 2024 peak, JSW Energy is showing clear signs of a potential trend reversal, as it meticulously forms a classic bullish pattern. The stock is now approaching a critical decision point.
The Setup: An Ascending Triangle
Since February 2025, the stock has been forming a classic Ascending Triangle . This bullish pattern is characterized by:
- A series of Higher Lows , indicating that buyers are becoming more aggressive on each pullback.
- A flat horizontal resistance of Equal Highs , which has rejected several breakout attempts in recent weeks.
Crucially, as is typical for this type of consolidation pattern, trading volume has been noticeably drying up . This suggests that selling pressure is diminishing and energy is being stored for a potential significant move.
A Nuanced Technical Picture
The technical indicators suggest a trend that is in the process of turning bullish but has not yet received full confirmation across all timeframes:
- EMA: The short-term Exponential Moving Averages (EMAs) show a bullish crossover on the Weekly chart, but the longer-term Monthly chart is still awaiting this signal.
- RSI: The Monthly RSI is already rising (a positive long-term sign), but the Weekly RSI has yet to follow suit with a definitive upward trend.
This mix indicates that while medium-term strength is building, a decisive breakout is needed to align all timeframes and confirm a new, sustained uptrend.
Outlook and Key Triggers to Watch
The resolution of this triangle will likely dictate the stock's next major move.
- Bullish Breakout Scenario: A decisive close above the horizontal resistance on a surge of volume would confirm the breakout. This would signal the start of a new uptrend, with a potential next target of ₹650 .
- Bearish Scenario: If the stock loses momentum and fails to break out, it could fall back to test the rising support trendline of the triangle. The key support level to watch in this case is ₹485 .
The price action in the coming week will be critical. The focus should be on whether the bulls can finally generate the momentum needed to break through the overhead resistance and complete this bullish reversal pattern.
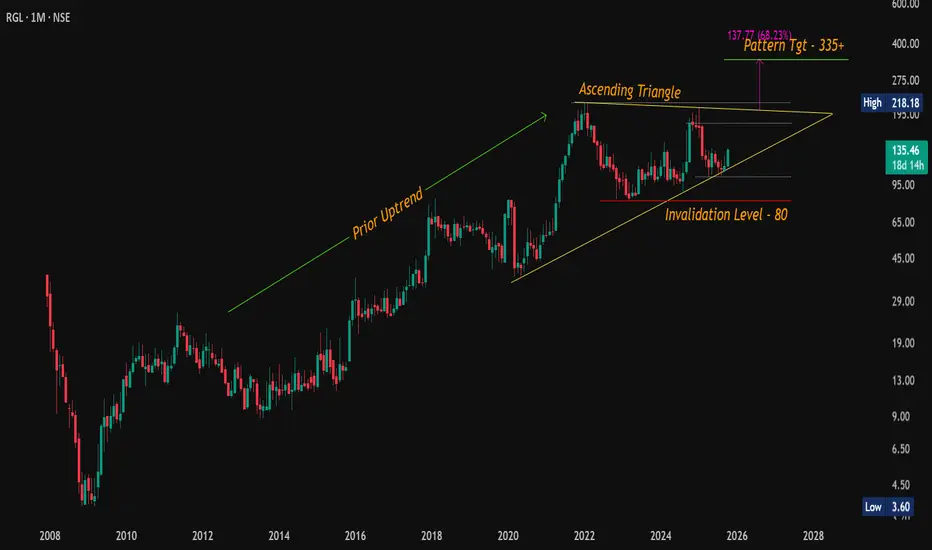
#RGL – Ascending Triangle Breakout Loading?CMP: 135.50
Setting up for a potential bullish breakout with a classic Ascending Triangle pattern on the monthly chart , following a strong prior uptrend.
🔹 Overhead Resistances: 146 / 177 / 207
🔹 Breakout Confirmation Level: 218
🔹 Support Zone: 103 – 99
🔹 Pattern Target: 335+
🔸 ~68% upside from breakout level
🔸 ~150% upside from CMP (135)
📉 Pattern Invalidation Level: 80 MCB
📈 A sustained breakout above 218 (monthly close) may open the gates for a strong move towards 335+. Patience is key on monthly patterns, but reward could be worth the wait.
#RGL | #RenaissanceGlobal | #AscendingTriangle | #ChartPatterns | #LongTerm
📌 Disclaimer: This analysis is shared for educational purposes only. It is not a buy/sell recommendation. Please do your own research before making any trading decisions.
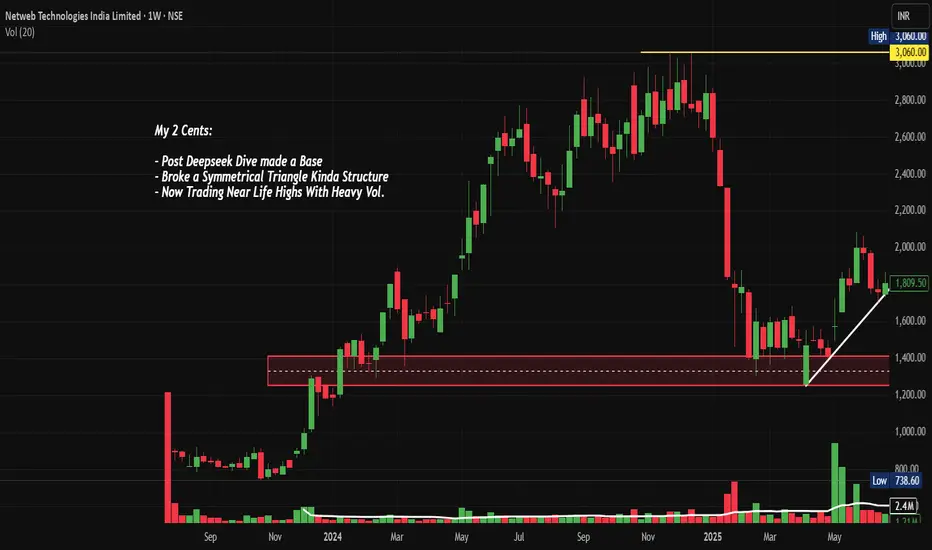
NETWEB: AI Infrastructure Goldmine ? Chart of the MonthNSE:NETWEB MarchingTowards 4,000: Is This the AI Infrastructure Goldmine You've Been Waiting For? Let's analyze in the "Chart of the Month".
As per the Latest SEBI Mandate, this isn't a Trading/Investment RECOMMENDATION nor for Educational Purposes; it is just for Informational purposes only. The chart data used is 3 Months old, as Showing Live Chart Data is not allowed according to the New SEBI Mandate.
Disclaimer: "I am not a SEBI REGISTERED RESEARCH ANALYST AND INVESTMENT ADVISER."
This analysis is intended solely for informational purposes and should not be interpreted as financial advice. It is advisable to consult a qualified financial advisor or conduct thorough research before making investment decisions.
Price Action Analysis:
- Current Price: ₹3,695.40
- 52-Week Range: ₹738.60 - ₹3,745.00
- Recent Performance: +64% gain in a Month with strong momentum
- Price structure shows consistently higher highs and higher lows pattern
- Stock has demonstrated remarkable resilience with a 380% rally from its 52-week low
Volume Spread Analysis:
- Volume surge visible during recent breakout phases
- High volume of 24.25M shares traded, indicating institutional participation
- Volume expansion coinciding with price breakouts confirms genuine buying interest
- Strong volume accumulation during consolidation phases suggests smart money positioning
Chart Patterns Identified:
- Symmetrical Triangle Breakout: Successfully broken above the triangle pattern
- Ascending Triangle: Multiple resistance tests followed by decisive breakout
- Flag and Pennant Patterns: Short-term consolidation after sharp moves
Key Technical Levels:
Support Levels:
- Immediate Support: ₹3,200 (recent consolidation zone)
- Strong Support: ₹2,800 (previous resistance turned support)
- Major Support: ₹2,400 (trendline support and psychological level)
- Critical Support: ₹2,000 (long-term ascending trendline)
Resistance Levels:
- Immediate Resistance: ₹3,745 (52-week high)
- Next Resistance: ₹4,000 (psychological round number)
- Extended Resistance: ₹4,400 (measured move projection)
- Long-term Resistance: ₹5,000
Base Formation:
- Primary Base: ₹1,200-₹1,600 range (established during deep consolidation)
- Secondary Base: ₹2,400-₹2,800 range (recent re-accumulation zone)
- The stock has clearly established a strong foundation above the ₹2,400 levels
Technical Indicators Assessment:
Momentum Indicators:
- RSI is in overbought territory but showing positive divergence
- MACD showing bullish crossover with expanding histogram
- Stochastic indicates strong upward momentum
- ADX suggesting strong trending behaviour
Moving Averages:
- Price trading well above all major moving averages
- 20 EMA, 50 EMA, and 200 EMA in perfect bullish alignment
- Strong uptrend confirmed by ascending moving averages
- No signs of trend reversal in the near term
Sectoral and Fundamental Backdrop:
AI Infrastructure Sector Outlook:
- India's IndiaAI Mission with ₹10,372 crore budget creating massive opportunities
- Government's push for sovereign AI infrastructure benefiting domestic players
- Global demand for AI computing infrastructure is experiencing exponential growth
- Limited domestic competition in the high-end computing solutions space
Company-Specific Fundamentals:
- Netweb's supercomputers have appeared 15 times across three entries in the global Top 500 supercomputers ranking
- The company is almost debt-free with a market cap of ₹20,936 crore
- Recent order wins worth ₹1,734 crore for IndiaAI Mission and ₹450 crore additional order
- Order pipeline of ₹4,142.1 crore as of June 2025, excluding new mandates
Key Growth Catalysts:
- Delivery of servers built on NVIDIA's Blackwell Architecture for India's Sovereign AI System
- Expanding presence in high-performance computing and AI systems
- Strong relationships with global technology partners
- Beneficiary of the government's Digital India and AI initiatives
Financial Performance Metrics:
- Strong revenue visibility from a large order book
- Improving profit margins due to premium product offerings
- Healthy cash flows supporting future expansion
- Zero debt structure providing financial flexibility
Strategic Outlook:
- Expect continued momentum driven by the AI infrastructure theme
- News-driven volatility possible around order execution updates
- Sector rotation into a technology infrastructure play is expected
- Quarterly results will be the key catalyst for sustained momentum
- India's AI infrastructure buildout is a multi-year opportunity
- The company is well-positioned to capture significant market share
Risk Factors to Monitor:
Technical Risks:
- Overbought conditions may lead to profit-taking
- High volatility expected given the stock's momentum
- Any break below ₹3,000 would signal trend weakness
Fundamental Risks:
- Execution risk on large government orders
- Competition from global players in AI infrastructure
- Technology disruption risks in a rapidly evolving sector
- Dependence on government spending cycles
Market Risks:
- Overall market correction could impact high-beta stocks
- Sector rotation away from technology themes
- Global supply chain disruptions affecting component availability
My 2 Cents:
NSE:NETWEB presents a compelling technical setup with strong fundamental support from India's push for AI infrastructure. The stock's breakout from multiple chart patterns, combined with substantial order wins and sector tailwinds, creates an attractive risk-reward proposition. However, position sizing and disciplined risk management remain crucial given the stock's high volatility and premium valuation.
Full Coverage on my Newsletter this Week
Keep in the Watchlist and DOYR.
NO RECO. For Buy/Sell.
📌Thank you for exploring my idea! I hope you found it valuable.
🙏FOLLOW for more
👍BOOST if you found it useful.
✍️COMMENT below with your views.
Meanwhile, check out my other stock ideas on the right side until this trade is activated. I would love your feedback.
As per the Latest SEBI Mandate, this isn't a Trading/Investment RECOMMENDATION nor for Educational Purposes; it is just for Informational purposes only. The chart data used is 3 Months old, as Showing Live Chart Data is not allowed according to the New SEBI Mandate.
Disclaimer: "I am not a SEBI REGISTERED RESEARCH ANALYST AND INVESTMENT ADVISER."
This analysis is intended solely for informational purposes and should not be interpreted as financial advice. It is advisable to consult a qualified financial advisor or conduct thorough research before making investment decisions.
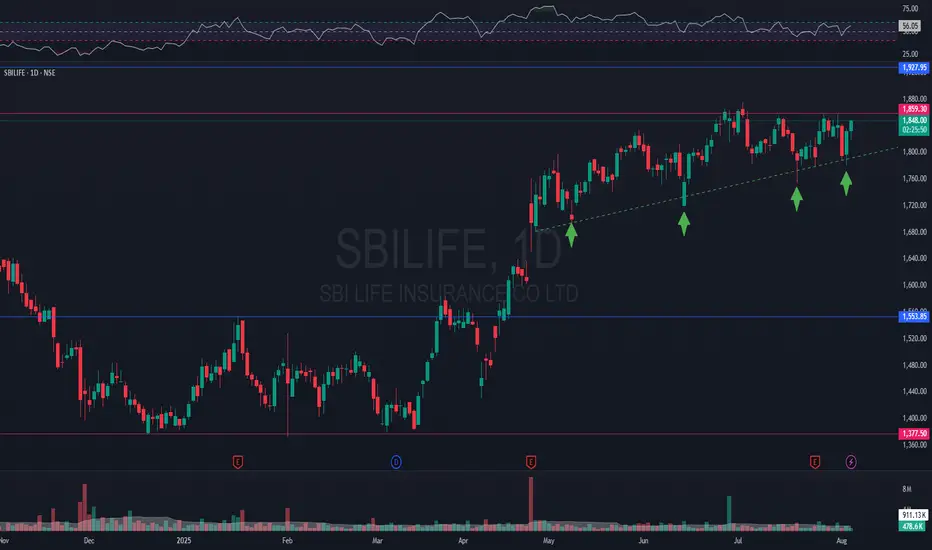
Ascending Triangle Breakout on #SBILIFE#SBILIFE is showing clear signs of a strong breakout from current levels.
The ascending trendline has supported the price since 09MAY25. The price continued to hold near the levels of 1855, with every red candle bought in.
Yesterday, i.e. 04AUG15 was a good day to initiate accumulation. In our view, price is expected to move sharply once the daily/weekly candle closes above 1860 with supporting volumes.
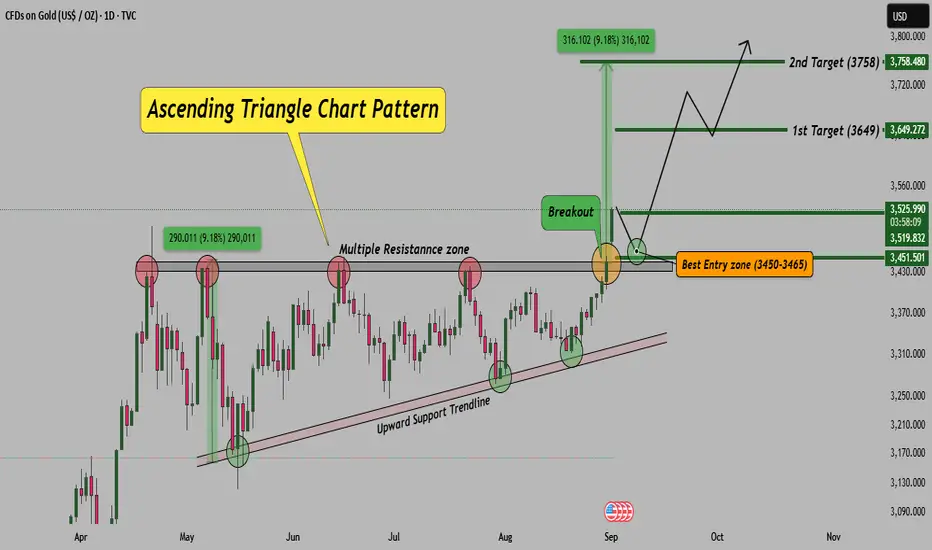
Gold Daily Chart – Ascending Triangle Breakout!Gold has formed a strong ascending triangle pattern on the daily timeframe. The price has successfully broken above the resistance zone, confirming bullish momentum. Such patterns generally indicate continuation of the uptrend, especially when supported by volume and strong price action.
Chart Observation:
As long as price holds above 3,450, the bullish setup remains valid.
A retest of the breakout zone can provide the best risk-to-reward entry opportunity.
Traders should keep an eye on volume confirmation while entering trades.
Note: If levels sustain and setup remains intact, I will share live trade updates in real time. Stay tuned.
Disclaimer: This analysis is for educational purposes only. Please do your own research or consult your financial advisor before taking trades.
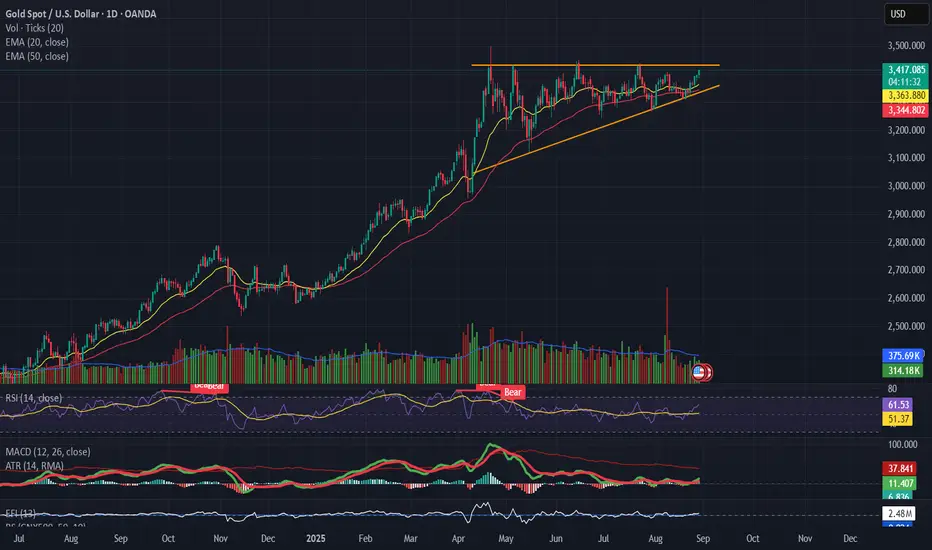
GOLD(XAUUSD) Forming a pennant / ascending triangle 📌 Gold (XAUUSD)
Forming a pennant / ascending triangle with strong resistance near $3,390 – 3,400.
Volume is declining, suggesting indecision.
RSI holding above 50 but not powering higher → momentum is slowing.
MACD flatlining, no fresh bullish impulse yet.
👉 Breakout above $3,400 needed for continuation. Breakdown below $3,340 risks correction.
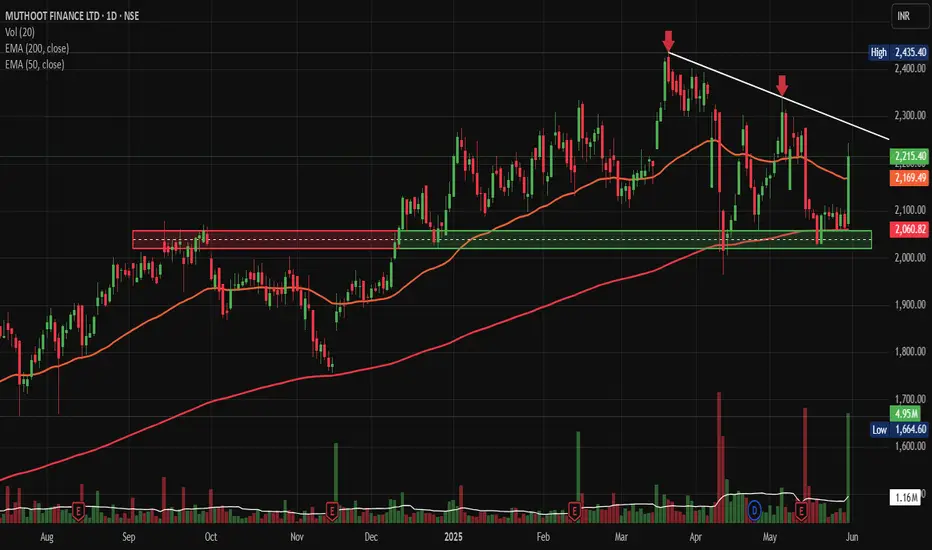
Muthoot Fin. bounce from Polarity LevelsNSE:MUTHOOTFIN made a good bounce from Polarity Levels with a huge candle again with high Volumes and closing above 50 DEMA, taking Support of 200 DEMA.
On the back news of the finance ministry seeking relaxation in the new rules on gold loans proposed by the central bank, they proposed that small ticket borrowers below 200,000 rupees should be excluded from the tighter rules to ensure speedy disbursements.
Price Action & Volume Analysis:
The stock has been consolidating in a well-defined range between ₹2,060-2,070 (support zone) and ₹2,400-2,435 (resistance zone) since April 2025. Today's strong move with above-average volume of 1.16M shares (compared to the 20-day average) suggests institutional participation and potential breakout momentum.
The price action shows a classic "coiling" pattern within the broader range, with decreasing volatility over the past few weeks, often a precursor to significant directional moves.
Key Technical Levels:
Support Zones:
- Immediate Support: ₹2,169-2,180 (50 EMA confluence)
- Strong Support: ₹2,060-2,070 (tested multiple times since April)
- Critical Support: ₹1,950-1,980 (October 2024 breakout level)
Resistance Zones:
- Immediate Resistance: ₹2,300-2,320
- Major Resistance: ₹2,400-2,435 (multiple rejections)
- Extension Target: ₹2,500-2,550
Base Formation & Pattern Recognition:
The stock has formed a robust Ascending Triangle pattern since the October 2024 lows. The horizontal resistance at ₹2,400-2,435, combined with rising support levels, creates a bullish continuation pattern. The triangle's apex is approaching, suggesting an imminent breakout.
Additionally, there's a clear Flag and Pole formation visible from the March-April rally, with the current consolidation representing the flag portion.
Moving Average Analysis:
- 50 EMA (Orange): Currently at ₹2,169, acting as dynamic support
- 200 EMA (Red): Located around ₹2,000, providing long-term trend support
- The stock is trading above both key EMAs, confirming the bullish trend structure
Trade Setup & Strategy:
Bullish Breakout Play:
Entry Strategy:
- Primary Entry: ₹2,320-2,330 (on volume breakout above resistance)
- Alternative Entry: ₹2,280-2,290 (pullback entry if direct breakout fails)
Target Levels:
- Target 1: ₹2,500 (measured move from triangle base)
- Target 2: ₹2,650 (extension target)
- Target 3: ₹2,800 (psychological resistance)
Risk Management:
- Stop Loss: ₹2,150 (below 50 EMA and swing low)
- Risk-Reward Ratio: 1:2.5 to 1:3.5
Position Sizing:
Risk should only be 1-2% of portfolio capital, given the stop loss distance.
Volume Confirmation:
Today's volume spike to 1.16M shares is encouraging, representing nearly 25% above the average. This volume expansion, coinciding with price advancement, suggests institutional accumulation. Watch for sustained volume above 1M shares for breakout confirmation.
Sectoral & Fundamental Backdrop:
NBFC Sector Dynamics:
The Non-Banking Financial Company (NBFC) sector has been gaining traction due to:
- Improving the credit growth environment
- RBI's supportive regulatory stance
- Rising rural credit demand
- Digital transformation initiatives
Muthoot Finance Fundamentals:
- Dominant player in gold financing with 5,000+ branches
- Strong asset quality with minimal NPAs
- Consistent dividend payout history
- Beneficiary of rising gold prices and rural credit demand
- Digital initiatives expanding customer base
Macro Tailwinds:
- Monsoon predictions favouring the rural economy
- Wedding season demand for gold loans
- Formalization of the gold loan market
- Potential interest rate stabilization
Risk Factors:
Technical Risks:
- Failure to sustain above ₹2,300 could lead to range continuation
- Broader market correction could impact individual stock performance
- Sector rotation away from financials
Fundamental Risks:
- Gold price volatility affecting loan demand
- Regulatory changes in the NBFC space
- Competition from banks in the gold loan segment
My Take:
NSE:MUTHOOTFIN presents an attractive risk-reward setup with its ascending triangle breakout potential. The combination of strong fundamentals, sector tailwinds, and technical setup creates a compelling investment thesis. However, strict adherence to stop losses and position sizing remains crucial given the inherent market volatility.
The stock appears poised for a significant move, with the technical pattern suggesting a higher probability of an upside breakout. Traders should wait for volume confirmation above ₹2,320 levels before initiating positions.
Keep in the Watchlist.
NO RECO. For Buy/Sell.
📌Thank you for exploring my idea! I hope you found it valuable.
🙏FOLLOW for more
👍BOOST if you found it useful.
✍️COMMENT below with your views.
Meanwhile, check out my other stock ideas on the right side until this trade is activated. I would love your feedback.
Disclaimer: "I am not SEBI REGISTERED RESEARCH ANALYST AND INVESTMENT ADVISER."
This analysis is intended solely for informational and educational purposes and should not be interpreted as financial advice. It is advisable to consult a qualified financial advisor or conduct thorough research before making investment decisions.
JSW ENERGY - SwingJSW Energy is transitioning aggressively toward renewables, with investments in solar, wind, energy storage, and green hydrogen.
P/E ratio stands at 46.36, indicating a premium valuation compared to the sector average of 32. While growth is underwhelming, the company maintains good asset quality. Debt levels are manageable, and promoter holding remains strong.
The stock recently showed consolidation between 510 - 530, with support near ₹500 and strong resistance around 540. Technical indicators suggest a bullish bias, with MACD showing early signs of upward momentum. Traders may consider swing opportunities if the stock breaks above ₹542 with volume confirmation.

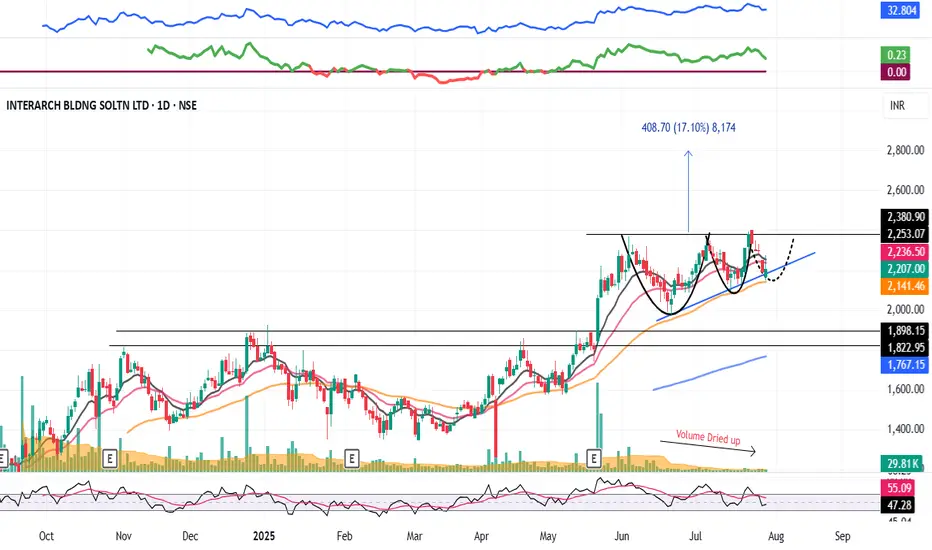
INTERARCH : Swing Pick (1-3 Months)#INTERARCH #vcppattern #chartpattern #ascendingtrianglepattern #breakoutstock #patterntrading #Swingtrading
INTERARCH : This will test Patience
>> VCP formation in process
>> Ascending Triangle forming
>> Breakout candidate
>> Good Strength & Volumes Dried up
>> Trending Stock in consolidation
Swing Traders can lock profits at 10% & Keep Trailing
Pls Comment , Boost and Follow for more such Analysis
Disc : Charts shared are for Learning Purpose and not a Trade recommendation, Consult your Financial advisor or a SEBI Registered Advisor before taking position in it.
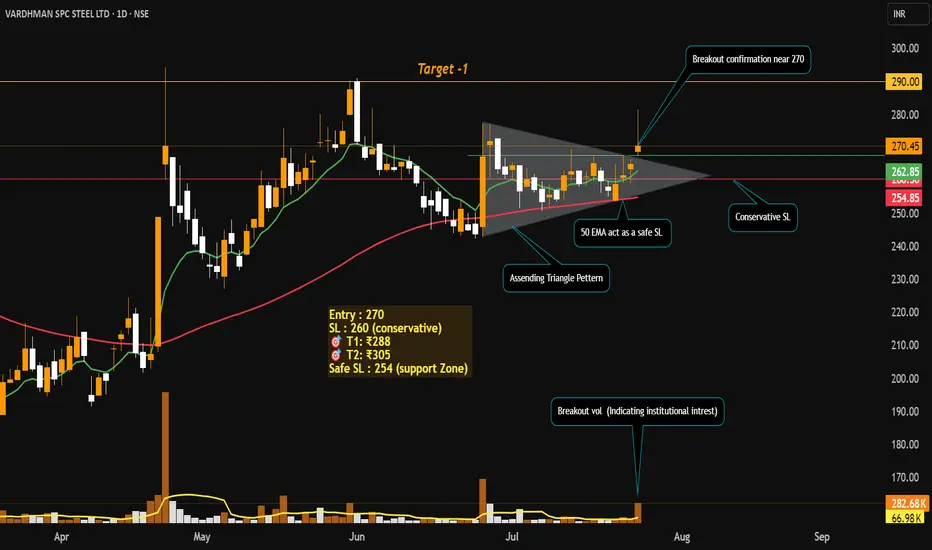
Swing Trade Idea: Vardhman Special Steels Ltd (NSE: VSSL)Technical Setup
Ascending Triangle Breakout on Daily Timeframe
Volume Spike 4x average volume on breakout day — strong institutional confirmation.
both the EMAs Bullish crossover (Price trading above both the EMAs).
RSI showing bullish momentum (60-65).
Price Action Strategy
Price broke out from resistance zone with strong bullish candle and closed near the high.
Previous resistance of ₹270 now acts as support.
Fundamentals
Promoter Holding: High, backed by Aichi Steel (Toyota Group).
Debt/Equity: Low (~0.12) → Strong solvency.
Strong financials: ROE / ROCE ~12.4% / ~17.8%
Revenue Growth: Consistent YoY
Valuation: Reasonable P/E (~18–20x)
My View: Entered at breakout with strong confirmation. Trail SL and book profits step-by-step. Holding for higher targets as long as price respects 9 EMA.
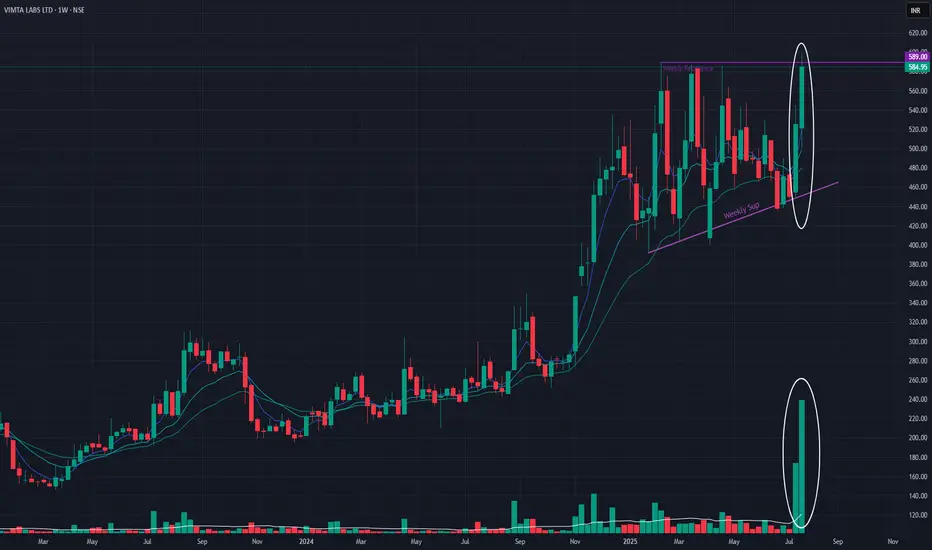
Vimta Labs Ltd (Weekly Timeframe) - Potential BreakoutThis week, the stock has breached the resistance zone and made a new All Time High with huge volume. In Daily Timeframe, the stock has clearly been forming an Ascending Triangle Pattern which is a Bullish pattern. If the stock breaches the resistance zone with good volume, then it may reach new All Time Highs of 780 range.
Awaiting further Price Action.
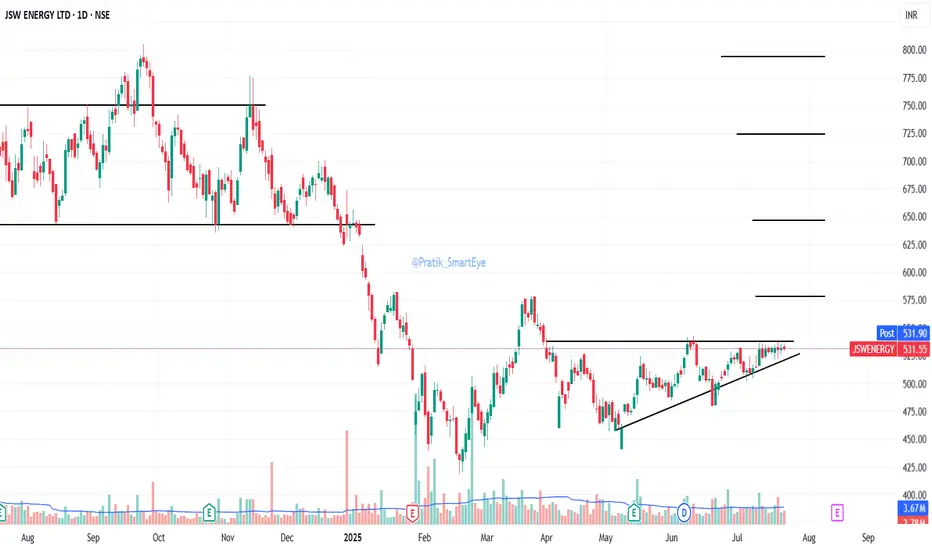
JSW Energy: forming a ascending triangleJSW Energy: forming a ascending triangle. CMP 531.
Breakout at sustained close above 540.
Resistance 578/646/724/794
Support 515/508
Earnings expected on 14Aug25
Solana Long-Term Cup & Handle | +300% Potential🔍 #OnRadar | #Crypto
#SOLUSD (#Solana)
Solana Long-Term Cup & Handle | +300% Potential
CMP: $174
Support Zone: $123.00 – $100.00
Pattern Invalidation Level: $95 (MCB - Monthly Closing Basis)
📊 Technical Overview:
Solana (SOLUSD) is showing signs of a long-term Cup & Handle pattern forming on the higher timeframes.
☕️ Cup formation appears complete.
📐 Handle is likely developing within an Ascending Triangle .
🔄 Neckline Resistance: ~$305
🎯 Potential Target on Breakout: ~$560
🚀 Upside Potential: Approx. +300% from CMP
While it's early to confirm a breakout, this structure is worth keeping on the radar for long-term trend traders and pattern watchers.
⚠️ Disclaimer:
This is a technical analysis observation shared for educational purposes only.
Not a buy/sell recommendation.
Please do your own research ( #DYOR ) and consult your financial advisor before making any investment decisions.
#Crypto | #Solana | #SOL | #TechnicalAnalysis | #ChartPatterns | #CupAndHandle | #AscendingTriangle | #LongTermView

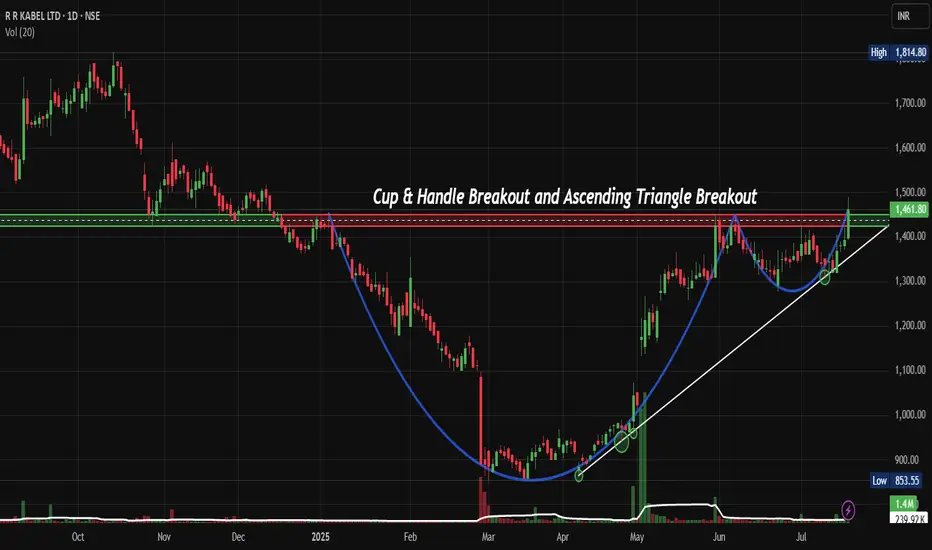
RRKABEL: Cup & Handle Pattern Could Trigger 30% Upside RallyNSE:RRKABEL Perfect Storm: How Cup & Handle Pattern Could Trigger 30% Upside Rally
Price Action Analysis:
Candlestick Patterns:
- Doji Formation: Multiple doji candles during handle formation indicate indecision and potential reversal
- Bullish Engulfing: Strong bullish engulfing pattern on breakout day, showing buying pressure
- Higher Highs/Lows: Clear pattern of higher highs and higher lows post-breakout
- Rejection Candles: Long lower wicks during handle formation show buying support
Price Structure:
- Swing: Clear swing low at ₹853 (March 2025) and swing high at ₹1,850 (previous year)
- Impulse Waves: Strong impulsive moves during the breakout phase indicate institutional participation
- Corrective Waves: Orderly corrective structure during cup and handle formation
- Price Momentum: Accelerating price momentum post-breakout with minimal pullbacks
Market Structure:
- Trend: Transition from downtrend to sideways consolidation to uptrend
- Support Respect: Multiple tests of support levels without breakdown showing strength
- Resistance Breaks: Clean break above multiple resistance levels with conviction
- Price Velocity: Increasing price velocity on breakout indicates strong momentum
Intraday Price Action:
- Opening Gaps: Positive opening gaps during the breakout phase show overnight interest
- Closing Strength: Consistent closing in the upper portion of the daily range
- Pullback Behaviour: Shallow pullbacks with quick recoveries indicate a strong underlying bid
- Volume-Price Sync: Price advances accompanied by volume expansion
Volume Spread Analysis:
Volume Patterns:
- Base Formation: Declining volume during cup formation indicates a lack of selling pressure
- Handle Volume: Minimal volume during handle formation, showing controlled supply
- Breakout Volume: Significant volume spike on breakout confirming institutional participation
- Volume Trend: Above-average volume sustaining post-breakout
Volume Indicators:
- Accumulation Phase: Volume patterns suggest institutional accumulation during the base
- Breakout Confirmation: 2-3x average volume on breakout day
- Follow-through: Consistent volume support in subsequent sessions
- Volume Price Analysis: Positive volume-price correlation during upward movement
Technical Patterns:
Primary Pattern: Cup & Handle Formation
- Cup Formation: The stock formed a classical cup pattern from Jan 2025 to March 2025, with the left rim at approximately ₹1,420 levels
- Handle Formation: A clean handle pattern developed from May to July 2025, showing controlled consolidation with diminishing volume
- Breakout Confirmation: Strong breakout above ₹1,420 resistance with increased volume, signalling pattern completion
- Pattern Reliability: The 6-month cup formation provides a strong technical foundation for sustained upward momentum
Secondary Pattern: Ascending Triangle
- Formation Period: June to July 2025 within the handle structure
- Resistance Level: Horizontal resistance at ₹1,420 tested multiple times
- Support Trend: Rising support line indicating accumulation phase
- Breakout: Clean breakout above triangle resistance with volume expansion
Support & Resistance Levels:
Key Support Levels:
- Immediate Support: ₹1,350 (breakout pullback level)
- Secondary Support: ₹1,280 (handle low)
- Major Support: ₹1,200 (psychological level and previous resistance)
- Critical Support: ₹1,080 (cup base level)
Key Resistance Levels:
- Immediate Resistance: ₹1,500 (psychological level)
- Target Resistance: ₹1,650 (cup depth projection)
- Extended Target: ₹1,800 (previous swing high)
- Long-term Resistance: ₹1,850 (52-week high)
Base Analysis:
Base Characteristics:
- Base Type: Cup with handle base formation
- Duration: 7 months (Jan 2025 to July 2025)
- Depth: Approximately 35% correction from highs
- Volume Pattern: Declining volume during base formation, expanding on breakout
- Base Quality: High-quality base with proper structure and time frame
Base Strength Indicators:
- Volatility Contraction: Price volatility decreased during handle formation
- Volume Dry-up: Minimal selling pressure during consolidation
- Support Holding: Multiple tests of support levels without breakdown
- Institutional Activity: Likely accumulation phase based on volume patterns
Trade Setup:
Entry Strategy:
- Primary Entry: ₹1,420-1,430 (on breakout confirmation)
- Secondary Entry: ₹1,380-1,400 (on pullback to breakout level)
- Aggressive Entry: ₹1,350-1,360 (deeper pullback support)
Entry Confirmation Signals:
- Volume Expansion: Minimum 1.5x average volume on entry
- Price Action: Close above ₹1,420 for two consecutive sessions
- Momentum: RSI above 50 and trending upward
- Moving Averages: Price above 20 and 50-day moving averages
Exit Levels:
Profit Targets:
- Target 1: ₹1,500 (5.5% upside) - Psychological resistance
- Target 2: ₹1,650 (16% upside) - Cup depth projection
- Target 3: ₹1,800 (27% upside) - Previous swing high
- Extended Target: ₹1,850 (30% upside) - 52-week high
Exit Strategy:
- Partial Profit: Book 25% at Target 1
- Scale Out: 50% at Target 2
- Trailing Stop: Implement 8-10% trailing stop after Target 2
- Final Exit: Complete exit at Target 3 or on stop-loss trigger
Stop-Loss Strategy:
Stop-Loss Levels:
- Conservative: ₹1,320 (7% below entry)
- Moderate: ₹1,280 (10% below entry)
- Aggressive: ₹1,250 (12% below entry)
Stop-Loss Management:
- Initial Stop: Below handle low at ₹1,280
- Trailing Stop: Move to breakeven after 5% profit
- Progressive Stops: Raise stops with each target achievement
- Time Stop: Exit if no progress within 4-6 weeks
Position Sizing:
Risk-Based Sizing:
- Conservative Approach: 1-2% of portfolio risk
- Moderate Approach: 2-3% of portfolio risk
- Aggressive Approach: 3-5% of portfolio risk
Position Calculation:
- Risk Per Share: Entry price minus stop-loss level
- Position Size: (Portfolio Risk Amount) / (Risk Per Share)
- Example: For ₹1,400 entry with ₹1,280 stop, risk = ₹120 per share
- Capital Allocation: Maximum 5-8% of total portfolio in a single position
Risk Management:
Risk Control Measures:
- Position Sizing: Limit individual position to 5% of portfolio
- Stop-Loss Discipline: Strict adherence to predetermined stop levels
- Diversification: Maintain exposure across multiple sectors
- Correlation Risk: Avoid concentration in similar cable stocks
Risk Monitoring:
- Daily Monitoring: Track volume, price action, and sector performance
- Weekly Review: Assess progress toward targets and adjust stops
- News Monitoring: Stay updated on company and sector developments
- Market Correlation: Monitor broader market conditions
Sectoral Backdrop:
Indian Cable Industry Outlook:
- Market Growth: The market is projected to grow from USD 10.01 billion in 2025 to USD 17.08 billion by 2032, exhibiting a CAGR of 7.94% during the forecast period
- Infrastructure Push: India's National Grid capacity is expanding continuously under the PM Gati Shakti National Master Plan, which is expected to add around 26,988 circuit km capacity by 2024-2025
- Renewable Energy: India has observed a substantial rise in the demand for wires and cables due to the country's ambitious renewable energy goals
Growth Drivers:
- Smart Cities: The development of smart cities in the country, along with the increase in electronic devices in the household, would increase the demand
- Government Investment: India Wires and Cables Market would grow on the back of rapidly growing investment by the government towards the development of infrastructural projects
- Electrification: Growing electricity demand is driving transmission and distribution network expansion
Fundamental Backdrop:
Company Profile:
- Market Position: RR Kabel is now the 4th largest W&C Company in India by value.
- Global Presence: With a global presence spanning over 67 countries, this electrical company has established a strong international footprint
- Financial Performance: Revenue: 7,618 Cr · Profit: 312 Cr
Financial Metrics:
- Market Cap: Mkt Cap: 16,529 Crore (down -17.5% in 1 year)
- Valuation: Stock is trading at 7.68 times its book value
- Promoter Holding: Promoter Holding: 61.8%
- 52-Week Range: The 52-week high is ₹1825 and the 52-week low is ₹750
Investment Considerations:
- Sector Tailwinds: Strong sectoral growth prospects with government infrastructure push
- Market Leadership: Established position as the 4th largest cable company in India
- International Exposure: Diversified revenue streams from 67 countries
- Valuation Concerns: Recent 22.8% decline in market cap may indicate value opportunity
My Take:
The technical setup for NSE:RRKABEL presents a compelling opportunity with the successful completion of a cup and handle pattern. The 8-month base formation, combined with strong sectoral tailwinds and the company's market leadership position, creates a favourable risk-reward scenario. The breakout above ₹1,420 with volume confirmation suggests institutional participation and potential for sustained upward momentum toward the ₹1,650-1,800 target range.
Key success factors include strict adherence to stop-loss levels, proper position sizing, and monitoring of broader market conditions. The sectoral growth prospects, driven by infrastructure development and renewable energy initiatives, provide fundamental support for the technical breakout.
Keep in the Watchlist and DOYR.
NO RECO. For Buy/Sell.
📌Thank you for exploring my idea! I hope you found it valuable.
🙏FOLLOW for more
👍BOOST if you found it useful.
✍️COMMENT below with your views.
Meanwhile, check out my other stock ideas on the right side until this trade is activated. I would love your feedback.
Disclaimer: "I am not a SEBI REGISTERED RESEARCH ANALYST AND INVESTMENT ADVISER."
This analysis is intended solely for informational and educational purposes and should not be interpreted as financial advice. It is advisable to consult a qualified financial advisor or conduct thorough research before making investment decisions.
KIRLPNU: Technical Breakout Attempt That Could Deliver 25% ReturNSE:KIRLPNU : A Technical Breakout Attempt That Could Deliver 25% Returns
Price Action Analysis:
- Current Price: Rs 1,511.20
- Day's High: Rs 1,817.00
- Day's Low: Rs 953.00
- Volume: 152.69K shares
Volume Spread Analysis:
Volume Profile:
- Significant volume spike during recent breakout attempt
- Volume during consolidation was relatively lower
- Current volume suggests institutional buying
- Volume trend supports price movement authenticity
Volume Indicators:
- Volume surge above 20-day average confirms breakout attempt
- Price-volume divergence absent, indicating a healthy move
- The accumulation phase is visible in the volume profile during base formation
Key Technical Observations:
- The stock has shown a strong upward momentum with a significant gap-up movement
- Price has moved from the consolidation zone around Rs 1,350-1,400 to the current levels
- Strong volume surge indicating institutional participation
- Daily candlestick pattern shows bullish momentum with long green candles
Technical Levels & Pattern Analysis:
Support Levels:
- Immediate Support: Rs 1,350-1,380 (previous resistance turned support)
- Strong Support: Rs 1,250-1,300 (multiple touch points)
- Major Support: Rs 1,100-1,150 (significant accumulation zone)
Resistance Levels:
- Immediate Resistance: Rs 1,550-1,580 (red horizontal line marked on chart)
- Next Resistance: Rs 1,650-1,700 (psychological level)
- Major Resistance: Rs 1,800-1,850 (day's high region)
Base Formation:
- Multi-month base formation visible from December 2024 to June 2025
- Consolidation range: Rs 1,100 to Rs 1,400
- Base breakout occurred around Rs 1,380-1,400 levels
- Volume expansion during breakout confirms strength
Technical Patterns:
- Cup and Handle pattern completion with breakout attempt
- Ascending triangle formation during the consolidation phase
- Bullish flag pattern on shorter timeframes
- Higher highs and higher lows trend intact
Trade Setup:
Entry Strategy:
- Primary Entry: Rs 1,480-1,520 (current market price on dips)
- Secondary Entry: Rs 1,350-1,380 (on pullback to support)
- Aggressive Entry: Rs 1,540-1,560 (breakout continuation)
Target Levels:
- Target 1: Rs 1,650-1,700 (8-12% upside)
- Target 2: Rs 1,800-1,850 (18-22% upside)
- Target 3: Rs 1,950-2,000 (25-30% upside)
Stop Loss Levels:
- Conservative Stop Loss: Rs 1,320 (below major support)
- Aggressive Stop Loss: Rs 1,420 (below immediate support)
- Trailing Stop Loss: Rs 1,480 (after first target achievement)
Risk Management:
Position Sizing:
- Conservative traders: 2-3% of portfolio
- Moderate traders: 4-5% of portfolio
- Aggressive traders: 6-8% of portfolio
- Risk per trade should not exceed 1-2% of total capital
Risk Assessment:
- Risk-Reward Ratio: 1:2 to 1:3 (favorable)
- Maximum drawdown potential: 12-15%
- Probability of success: 65-70% based on technical setup
Money Management Rules:
- Never risk more than 2% of capital per trade
- Use position sizing based on stop loss distance
- Maintain diversification across sectors
- Book partial profits at predetermined levels
Sectoral Backdrop:
Industry Overview:
- NSE:KIRLPNU is engaged in the manufacturing and service of engineering goods, operating through the Compression Systems Segment, comprising air and gas compressors, air-conditioning and refrigeration
- Industrial air compressor market to grow at 8.2% CAGR (2023-2033) with market share to reach US$6.86 Billion by 2033
Market Dynamics:
- India Air Compressor Market is forecast to reach $995 million by 2030, after growing at a CAGR of 5.2% during 2024-2030
- Manufacturing is expected to contribute 39.1% share of the market in 2025, as the industry relies heavily on compressed air for pneumatic tools
Growth Drivers:
- Increasing industrialization and infrastructure development
- Rising demand from the manufacturing and automotive sectors
- Energy-efficient compressor adoption
- Government initiatives supporting industrial growth
Fundamental Backdrop:
Financial Performance:
- Market Cap: 9,797 Crore with Revenue of 1,629 Cr and Profit of 211 Cr
- Revenue: ₹583Cr as on March 2025 (Q4 FY25) with Net Profit: ₹81Cr
- Annual revenue growth of 23% is outstanding, Pre-tax margin of 17% is great, ROE of 21.1% is exceptional, ROCE of 28.3% is also exceptional
Key Metrics:
- The stock is trading at 8.95 times its book value
- The company is debt-free and has a strong balance sheet, enabling stable earnings growth
- Promoter holding has decreased over the last 3 years: -14.8% with current Promoter Holding: 38.85%
Analyst Outlook:
- Recent research reports show an average share price target of 1784
- Strong financial metrics support technical breakout
- Debt-free status provides financial flexibility
- Consistent profitability across business cycles
Investment Thesis Summary:
Bullish Factors:
- Strong technical breakout attempt with volume confirmation
- Robust financial performance with 23.14% revenue growth
- Favourable industry growth prospects
- Debt-free balance sheet providing stability
Risk Factors:
- General market volatility
- Sector-specific cyclical risks
- Global economic uncertainties
- Promoter holding reduction trend
My Take:
NSE:KIRLPNU presents a compelling technical setup with strong fundamental backing. The recent breakout attempt from multi-month consolidation, supported by volume surge and positive sector outlook, creates an attractive risk-reward opportunity for medium-term investors. The company's strong financial metrics and debt-free status add confidence to the technical setup.
Keep in the Watchlist.
NO RECO. For Buy/Sell.
📌Thank you for exploring my idea! I hope you found it valuable.
🙏FOLLOW for more
👍BOOST if you found it useful.
✍️COMMENT below with your views.
Meanwhile, check out my other stock ideas on the right side until this trade is activated. I would love your feedback.
Disclaimer: "I am not a SEBI REGISTERED RESEARCH ANALYST AND INVESTMENT ADVISER."
This analysis is intended solely for informational and educational purposes and should not be interpreted as financial advice. It is advisable to consult a qualified financial advisor or conduct thorough research before making investment decisions.

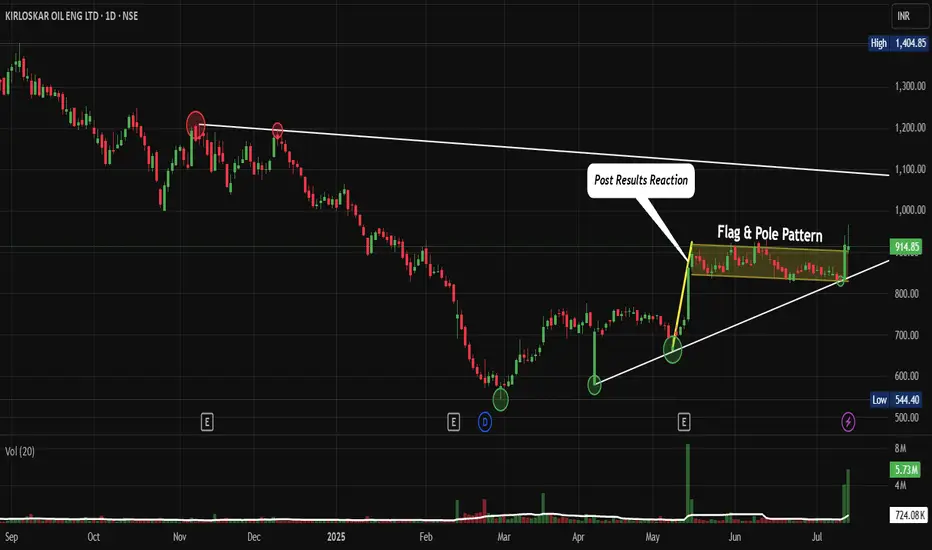
KIRLOSENG: Post-Results Breakout and Consolidation. F&P PatternNSE:KIRLOSENG : How This Hidden Gem Could Be Your Next Big Winner After Post-Results Breakout and Consolidation Let's Analyze in my "Chart of the Week"
Price Action:
- The stock shows a classic recovery pattern from March 2025 lows around ₹590-600
- Current price at ₹914.85 represents a significant 52% recovery from the March bottom
- The stock has been forming higher lows since March, indicating underlying strength
- Recent breakout above the ₹850 resistance level with strong volume confirmation
Volume Spread Analysis:
- Volume spike during the recent breakout suggests institutional participation
- The post-results reaction shows a healthy volume of 724.08K against a 20-day average of 5.73M
- Volume patterns indicate an accumulation phase during the consolidation period from April to June
Base Formation:
- Primary base established between ₹590-650 (March 2025 lows)
- Secondary base formed around the ₹750-800 level during April-May consolidation
- Current base being built around ₹880-920 after the recent breakout
Support and Resistance Levels:
Key Support Levels:
- Immediate support: ₹880-890 (recent breakout level)
- Strong support: ₹830-850 (previous resistance turned support)
- Major support: ₹780-800 (secondary base level)
- Ultimate support: ₹590-650 (primary base)
Resistance Levels:
- Immediate resistance: ₹950-970
- Major resistance: ₹1,000-1,020 (psychological level)
- Long-term resistance: ₹1,100-1,150 (previous highs from late 2024)
- Ultimate target: ₹1,400+ (all-time high region)
Technical Patterns:
Flag and Pole Pattern:
- The chart clearly shows a flag and pole formation
- The flag represents the consolidation phase from May to June 2025
- Recent breakout confirms the pattern completion with an upward trajectory
Ascending Triangle:
- The stock has formed an ascending triangle pattern with higher lows and consistent resistance around ₹850
- The breakout above this level validates the bullish continuation pattern
Post-Results Reaction:
- Kirloskar Oil Engines shares settled slightly, trading at Rs 803.75, representing a 9.36% increase, while the BSE Sensex was up by 0.25%.
- The positive reaction to results indicates market confidence in the company's performance
Trade Setup:
Entry Strategy:
- Primary entry: ₹900-920 (current levels on any dip)
- Secondary entry: ₹880-890 (on pullback to support)
- Aggressive entry: ₹930-950 (on breakout above current resistance)
Entry Levels:
- Conservative traders: Wait for pullback to ₹880-890 support
- Moderate traders: Enter at current levels around ₹910-920
- Aggressive traders: Enter on a breakout above ₹950
Exit Strategy:
Target Levels:
- Target 1: ₹1,000 (8-10% upside)
- Target 2: ₹1,100 (18-20% upside)
- Target 3: ₹1,250 (35-40% upside)
- Ultimate target: ₹1,400+ (50%+ upside)
Exit Timing:
- Book 30% profits at Target 1
- Book 40% profits at Target 2
- Hold the remaining 30% for the ultimate target with a trailing stop loss
Risk Management:
Stop-Loss Levels:
- Conservative stop-loss: ₹850 (6-7% downside)
- Moderate stop-loss: ₹830 (8-9% downside)
- Aggressive stop-loss: ₹800 (11-12% downside)
Position Sizing:
- Risk per trade: Maximum 2% of portfolio
- Position size calculation: Portfolio value × 2% ÷ (Entry price - Stop loss)
- For ₹1,00,000 portfolio with entry at ₹910 and stop at ₹850: Position size = ₹2,000 ÷ ₹60 = 33 shares
Sectoral Backdrop:
Industrial Machinery Sector:
- The industrial machinery sector has been showing resilience amid economic recovery
- Infrastructure push by the government supports demand for engines and pumps
- Agricultural mechanization trends favour companies like NSE:KIRLOSENG
Market Position:
- The company caters to the agriculture, ... Clients (Marine, Defence, etc), After Sales Support, Retail Channel – Tractor spares, Oil, Batteries.
- Diversified revenue streams provide stability across economic cycles
Fundamental Backdrop:
Financial Performance:
- Netprofit is up for the last 2 quarters, 68 Cr → 127 Cr (in ₹)
- Revenue is up for the last 2 quarters, 1454 Cr → 1753 Cr (in ₹)
- As of 31-Mar-2025, Kirloskar Oil Engines has a trailing 12-month revenue of 6349 Cr
Market Valuation:
- Its current market cap is 13,289 Cr with 14.5 Cr shares.
- Stock is trading at 4.30 times its book value
- Promoter holding has decreased over the last 3 years: -18.3%
Growth Outlook:
- The B2B business grew 5 per cent year on year, and the B2C business also witnessed a double-digit growth of 14 per cent year on year
- Strong positioning in agriculture and industrial segments provides sustainable growth prospects
- The final dividend of Rs 4 per equity Share indicates management confidence
My Take:
Investment Rationale:
- Technical breakout supported by improving fundamentals
- Diversified business model reduces concentration risk
- Strong balance sheet with consistent profitability
- Attractive valuation after the recent correction from highs
The combination of technical breakout, improving fundamentals, and supportive sectoral trends makes NSE:KIRLOSENG an attractive investment opportunity for medium to long-term investors with appropriate risk management measures in place.
Keep in the Watchlist.
NO RECO. For Buy/Sell.
📌Thank you for exploring my idea! I hope you found it valuable.
🙏FOLLOW for more
👍BOOST if you found it useful.
✍️COMMENT below with your views.
Meanwhile, check out my other stock ideas on the right side until this trade is activated. I would love your feedback.
Disclaimer: "I am not a SEBI REGISTERED RESEARCH ANALYST AND INVESTMENT ADVISER."
This analysis is intended solely for informational and educational purposes and should not be interpreted as financial advice. It is advisable to consult a qualified financial advisor or conduct thorough research before making investment decisions.
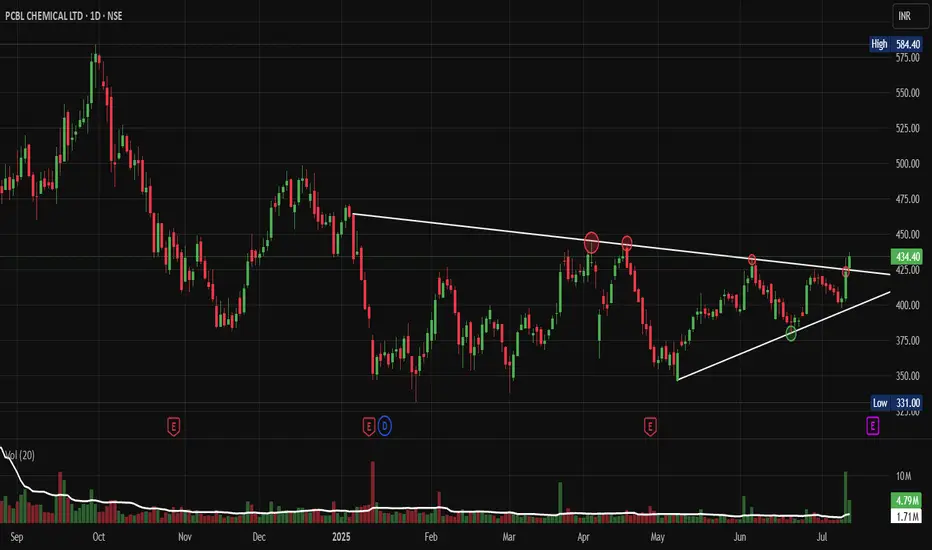
PCBL: The Sleeping Giant Ready to BreakOut of Its TriangleNSE:PCBL : The Sleeping Giant Ready to Break Out of Its Consolidation Triangle
Price Action Analysis:
• Stock has been trading in a well-defined ascending triangle pattern since early 2025
• Current price at ₹434.40 represents a +2.53% gain, showing bullish momentum
• The pattern shows a higher low formation with resistance around ₹450-460 levels
• Recent price action suggests an accumulation phase with controlled volatility
Volume Spread Analysis:
• Volume has been consistently above average during recent sessions (4.79M vs 1.71M average)
• Volume spike visible in recent trading sessions, indicating increased institutional interest
• The volume pattern supports the price consolidation with periodic accumulation phases
• Higher volume during up-moves compared to down-moves suggests buying interest
Key Technical Levels:
Support Levels:
• Primary Support: ₹420-425 (recent swing low)
• Secondary Support: ₹390-395 (ascending trendline support)
• Major Support: ₹360-370 (previous consolidation zone)
Resistance Levels:
• Immediate Resistance: ₹450-460 (triangle upper boundary)
• Key Resistance: ₹480-490 (previous highs)
• Major Resistance: ₹520-530 (psychological level)
Base Formation:
• The stock has formed a strong ascending triangle base over 6-7 months
• Base depth of approximately 15-20% from highs to lows
• Duration suggests a sustainable breakout when it occurs
• Base shows characteristics of institutional accumulation
Technical Patterns:
• Primary Pattern: Ascending Triangle (Bullish)
• Secondary Pattern: Flag formation on shorter timeframes
• Volume-Price Relationship: Positive divergence during recent consolidation
• Moving Average Setup: Price trading above all its key moving averages
Trade Setup:
Entry Strategy:
• Breakout Entry: ₹465-470 (above triangle resistance with volume confirmation)
• Pullback Entry: ₹440-445 (on any dip to support with volume)
• Accumulation Entry: ₹420-430 (for longer-term investors)
Exit Levels:
• Target 1: ₹520-530 (measured move from triangle base)
• Target 2: ₹580-590 (previous swing high zone)
• Target 3: ₹650-680 (extension target based on base depth)
Stop-Loss Levels:
• For Breakout Trades: ₹445-450 (below breakout level)
• For Accumulation Trades: ₹410-415 (below key support)
• Trailing Stop: Use an 8-10% trailing stop after the first target
Position Sizing:
• Conservative Approach: 2-3% of portfolio
• Moderate Approach: 3-5% of portfolio
• Aggressive Approach: 5-7% of portfolio (only for experienced traders)
Risk Management:
• Risk-Reward Ratio: Minimum 1:2 for all trades
• Maximum risk per trade: 2% of total capital
• Use the position sizing calculator based on stop-loss distance
• Avoid adding to losing positions
• Book partial profits at each target level
Sectoral Backdrop:
Chemical Sector Overview:
• Indian chemical sector showing strong fundamentals with export growth
• The speciality chemicals segment is experiencing robust demand
• The government's PLI scheme supports domestic chemical manufacturing
• Global supply chain diversification benefiting Indian chemical companies
Industry Trends:
• Increasing demand for agrochemicals and pharmaceutical intermediates
• Focus on sustainable and green chemistry practices
• Rising input costs are being managed through pricing power
• Strong export opportunities in speciality chemicals
Fundamental Backdrop:
Company Overview:
• NSE:PCBL is a leading player in speciality chemicals and carbon black
• Strong presence in the tire industry through carbon black manufacturing
• Diversified product portfolio, reducing concentration risk
• Established relationships with major tire manufacturers
Financial Highlights:
• Consistent revenue growth over the past few quarters
• Improving margin profile due to operational efficiency
• Strong balance sheet with manageable debt levels
• Increasing return on equity and asset efficiency
Growth Drivers:
• Expanding tire industry in India and globally
• New product launches in speciality chemicals
• Capacity expansion plans for key products
• Focus on high-margin speciality products
Risk Factors:
• Raw material price volatility
• Environmental regulations compliance costs
• Competition from global players
• Cyclical nature of the tire industry
My Take:
NSE:PCBL presents a compelling technical setup with its ascending triangle pattern nearing completion. The combination of strong volume accumulation, supportive sectoral trends, and improving fundamentals creates a favourable risk-reward scenario. Traders should wait for a decisive breakout above the ₹465 levels, accompanied by volume confirmation, for optimal entry. Meanwhile, investors can consider gradual accumulation at current levels, exercising proper risk management.
Keep in the Watchlist.
NO RECO. For Buy/Sell.
📌Thank you for exploring my idea! I hope you found it valuable.
🙏FOLLOW for more
👍BOOST if you found it useful.
✍️COMMENT below with your views.
Meanwhile, check out my other stock ideas on the right side until this trade is activated. I would love your feedback.
Disclaimer: "I am not a SEBI REGISTERED RESEARCH ANALYST AND INVESTMENT ADVISER."
This analysis is intended solely for informational and educational purposes and should not be interpreted as financial advice. It is advisable to consult a qualified financial advisor or conduct thorough research before making investment decisions.