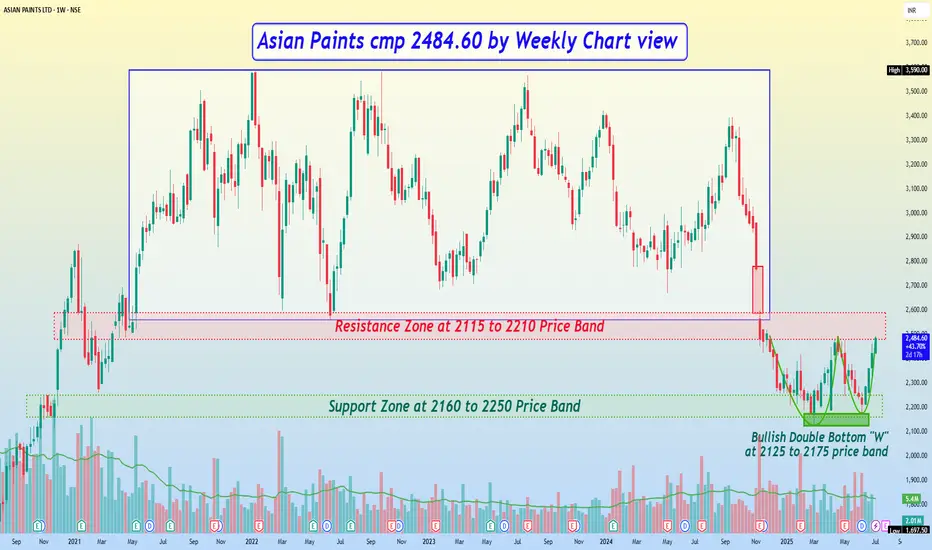
Asian Paints cmp 2484.60 by Weekly Chart view*Asian Paints cmp 2484.60 by Weekly Chart view*
- Support Zone at 2160 to 2250 Price Band
- Resistance Zone at 2115 to 2210 Price Band
- Bullish Double Bottom "W" near Support Zone around the 2125 to 2175 price band
- Gap Down Opening of 11-Nov-2024 to act as a hurdle and will get closure only during next upside
- Stock had been trading within 2560 to ATH 3590 price band for 4+ years, unable to break this range
- The stock took a breakdown from the price range but is attempting to reverse from the Support Zone
Asianpaintstechnicalchartsetup
Asian Paints cmp 2257.60 by Weekly Chart viewKeep the stock on radar basis Support Zone been tested retested for probable upside breakout movement attempts
Asian Paints cmp 2257.60 by Weekly Chart view
- Support Zone at 2115 to 2210 Price Band
- Gap Down Opening of 11-Nov-2025 will get a closure only on next upside
- Weekly Support at 2115 > 1930 > 1685 with Resistance seen at 2430 > 2665 > 2855
- Stock has been trading within 2560 to ATH 3590 price band for 4+ years, unable to break this range
- The stock has broken down from the price range but is attempting to reverse from the Support Zone
- Volumes were more on Selling side indicative of consistent weakness for the stock but taking some stable ground around Support Zone by Weekly Chart
