JK Tyre & Industries Ltd – Weekly Chart Breakout WatchJK Tyre & Industries Limited is currently showing strong momentum, and the price action suggests that the stock may be approaching a fresh breakout above the ₹554 level.
Since this analysis is based on the weekly timeframe, the primary focus will be on a weekly breakout and weekly closing above the mentioned resistance (554). A confirmed close above this level will be considered as valid breakout confirmation.
Chart Structure & Price Action
The stock has recently come out of a 30–40 day consolidation phase
Post consolidation, the stock has formed a strong bullish candle, indicating renewed buying interest.
Price action suggests that the stock is respecting the breakout zone
Breakout Perspective
Breakout Level to Watch: ₹554 (weekly closing basis)
This appears to be an all-time high breakout
If sustained, a new upward phase can potentially begin from here
Momentum traders may consider tracking the stock closely once confirmation is received
Trade Planning & Risk Management
Entry should be considered only after a confirmed breakout
The breakout candle low can be used as a reference for risk management
Alternatively, ₹480 can be considered as an invalidation level
Proper position sizing and risk calculation are essential before entering any trade
What to Do Now
Keep the stock on your watchlist
Monitor weekly price action carefully
Avoid premature entries before confirmation
Further updates will be shared as the structure evolves
Disclaimer
This post represents my personal observations and is shared strictly for educational purposes only.
It is not financial advice.
Please:
Do your own analysis
Consult your financial advisor if needed
Always calculate risk before taking any trade
The financial market involves both opportunity and risk, and disciplined decision-making is essential.
Thank you.
See you in the next update.
Athbreakout

#DCBBANK - BreakOut in DTF with Volume Script: DCBBANK
Key highlights: 💡⚡
📈 C&H BreakOut in Daily Time Frame
📈 Volume spike during Breakout
📈 Base BreakOut
📈 RS Line making 52WH
📈 MACD Crossover
BUY ONLY ABOVE 200 DCB
⏱️ C.M.P 📑💰- 199.62
🟢 Target 🎯🏆 – 12%
⚠️ Stoploss ☠️🚫 – 6%
⚠️ Important: Market conditions are BAD, Avoid entering any Trade. Protect Capital Always
⚠️ Important: Always Exit the trade before any Event.
⚠️ Important: Always maintain your Risk:Reward Ratio as 1:2, with this RR, you only need a 33% win rate to Breakeven.
✅ Boost and Follow to never miss a new idea!✅
Disclaimer: I am not SEBI Registered Advisor. My posts are purely for training and educational purposes. Not a BUY or SELL recommendation.
Eat🍜 Sleep😴 TradingView📈 Repeat 🔁
Happy learning with MMT. Cheers!🥂

XAUUSD – Weekly outlookXAUUSD – Weekly outlook: structure points towards 4,580 as long as bulls hold the line
Brian – Favouring buy-the-dip setups while price holds above 3,996
1. Market overview – triangle break and trend confirmation
On the daily chart, gold has finally broken out of the long consolidation triangle, with Friday’s candle closing cleanly above the descending trendline that has capped price for weeks.
For me, this breakout is the first proper confirmation that the primary bullish trend is resuming.
The next major resistance on the chart sits around 4,246 – a key level I’m watching as a trend-confirmation line.
If price can break and hold above 4,246, the path towards the higher zone around 4,580 opens up, in line with the Fibonacci extension drawn on the chart.
In short: the structure into next week is bullish, with pullbacks seen as opportunities to position for a potential move towards new highs.
2. Technical structure – from breakout to extension targets
The breakout from the triangle comes after a sequence of higher lows bouncing off the rising trendline, indicating accumulation rather than distribution.
Below price, we have demand zones clustered around the 4,110 trendline area and deeper supports near 4,040 and 3,920.
Above price, the roadmap is fairly clear:
First, a test of 4,246 (local resistance & former supply).
Then the ATH / prior high region around 4,360–4,380.
Finally, the Fibonacci 1.618 extension projects into the 4,560–4,580 zone, which is my medium-term upside objective if bulls can maintain control.
As long as daily structure keeps printing higher highs and higher lows and price stays above the key invalidation at 3,996, I will continue to treat gold as buy-on-dip rather than looking for major tops.
3. Key zones & trading ideas for next week
I’m not treating this as a signal service, but here’s how I’m mapping the chart for my own trading:
Primary idea – Buy the dip into trendline / support
Watch zone: around the rising trendline near 4,110.
If price pulls back into this area early in the week and shows a clear rejection on H4/D1 (wick rejections, bullish engulfing etc.), I’ll be interested in building long positions.
Upside path:
First objective: 4,246 – trend-confirmation resistance.
If broken and retested from above, the next leg could extend towards 4,360–4,380.
Extension target: 4,560–4,580 in line with the 1.618 Fibonacci projection.
Secondary idea – Using Fibonacci zones on break above 4,246
If gold breaks and holds above 4,246, the Fibonacci zones between roughly 4,360 and 4,580 become interesting for scaling in / managing positions:
Partial profits or tight trailing stops can be considered as we approach 4,360–4,380.
Any healthy corrective pullback from that region that respects the rising structure could still offer add-on entries with the 4,580 zone as a medium-term target.
Invalidation:
A daily close below 3,996 would seriously damage this bullish structure and force me to reassess. Below that, I would step aside and wait for a new pattern rather than trying to force the long idea.
4. Fundamental backdrop – why gold still has a bid
From a macro point of view, gold is navigating a mix of:
Tariff and trade tensions, which keep hedging demand alive as investors look for protection against policy shocks.
Ongoing geopolitical risks and conflict, supporting gold’s role as a classic safe-haven asset.
A late-cycle interest-rate environment, where markets are increasingly focused on when and how aggressively central banks will adjust policy after a period of elevated rates and liquidity distortions.
This combination tends to limit the downside for gold: even when we see corrections, dip-buyers are never too far away, especially when the technical structure is aligned with the macro story.
5. Strategy & risk management
Into next week, my bias is clear: structure is bullish above 3,996, so I prefer buying pullbacks rather than trying to short into strength.
The trendline around 4,110 is my first area of interest for fresh longs; anything closer to 4,040–4,000 (if we see a deeper flush) would be considered an even better price, provided the daily structure doesn’t break.
As always, position sizing and stop placement are key – one good weekly move is far more valuable than several emotional entries trying to catch every candle.
What do you reckon – does this breakout have enough fuel to take us towards 4,580, or do you see a deeper correction setting up first? Feel free to share your view in the comments.

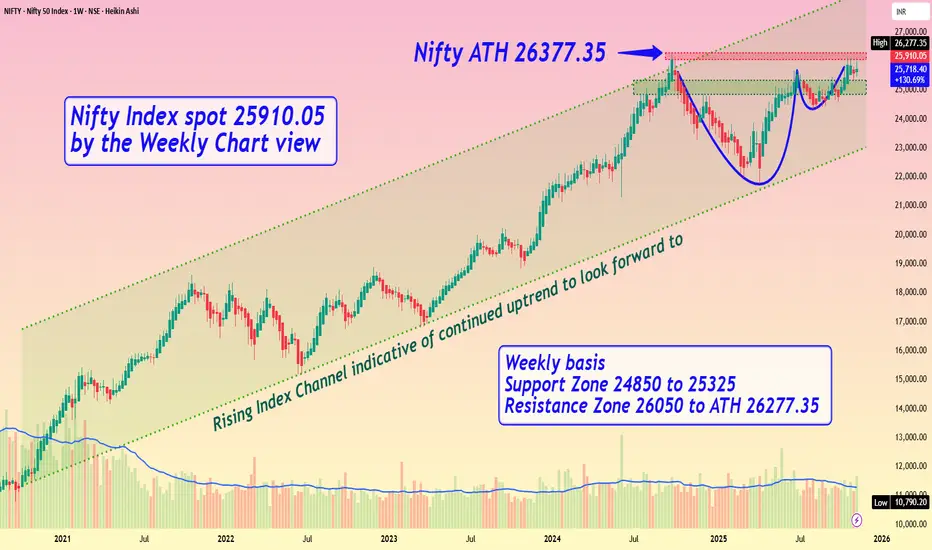
Nifty Index spot 25910.05 by the Weekly Chart viewNifty Index spot 25910.05 by the Weekly Chart view
- Weekly basis - Support Zone 24850 to 25325
- Weekly basis - Resistance Zone 26050 to ATH 26277.35
- Rising Index Channel indicative of continued uptrend to look forward to .....
- Bullish Cup and Handle pattern shows breakout expectation from Resistance Zone
Thyrocare – ATH Breakout With Exceptional Volumes | Retest OpporThyrocare is showing a textbook All-Time-High (ATH) breakout backed by unusually strong volumes, a classic signal of institutional participation.
After spending years in consolidation, the stock has finally broken above its previous resistance zone, indicating a potential start of a fresh trending phase.
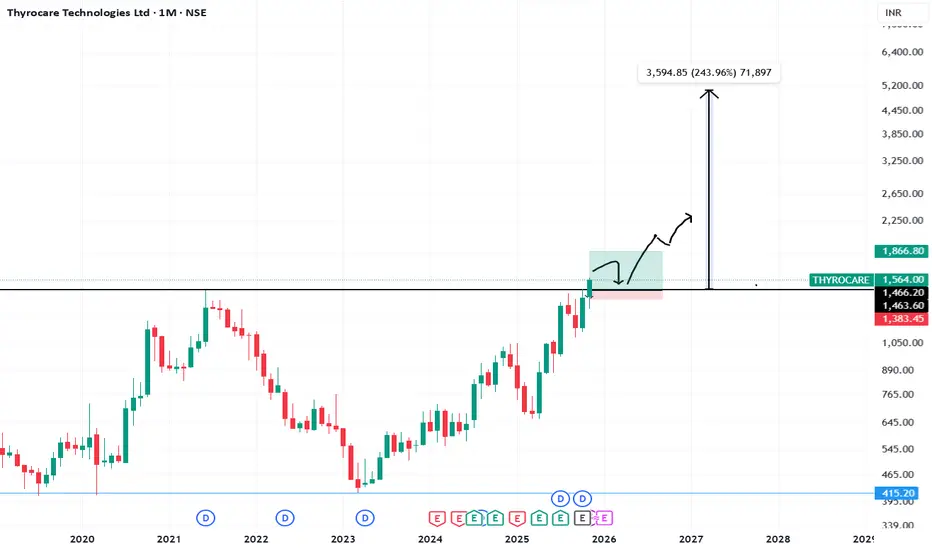
Thyrocare-A beautiful breakout is done!Thyrocare has given a good closing today above its previous ATH.
Stock has formed a beautiful rounding bottom pattern. Volumes buildup before breakout is decent as well.
Previously, i had covered Policybazar & Zomato with such patterns and they have given amazing returns.
Keep this stock in watchlist. This can give similar move as well.
Entering at ATH levels is tricky but these stocks come with excellent reward opportunity.
I am NISM certified RA and not SEBI registered.
This is not a recommendation but is shared for you to learn.

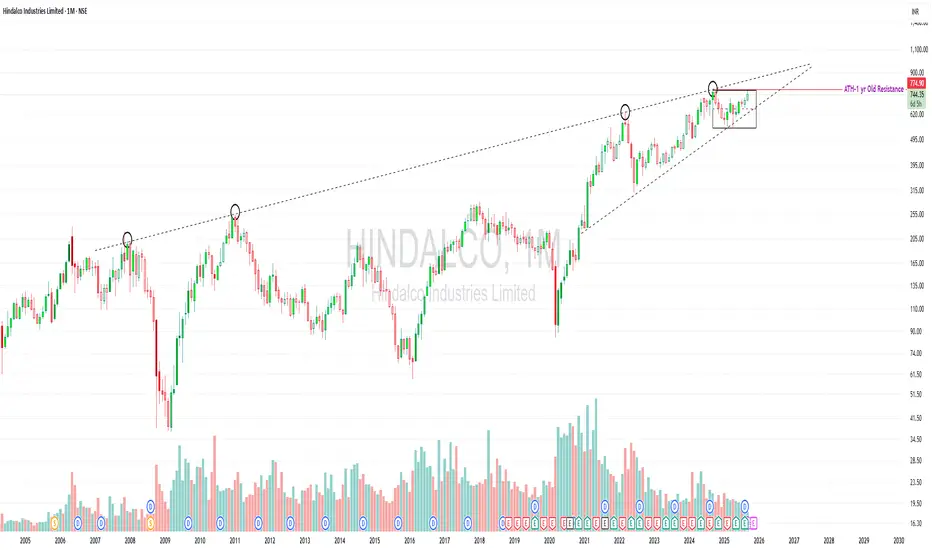
Hindalco – Monthly Chart | Educational View
Near ATH, testing a 20-year trendline — worth studying.
Price is trading inside a long-term rising wedge.
The upper trendline has acted as resistance multiple times (2007, 2011, 2022, and now).
Currently consolidating in a tight range near ATH (~₹775).
Volume needs improvement — a decisive breakout above resistance should ideally come with strong volume confirmation.
⚠️ Risks / Watch-outs:
Rising wedge patterns can also resolve downwards if breakout fails.
Repeated rejections from the same long-term trendline may trigger profit-taking.
Without big volume, any breakout attempt may not sustain.
💡 Learning Point: Long-term trendlines and volume behavior are crucial in studying potential breakouts vs. failed attempts.
⚠️ Disclaimer: This post is for educational purposes only. It is not a buy/sell recommendation or financial advice. Please do your own research or consult a SEBI-registered advisor before making investment decisions.
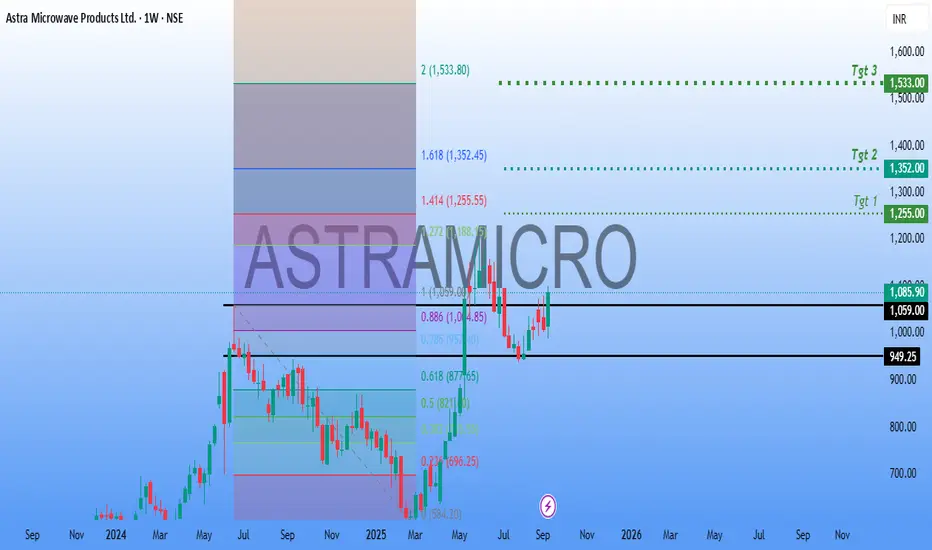
ASTRAMICROAnother #Defense #Stock in focus.
#ASTRAMICRO has a strong Technical Structure. Made a neat #breakout and consolidating at the Breakout levels.
Neat #Buyondips stock for #Short to #Longterm #Investment.
Targets in Chart.
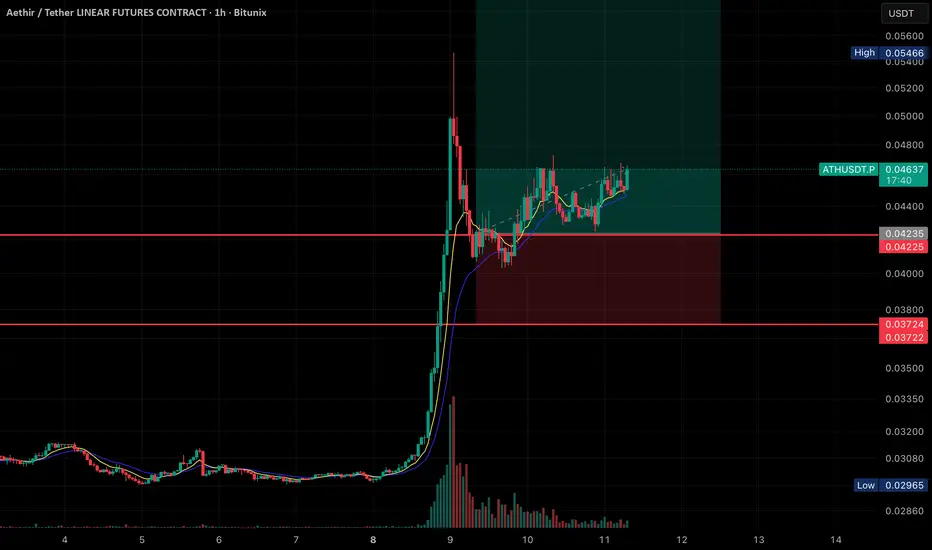
ATH/USDT Going for ATHHere’s the breakdown of what’s shown:
• Price Action:
The chart shows a massive spike in price on September 8th, followed by a retracement and consolidation phase.
Currently, the price is trading at 0.04634 USDT, with slight bullish movement (+1.58%).
• Indicators:
• Moving averages (likely EMA 9 & 21) are plotted, and the price is staying above them, showing bullish support.
• Volume spiked heavily during the breakout and has since decreased while consolidation is happening.
• Trade Setup (Highlighted Zone):
• Entry: Around the current price (0.0463 USDT).
• Stop Loss: Just below 0.0422–0.0423 support zone.
• Target Zone: Extends upward past 0.054 (previous high), indicating a long trade setup with a good risk-to-reward ratio.
• Support & Resistance:
• Support 1: 0.04225 – 0.04235
• Support 2: 0.03722 – 0.03724
• Resistance: 0.05466 (recent swing high)
👉 Overall, this looks like a bullish continuation setup after a breakout, with price consolidating in a higher range before a possible push toward the recent highs
Silver Reversal In PlayLast trade delivered 12R.
Now positioned again in MCX:SILVERMIC1! .
Reversal signs clear, momentum building.
Risk defined, rules followed, no guessing.
Stops trail, trend decides.
Let’s see where this one runs.

Gold about To Fly! ATH soon!Gold has been In Consolidation for past 5 Months.
4 occasions when it had settled near 3300.
It's about time for Gold to take Shorts For Cleaners?
This time around it's about to Settle near 3400.
3420 3440 will be Crucial for Bears to Defend if they wish to hold grip over this Consolidation.
Longs will get aggressive above 3440 3450 Targeting 3550 3750
😲
A prolonged consolidation could continue in case 3420 shows Profit Booking
For time Being 3375 3350 looks like providing support.
If it continues to Hold then it may build the Bull Case

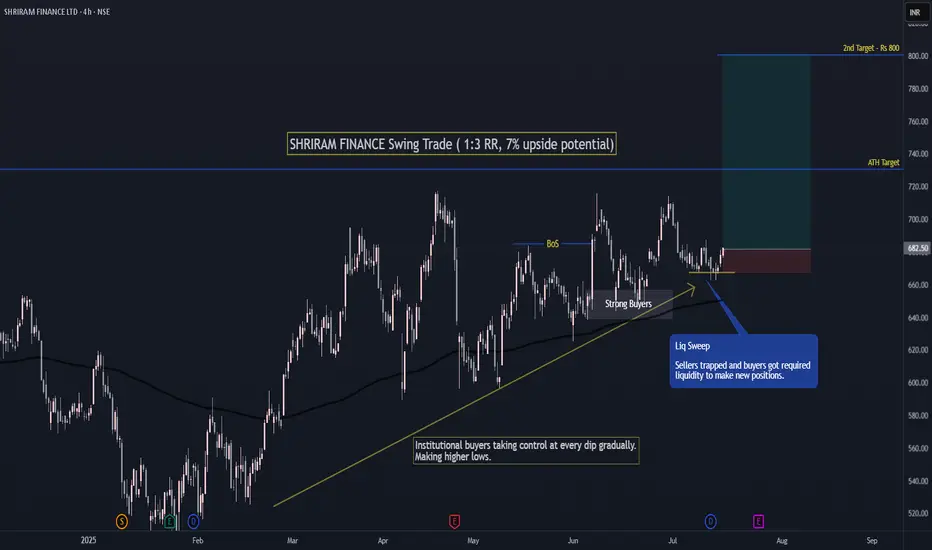
SHRIRAM FINANCE Swing Trade ( 1:3 RR, 7% upside potential)1st Target at ATH with 1:3 RR and 7% upside.
2nd Target at psychological level of 800.
If Nifty holds current level of 25000 then Shriram Finance can make a new ATH.
Institutions have gradually bought the stock at every dip making higher lows continuously.
Recently sellers got trapped which can start a new up-move.
Follow me for more such simple trades.
TRANSRAIL LIGHTING (BREAKOUT)ATH Breakout
Point To Note
- Price Breakout Above Key ATH Resistance
- Supporting Upward Trendline
Wait For Retest
Next Possible Resistance
-759
-802
-854
Till Then Stay Focused, Keep Following Markets

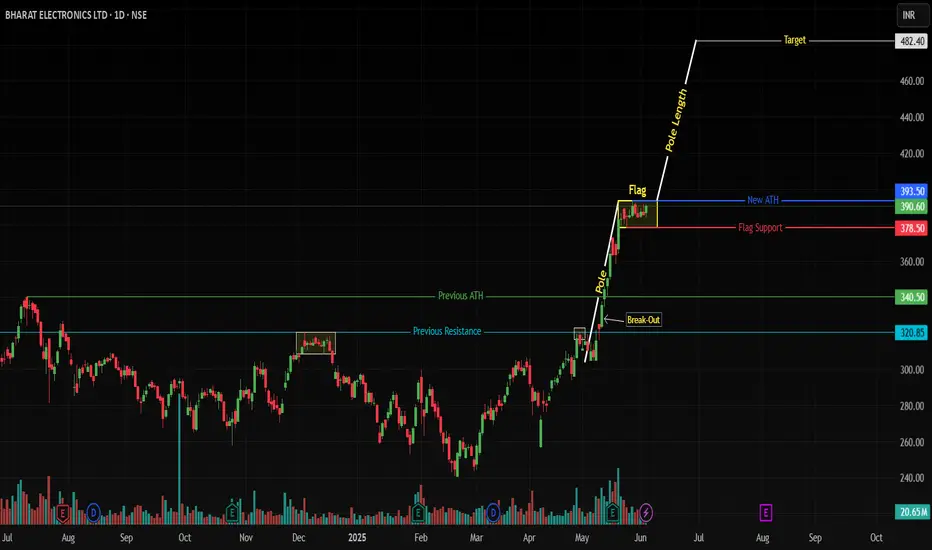
How to Trade ATH Stocks: Harness Explosive Trends with ADX !(BEL Case Study)
NSE:BEL (Daily) - Bull Flag at All-Time Highs
📈 Key Observations
ATH Breakout Confirmed:
Price smashed through ₹340.50 previos ATH, hitting a historic high of ₹393.50.
Consolidation in a tight bull flag (₹378.50–393.50) after a 28.97% surge – classic bullish continuation setup.
ADX: Your Trend Compass 🧭
ADX at 43.95 signals a powerful, directional trend (Readings >25 = strong trend; >40 = explosive momentum).
Ignore oscillator noise: Trends trump RSI/MACD in parabolic moves.
Pattern > Oscillators:
Bull Flag Priority: The pattern’s integrity (lower volume consolidation) outweighs short-term RSI(79)/MACD wobbles.
🚀 Trade Strategy: Trend-First Framework
✅ Entry & Targets
Trigger: Daily close above ₹393.50 (flag resistance).
Add: Retest of ₹393.50 as support.
Targets:
Short-term: ₹420 (5% above ATH)
Measured Move: ₹482 (ATH + pole height: 393.50 + 88.20)
⚔️ Stop-Loss
Conservative: ₹378.50 (flag low breach).
Aggressive: ₹385 (tight stop, honors consolidation structure).
📊 Position Sizing
Risk ≤1% capital per trade.
Reward/Risk Ratio: 4:1 (₹482 target vs. ₹378.50 stop).
💡 Why ADX Trumps RSI/MACD at ATHs
RSI/MACD are lagging in strong trends:
RSI overbought ≠ reversal – it’s fuel for momentum stocks.
MACD crosses often "whipsaw" in high-ADX environments (BEL’s ADX >40 invalidates bearish MACD signals).
ADX is proactive:
"Trends persist until ADX rolls below 30" – Focus on price, not oscillator fears.
🌐 Sector & Fundamental Tailwinds
Defense Sector Strength: India’s capex boost; BEL’s order book increasing.
Institutional Conviction: FIIs increasing stake.
🛡️ Risk Management Checklist
✅ Trade only on confirmed close above ATH.
✅ Use ADX >40 as a momentum green light.
✅ Trail stops at 20-DMA (₹365) once +10% profit.
Chart Markup:
Blue line: Bull flag Resistance at ₹393.50.
Red Line: Bull Flag Support ₹378.50
ADX(14) subchart with 40+ threshold highlighted.
💎 Final Thought: ATH breakouts are trend accelerators, not tops. BEL’s bull flag + ADX >40 frames a high-probability continuation play. Stick with the trend until ADX says otherwise.
Boost this idea if you’re tracking BEL’s breakout!
Follow for high-probability ATH trade setups.
⚠️ Disclaimer
"This is NOT financial advice. Trade at your own risk. Past performance ≠ future results. Always conduct independent research and consult a SEBI-registered advisor. The author holds no position in BEL at time of publication."
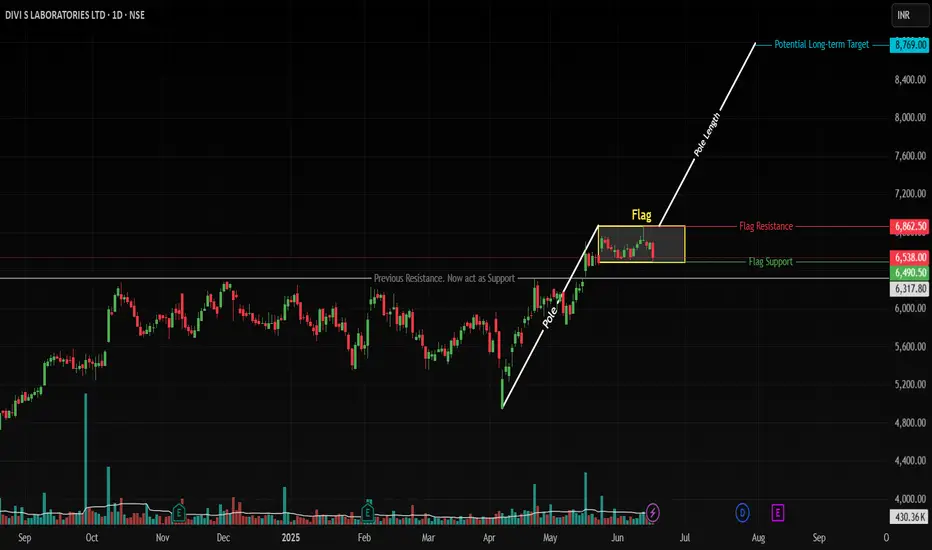
DIVISLAB: Flag & Pole Breakout Setup Targets New ATHsNSE: DIVISLAB | Pharmaceuticals | Large Cap | Updated: June 17, 2025
📊 Technical Structure
Pole Formation: Rally from 4,955 → 6,862 (1,907 points) on high volume
Flag Consolidation: Tight range between 6,490 (support) and 6,800 (resistance)
Key Breakout Trigger: Daily close above 6,862 (ATH)
Pattern Target: 8,769 (6,862 + 1,907 pole length)
Critical Support: 6,300 (confirmed swing low)
🎯 Price Targets & Roadmap
Immediate Target: 7,200 (2024 swing high)
Strong Resistance Zone: 7,600-7,750 (analysts ceiling)
Pattern Target: 8,769 (100% pole extension)
Confirmation Required for 8,769:
• Breakout volume >650K (20% above 20D avg)
• Pharma sector PE >42 (currently 39.2)
⚡ Trade Strategy
Scenario 1: ATH Breakout (Preferred)
Entry: Daily close above 6,862 (6,880-6,900 zone)
Targets:
• 7,200 (book 30% profits)
• 7,600 (book 50% profits)
• 8,769 (full exit)
Stop Loss: 6,700
Scenario 2: Flag Breakdown
Entry: 6,300-6,160 (50-DMA confluence)
Target: 6,800 flag retest → 7,200
Stop Loss: 6,050
Risk Management Essentials: Max 2% capital per trade
⚖️ Fundamental Drivers
Strengths:
• 15.4% ROE (vs sector 12.1%)
• 17% EPS growth (FY26E)
• FII holdings ↑2.1% YoY to 18.01%
Risks:
• High PE 79.2 (sector 39.2)
• Overbought risk above 7,600
⚠️ Critical Risks
Valuation Risk: Profit-booking likely near 7,600
Sector Risk: Pharma index seasonality (+4.91% avg June)
📉 Real-Time Levels
Current Price: ₹6,538 (-2.24% today)
Support: 6,490 (flag base) → 6,300 (swing flip)
Resistance: 6,800 (flag top) → 6,862 (ATH)
Volume Alert: Breakout requires >650K shares
✅ Conclusion
DIVISLAB offers a high-reward setup with defined risk parameters. The flag breakout above 6862 is the preferred play, backed by sector leadership and earnings growth. Always hedge with stops—overvaluation remains a concern.
📜 Disclaimer
This analysis represents my personal market view and not investment advice. Trading carries significant risk of capital loss. Past performance doesn't guarantee future results. Always:
Conduct your own due diligence
Consider your risk tolerance
Consult a SEBI-certified advisor
Verify real-time data before acting
Never risk more than you can afford to lose.
KIRIINDUS | Cup and Handle | Breakout |DailyHere’s a **short and sharp technical analysis** of **KIRI INDUSTRIES LTD (NSE: KIRIINDUS)**:
---
## 🔍 **KIRI INDUSTRIES LTD – Weekly Chart Overview**
* ✅ **Pattern**: *Massive Cup & Handle (Multi-year base)*
* 💥 **Breakout Level**: ₹673
* 📈 **Current Price**: ₹726.55
* 📊 **Volume**: Strong breakout volume
* 🎯 **Target**: ₹1,106 (63% upside based on pattern height)
* 🔽 **Support**: ₹673.50 (previous resistance turned support)
---
### 📌 **Trade View**
* **Bias**: **Bullish** – Long-term breakout from consolidation
* **Retest Buy Zone**: ₹680–₹700
* **Target**: ₹1,050–₹1,100
* **Stop Loss**: ₹673 (weekly close)
---
📢 *Multi-year breakout with strong momentum – ideal for positional holding.*

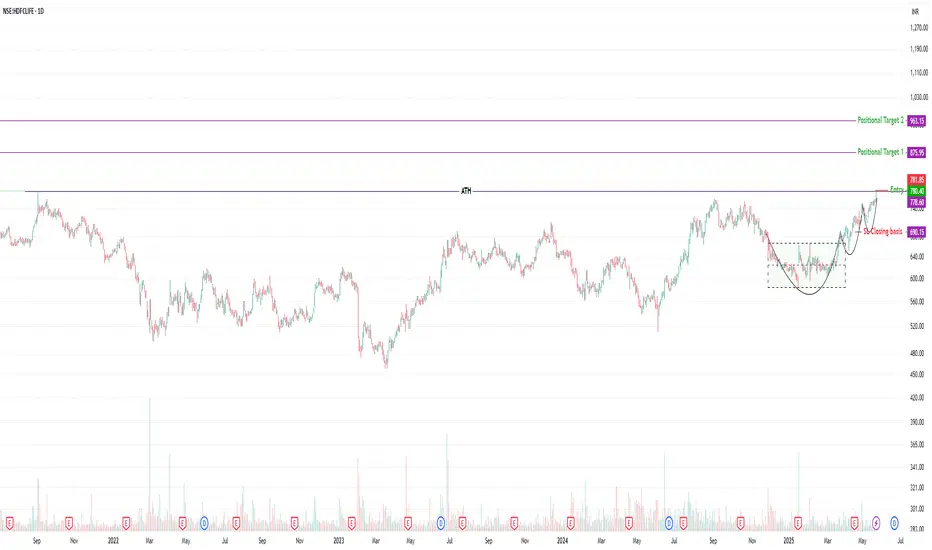
HDFC LIFE – VCP Breakout Setup | ATH ZoneHDFC LIFE – VCP Breakout Attempt | ATH Test After 44 Months
📈 Structure: Volatility Contraction Pattern (VCP)
📦 Base: Tight consolidation zone (rectangle)
📊 Trend: Higher Highs & Higher Lows
🟢 Volume: Gradually picking up
💥 Last Session: Wide range bullish candle
🔝 ATH Zone: Testing Sep 2021 high (44-month range)
📌 Price Action: Trading above Key DMAs
The stock formed a clean VCP structure with tight contractions and shallow pullbacks. It broke out from its recent base and is now testing the all-time high from Sep 2021, making this a high-stakes breakout watch.
Currently, it’s forming a breakout setup with entry above the previous day’s close — ideally confirming with more volume above ₹790.
📍 Trade Plan
Entry: 781.85
Stop Loss (Close Basis): 690.15
Target 1: 875.95
Target 2: 963.15
📊 Risk & Reward
Risk: 11.75%
Target 1: 12.02%
Target 2: 23.18%
RR to T1: 1 : 1.02
RR to T2: 1 : 1.97
⚠️ Risk Management Notes
Even though the structure is clean and momentum is building, risk remains high as the stock is trading at ATH levels — a zone where volatility can spike.
Always remember:
Protect capital first — never let a single trade ruin your portfolio
If it fails to hold above the breakout zone, pullbacks can be sharp
Don’t ignore market breadth and macro sentiment
Trade only with proper position sizing and SL discipline. If the breakout sustains with strength, this could enter a strong trend — but risk-reward must justify the trade.
📌 This is not a buy/sell recommendation. Just a technical view for educational purposes.
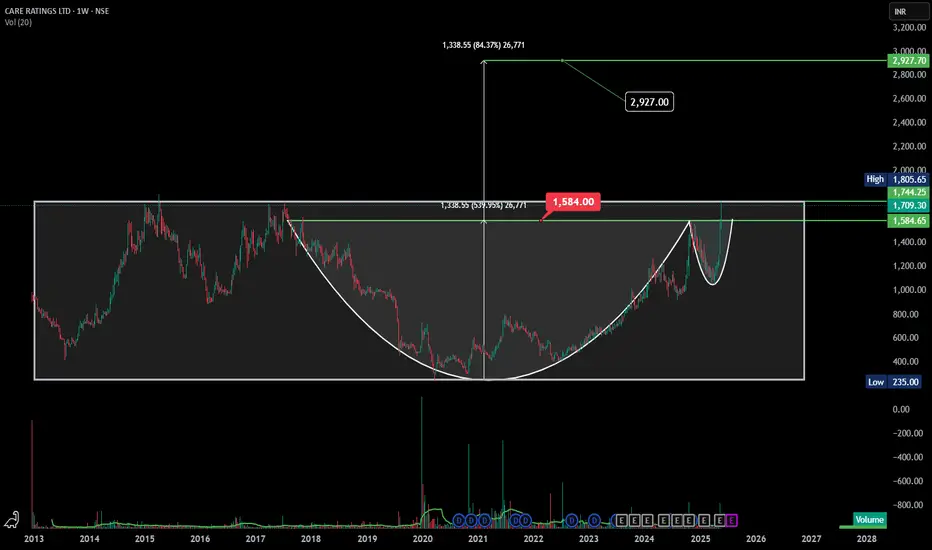
CARERATING ATH Breakout | Cup & Handle Pattern - ₹2927 Here’s the **technical analysis** for **CARE Ratings Ltd (NSE: CARERATING)**
---
### 📊 **Technical Analysis – CARE Ratings Ltd (Weekly Time Frame)**
#### ✅ **Pattern Identified: Cup and Handle Breakout**
* A **multi-year Cup and Handle pattern** has completed.
* Price broke out **above the neckline/resistance zone of ₹1584**, confirming the bullish breakout.
* This breakout follows a prolonged accumulation and consolidation phase from **2018 to 2023**, which adds to its reliability.
---
### 📈 **Breakout Details:**
* **Breakout Level (Neckline):** ₹1584
* **Current Price (May 25, 2025):** ₹1709.30
* **Target (Pattern Projection):** ₹2927
* **Measured Move:** ₹1338.55 (Cup depth) projected above breakout level
* **Potential Upside:**+84% from breakout point
---
### 🔎 **Volume & Momentum:**
* **Volume Surge** confirms buying interest and institutional accumulation.
* Recent breakout candle shows strong bullish momentum with a close well above the resistance.
* The **handle portion** formed a tight consolidation, suggesting reduced selling pressure.
---
### 🟢 **Support Levels:**
* **Major Support:** ₹1584 (previous resistance turned support)
* **Secondary Support:** ₹1350 zone (handle low)
---
### 🚨 **Resistance Levels:**
* **Immediate Resistance:** ₹1745–₹1800 zone (short-term supply zone)
* **Major Resistance:** None until the projected target of ₹2927
---
### 📌 **Conclusion:**
CARE Ratings has given a **textbook Cup & Handle breakout** on the weekly chart with high volume and strong price action. The pattern suggests **long-term bullish potential**, making it a **strong candidate for swing or positional trading**. Traders may watch for a **retest of ₹1584** for low-risk entry opportunities.
---
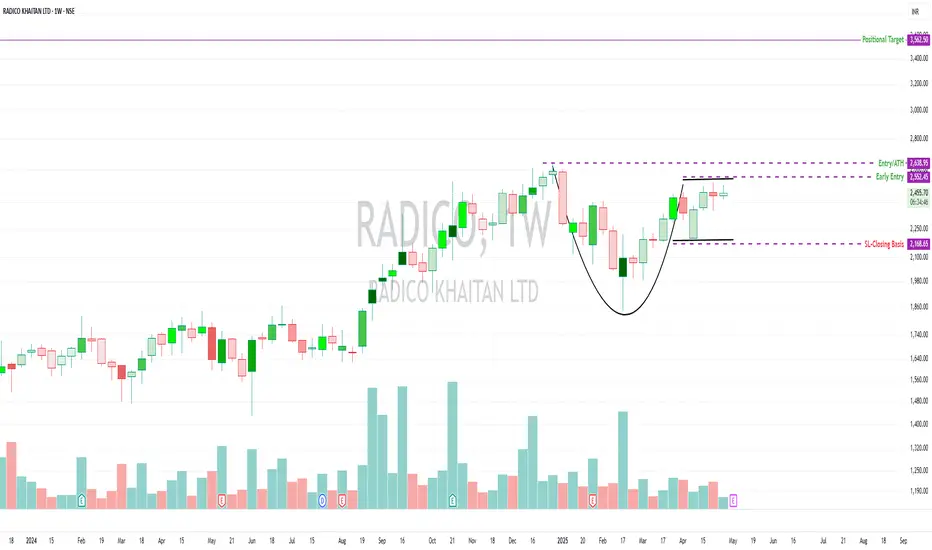
RADICO – Cup Base Forming | Testing Waters, No Diving Yet📈 RADICO – Cup Base Forming | Testing Waters, No Diving Yet
RADICO is forming a classic cup base on the weekly chart, trading above key DMAS with improving structure and RSI strength. A pilot entry to test the strength of the setup — not a full position.
🔍 Technical Overview
🟢 Structure: Well-formed cup attempting a neckline test
⚠️ Volume: Currently drying up — wait for breakout + volume spike
📍 Entry: Early Pilot Entry t at ₹2,552.45
✅ Add only if ATH breaks (₹2,638.95) with a clean weekly candle and volume confirmation
⚖️ Risk Management
❌ SL is deep (~15%) — manage position sizing carefully
💡 Expect shakeouts — volatility remains elevated
🧠 This is a positional pick, not a short-term play
🔄 Risk: Reward planned near 1:2, but no hard target in the current market volatility
⚠️ Macro Context
Nifty 500 is still below its 200 DMA
The market is not fully out of danger
Be nimble, not aggressive
🧠 Final Thoughts
Test the setup, don’t commit fully yet
Let volume confirm — breakout without power = trap risk
Trade as per your style
Risk management isn’t optional — it’s survival
📉 Disclaimer:
This is not investment advice. For educational purposes only. Do your own research and manage capital based on your strategy.
Manappuram Finance - Trade Setup📊 Trade Plan:
Entry: Above ₹215 if broken out with volume.
Stop Loss: ₹192.95 (Closing basis).
Target: Watch price action near ₹231 (ATH); safe traders wait for a daily close above it.
Position Sizing: Buy in small quantities and accumulate gradually.
📈 Why This Stock?
Technical Setup:
Trading above key DMAs (Daily Moving Averages).
Stock was in an uptrend (June-Aug 2022) but fell out of the channel and gapped down significantly (Oct 24, 2022).
Now recovering and trading near ATH (₹231), forming another channel.
Entry possible above ₹215 if broken with volume.
Watch for ₹231 breakout with volume (4-year trading range).
Finance index has broken out of base and is trading above key DMAs.
⚠️ Market Conditions & Risks:
We are trading against the trend (LL-LH structure).
The overall market is below the 50 & 200 DMA, indicating potential further dips.
Trades are more prone to failure unless the market structure changes.
Safe traders should wait for confirmation before entering.
📊 Fundamentals (Key Data)
Market Cap: ₹18,107 Cr
Current Price: ₹214
52-Week High/Low: ₹230 / ₹138
Stock P/E: 9.21
ROCE: 13.8%
ROE: 20.6%
🚨 Disclaimer:
⚠️ This is not financial advice. We are trading against the broader trend, meaning the risk of failure is high. Do your own analysis before taking any trade. Always manage risk and trade cautiously! 🚀

Cords Cables-Can it continue to be a multibagger?Cords Cables is a small cap company which is available at a perfect position technically.
Zone of 140-150 was a supply zone earlier which now should become a demand zone.
If stock manages to bounce from here with good volumes, it can continue its multibagger journey towards big targets.
However, if this zone is breached, stock can fall rapidly so it sis make or break level for stock technically.
Very risky. Keep in watchlist to study and learn.
Not a recommendation.

ZENSAR ATH BREAKOUTZensar, 840, gave all time high breakout after multiple attempts. Volumes are supporting. Strong results are backing the stock. Buy with small stop of 815-820 for 880/920/950/1120. Stock also gave breakout of Inverse H&S pattern.

RGL Global Ltd. Base Breakout!Analysis of Renaissance Global Ltd (RGL)
Technical Overview:
Base Breakout: Immediate resistance at ₹217.62.
Safe Traders: Wait for the ₹217–₹218 level to break with high volume and a strong Wide Range Candle (WRC) for confirmation.
Entry Level: ₹205.77.
Stop Loss (SL): ₹179.27 (12.88%).
Target 1 (T1): ₹251.60 (+22.28%).
Target 2 (T2): ₹297.10 (+44.45%).
Risk-Reward (R:R): 1:1.73 for T1, 1:3.45 for T2.
Technical Highlights:
Volume: Significant increase, indicating accumulation.
RSI: Gaining strength, showing bullish momentum.
Fundamental Overview:
Market Cap: ₹1939 crore.
P/E Ratio: 26.2 (compare with sector P/E for evaluation).
ROCE: 8.25%, reflecting mediocre efficiency.
Fundamentals aren't highly attractive but technicals suggest good potential.
Key Risks:
Sector Comparison: Evaluate P/E and ROCE against industry peers.
Breakout Strength: Ensure price sustains above ₹217–₹218 with robust volume for safer entry.
Disclaimer:
This analysis is for educational purposes only and not financial advice. Trade based on your risk tolerance.
