EURUSD - 4H - SHORTFOREXCOM:EURUSD
Hello traders , here is the full multi time frame analysis for this pair, let me know in the comment section below if you have any questions, the entry will be taken only if all rules of the strategies will be satisfied. wait for more Smart Money to develop before taking any position . I suggest you keep this pair on your watchlist and see if the rules of your strategy are satisfied...
Keep trading
Hustle hard
Markets can be Unpredictable, research before trading.
Disclaimer: This trade idea is based on Smart money concept and is for informational purposes only. Trading involves risks; seek professional advice before making any financial decisions. Informational only!!!
AUDUSD

AUDUSD Buy Setup | Discount Zone Reaction + Trendline BreakBias: Bullish
Timeframe: 15M
Pair: AUDUSD
Market Structure & Context
AUDUSD has completed a corrective move within a descending channel after a strong impulsive rally. Price has now reached a higher-timeframe discount zone, aligning with a rising trendline support, where we see clear signs of seller exhaustion.
Downside liquidity has been swept below recent equal lows, followed by strong bullish displacement, indicating potential smart money re-entry from discount.
Technical Confluence
Price reacting from HTF discount zone
Liquidity sweep below equal lows
Descending channel break attempt
Bullish structure shift on lower timeframe
Mean reversion setup targeting equilibrium & premium
Trade Plan
Entry:
Buy on confirmation above 0.66936
Stop Loss:
Below demand & trendline at 0.66728
Targets:
TP1: 0.6725 (Equilibrium)
TP2: 0.6742 (Mid supply)
TP3: 0.6765 (Premium zone / HTF resistance)
Risk–Reward
Approx 1:3.5 – 1:5 RR
Invalidation
Strong close below 0.66728 invalidates bullish bias
Notes
Patience is key. Best entries occur after structure confirmation, not blind buying. This setup favors New York session expansion if DXY weakens.

AUD/CAD Approaching Support: Strong Bounce IncomingAUD/CAD has finished a strong 5-wave move to the upside, completing Wave (1)/(A). Since then, price has been moving in a corrective channel and is now forming an A-B-C decline toward the lower support zone. The current structure suggests one more push down to complete Wave C of (2)/(B), where buyers are likely to step back in. Once that final dip finishes, the chart expects a powerful Wave (3)/(C) rally to the upside, targeting new highs. In simple terms: small drop left → correction ends → strong bullish continuation ahead.
Stay tuned!
@Money_Dictators
Thank you :)

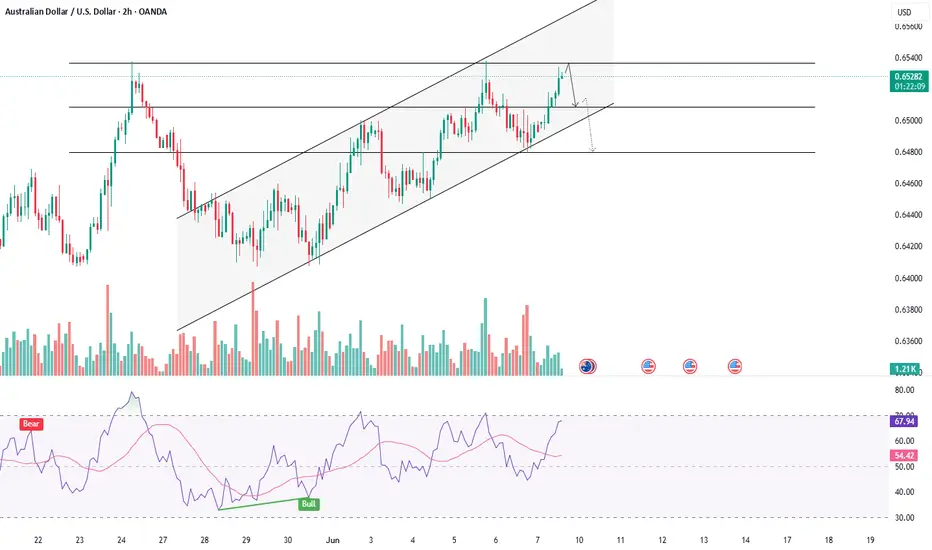
AUDUSD BREAKS CHANNEL RESISTANCE - TREND SHIFT AHEAD?Symbol - AUDUSD
AUDUSD is undergoing a corrective phase after breaking above the resistance of the descending channel. The market now requires consolidation or the formation of a trading range above 0.6525 to sustain bullish momentum.
The US dollar remains in a consolidation phase and shows limited potential for further appreciation. Mounting pressure ahead of the upcoming Federal Reserve meeting may act as a supportive factor for the Australian dollar.
The pair is transitioning into a distribution phase following a period of consolidation. The breakout above 0.6525 confirmed a breach of the descending channel’s resistance, signaling the early stages of a potential trend reversal. Sustained price action above this level could pave the way for continued upside movement.
Resistance levels: 0.6567, 0.6610
Support levels: 0.6525, 0.6493
Currently, the pair is attempting to establish a shift in trend direction. The ongoing consolidation and distribution above the previously broken trendline are constructive signs. However, the formation of a defined trading range will be essential to confirm the establishment of a new local uptrend.

AUD/USD (3H)...AUD/USD (3H) chart, here’s a breakdown of what I see and how the target can be projected:
---
🧠 Pattern Analysis
My identified a Cup and Handle pattern, which is a bullish continuation setup.
Cup low: around 0.6450
Cup rim (resistance / breakout level): around 0.6580 – 0.6590
Current price: ~0.6585 (right around the breakout level)
Handle: short pullback, touching near Ichimoku cloud support — healthy structure before potential breakout.
---
🎯 Target Projection (Cup & Handle Rule)
Cup and Handle target = Breakout level + Depth of the cup
Depth of cup:
0.6585 (rim) – 0.6450 (bottom) = 0.0135
Target = 0.6585 + 0.0135 = 0.6720
---
✅ Target Summary
Entry (breakout confirmation): above 0.6590
Target: 0.6720
Stop-loss: below 0.6535 – 0.6540 (below handle & cloud support)
Risk/Reward ratio: ~1:2.5
---
💡 Bonus Confirmation
Price is above the Ichimoku Cloud (bullish bias).
Handle retracement is shallow and respecting Tenkan/Kijun lines — typical of strong continuation setups.
Volume on breakout (watch for increase) would add confirmation.
---
Final Target: 0.6720 (main take-profit zone)

AUDUSD 15M IDEAFOREXCOM:AUDUSD
Hello traders , here is the full multi time frame analysis for this pair, let me know in the comment section below if you have any questions, the entry will be taken only if all rules of the strategies will be satisfied. wait for more Smart Money to develop before taking any position . I suggest you keep this pair on your watchlist and see if the rules of your strategy are satisfied...
Keep trading
Hustle hard
Markets can be Unpredictable, research before trading.
Disclaimer: This trade idea is based on Smart money concept and is for informational purposes only. Trading involves risks; seek professional advice before making any financial decisions. Informational only!!!

AUDUSD(20250912)Today's AnalysisMarket News:
U.S. initial jobless claims surged to 263,000 in the week ending September 6, reaching a near four-year high. Traders are fully pricing in three Federal Reserve interest rate cuts by the end of 2025.
Technical Analysis:
Today's Buy/Sell Levels:
0.6636
Support and Resistance Levels:
0.6712
0.6683
0.6665
0.6607
0.6588
0.6560
Trading Strategy:
If the price breaks above 0.6665, consider a buy entry, with the first target at 0.6683.
If the price breaks below 0.6636, consider a sell entry, with the first target at 0.6607.

AUDUSD(20250911)Today's AnalysisMarket News:
The U.S. PPI annual rate for August hit 2.6%, the lowest since June. Traders are increasing bets on a Fed rate cut.
Technical Analysis:
Today's bull/bear range:
0.6608
Support and resistance levels:
0.6664
0.6643
0.6629
0.6587
0.6573
0.6553
Trading Strategy:
If the price breaks above 0.6629, consider buying, with the first target at 0.6643.
If the price breaks below 0.6608, consider selling, with the first target at 0.6587

AUDUSD(20250908)Today's AnalysisMarket News:
Non-farm payroll growth fell significantly short of expectations, with June's data revised downward to negative territory, marking the first contraction since 2020. The unemployment rate hit a nearly four-year high.
Technical Analysis:
Today's buy/sell levels:
0.6548
Support and resistance levels:
0.6633
0.6601
0.6580
0.6515
0.6494
0.6463
Trading Strategy:
On a breakout above 0.6580, consider a buy entry, with the first target at 0.6601.
On a breakout above 0.6548, consider a sell entry, with the first target at 0.6515

AUDUSD-ShortAUD/USD 15m Chart Update
1️⃣ HTF Resistance
Price has reached a higher-timeframe resistance zone.
This is an important supply area where sellers may step in.
2️⃣ Bearish Order Block (OB)
A bearish order block is formed just below the resistance.
Price tapped into this OB and showed rejection with red candles.
3️⃣ Volume Analysis
The recent upmove happened with less volumes, showing weak buyer interest.
Sellers gaining strength near resistance is a bearish signal.
Market showing signs of rejection from resistance + bearish OB.
Unless strong buying volume comes in, we may see further downside pressure.
🔹 Entry Zone: Around the Bearish Order Block (0.6548 – 0.6555)
🔹 Stop Loss: Above HTF Resistance (0.6560)
🔹 Target 1: 0.6530
🔹 Target 2: 0.6515 (extended target if momentum continues)
Reasoning: Price rejected from HTF Resistance. Bearish OB showing supply zone. Weak volumes in the upmove = less buyer strength.
Plan: Wait for pullback to OB zone → Short entry → Trail stop once Target 1 is achieved.

AUDUSD(20250904)Today's AnalysisMarket News:
① Waller: I believe we should cut interest rates at the next meeting. Multiple rate cuts are possible in the future, but the exact pace depends on the data.
② Musallem: Current interest rates are appropriate, but there are risks in the job market.
③ Bostic: Concerned about inflation, I still believe one rate cut this year is appropriate.
④ The Federal Reserve will hold a payments innovation conference on October 21st, which will discuss stablecoins, artificial intelligence, and tokenization.
⑤ Fed Governor nominee Milan: If confirmed, I will maintain the independence of the FOMC.
⑥ Kashkari: There is room for a modest rate cut.
⑦ The Federal Reserve Beige Book: Economic activity is roughly flat, with businesses and households feeling the impact of tariffs.
Technical Analysis:
Today's Buy/Sell Levels:
0.6532
Support and Resistance Levels:
0.6584
0.6564
0.6552
0.6512
0.6499
0.6480
Trading Strategy:
If the price breaks above 0.6552, consider entering a buy position, with the first target price at 0.6564.
If the price breaks below 0.6532, consider entering a sell position, with the first target price at 0.6512

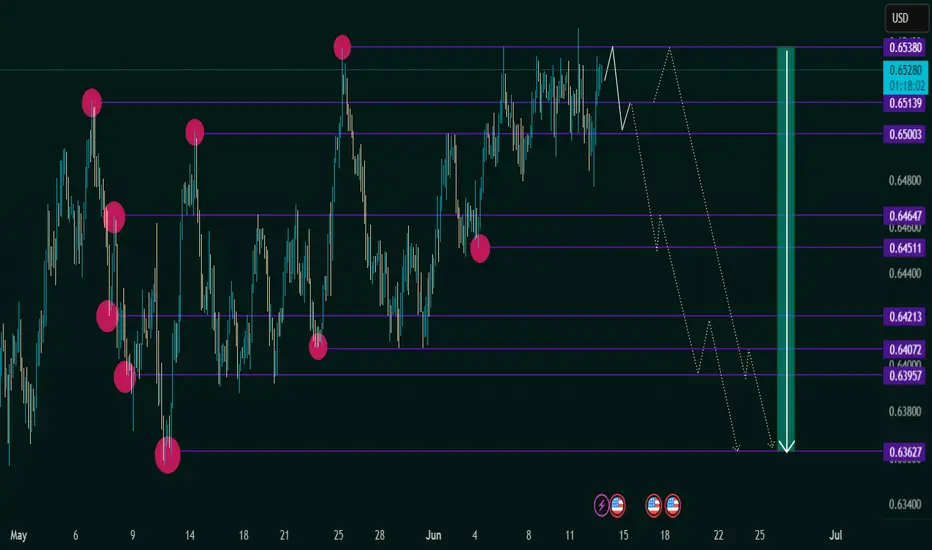
AUD/USD at Critical Resistance — Bearish Outlook Below 0.65381. Major Resistance Zone: 0.65380
Price is currently testing a strong horizontal resistance level at 0.65380, a level that has been tested multiple times (as shown by the pink circles).
This level has acted as a historical turning point, which increases its significance.
2. Price Structure: Lower Highs and Equal Highs
The chart reveals a potential double top or distribution pattern, forming under the 0.65380 resistance.
This suggests weakening bullish momentum and increases the probability of a bearish reversal.
3. Projected Bearish Path (White Dotted Lines):
If price fails to break above 0.65380 decisively, the expected move is a stepwise decline.
The projected path targets several support levels:
0.65003
0.64647
0.64213
0.63957
Final target: 0.63627, a key support from early May.
4. Support & Resistance Zones:
Resistance Levels:
0.65380 (Major)
0.65003
Support Levels (Sequential Targets):
0.64647
0.64213
0.63957
0.63627
5. Confluence with Fundamentals:
U.S. economic events (highlighted at the bottom with calendar icons) may act as volatility triggers, potentially accelerating this move.
✅ Summary & Trading Implications:
Bias: Bearish below 0.65380
Trade Idea: Watch for rejection at resistance or break below 0.65003 for confirmation.
Bearish Targets: Gradual move toward 0.63627 with key pauses at intermediate support levels.
Invalidation: Daily close above 0.65380 would negate the bearish setup and open potential for new highs.
AUDUSD - TESTING KEY RESISTANCESymbol - AUDUSD
CMP - 0.6530
AUDUSD continues to advance amid persistent uncertainty surrounding the US dollar, which remains in a consolidation phase. The currency pair is approaching a key resistance level at 0.6537
The dollar is currently range-bound due to prevailing market indecision. In contrast, the Australian dollar is gaining strength and appears poised to test a significant liquidity zone.
Within the context of the prevailing trend, the pair is progressing toward both resistance and the identified liquidity area. Given the considerable distance from the initial opening, the potential for continued upside may diminish as the pair nears its target. A false breakout above 0.6537 could signal the onset of a corrective pullback.
Resistance level: 0.6537
Support levels: 0.6509, 0.6480
A swift movement toward resistance without sustained bullish momentum could result in a false breakout at 0.6537 Should the price consolidate below this threshold, a corrective phase may follow before any potential resumption of the upward trend.
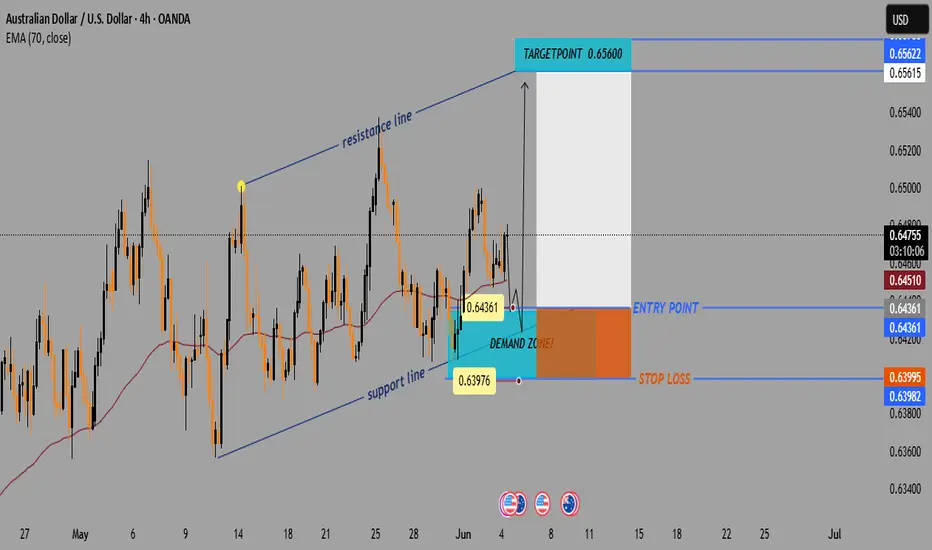
AUD/USD Bullish Setup: Demand Zone Bounce Toward 0.65600📈 Price Channel Analysis
🔼 The pair is moving within an ascending channel: • Support Line 🟦 – lower trendline showing bullish structure
* Resistance Line 🟥 – upper boundary acting as potential target
💡 This suggests bullish momentum is intact unless the price breaks below support.
📌 Key Trade Levels
🔵 Entry Point: 0.64361
* 👇 Positioned just above the DEMAND ZONE
* 📍Near the 70 EMA — a key dynamic support
🟨 Demand Zone: Area between 0.6400 – 0.6436
* 🧲 Buyers are expected here
* Good spot for a bullish entry
🔴 Stop Loss: 0.63995
* 🚨 Below the demand zone = limited risk
🟢 Target Point: 0.65600
* 🎯 Aligned with the upper resistance line
* Nice upside potential
⚙️ Technical Indicator
📉 EMA 70 (red line) = 0.64510
* Price is bouncing near it
* 📊 Acts as trend support — confirming buy idea
📊 Risk-to-Reward Ratio
🔻 Risk: ~36 pips (Entry → Stop Loss)
🔺 Reward: ~124 pips (Entry → Target)
✅ R:R Ratio ≈ 3.4:1 👍
🧠 Trade Idea Summary
📘 Trade Type 🔼 Buy (Long)
💰 Entry 0.64361
🛑 Stop Loss 0.63995
🎯 Target 0.65600
🌟 Bias Bullish
🔍 Final Thoughts
✅ Strong setup within a bullish channel
📉 EMA support + 🟦 Demand zone = Good confluence
📅 Watch out for USD news (see icons below chart)
AUDUSD Bullish Breakout and Retest Setup (2H Timeframe)🧾 Pair: AUDUSD
Timeframe: 2-Hour
Bias: Bullish
Strategy Type: Breakout + Retest + Imbalance Fill + Supply Targeting
📊 Market Structure Analysis:
AUDUSD was consolidating in a range for several days between approximately 0.6380 and 0.6435.
A clean bullish breakout has now occurred, breaking above the resistance zone around 0.6435–0.6440.
Price is retesting the broken resistance, which aligns with a fresh demand zone (newly formed OB).
A minor imbalance below price is being tested as price retraces, creating a healthy structure for a potential continuation move.
The target zone is a higher timeframe supply zone (~0.6525–0.6535), which has not been tested recently and offers clean RR.
📍 Key Levels:
Demand Zone (Entry Area): 0.6440 – 0.6428
Imbalance Fill Support: 0.6428
Target Supply Zone: 0.6525 – 0.6535
Current Price: 0.6445 (hovering around entry zone)
🎯 Trade Plan:
Entry: 0.6440 (after confirmation of bullish rejection from demand zone)
Stop Loss: 0.6420 (below imbalance + invalidation of bullish order block)
Take Profit: 0.6527 (prior supply zone)
Risk-to-Reward (R:R): ~1:4
✅ Confluences Supporting the Setup:
✅ Breakout of Consolidation Range (classic breakout structure).
✅ Retest of previous resistance as support, confirming the breakout.
✅ Newly formed bullish OB in the retest zone.
✅ Imbalance zone below adds magnetism and builds confluence.
✅ Clear upside target at clean supply (unmitigated).
✅ Momentum candle breakout suggests strong bullish intent.
⚠️ Invalidation Criteria:
If price breaks and closes below 0.6420, the bullish structure is broken.
Be cautious around high-impact USD news (NFP, FOMC, CPI), which could cause liquidity spikes.
💡 Pro Tip:
If unsure about direct entry, look for 15M–1H bullish CHoCH (change of character) or bullish engulfing candle confirmation in the OB zone for a lower-risk entry.
📘 Summary:
Direction: Long
Zone of Interest: 0.6440 – 0.6428 (demand + OB)
Target: 0.6525 – 0.6535 (clean HTF supply)
Risk-Reward: Excellent (1:4+)

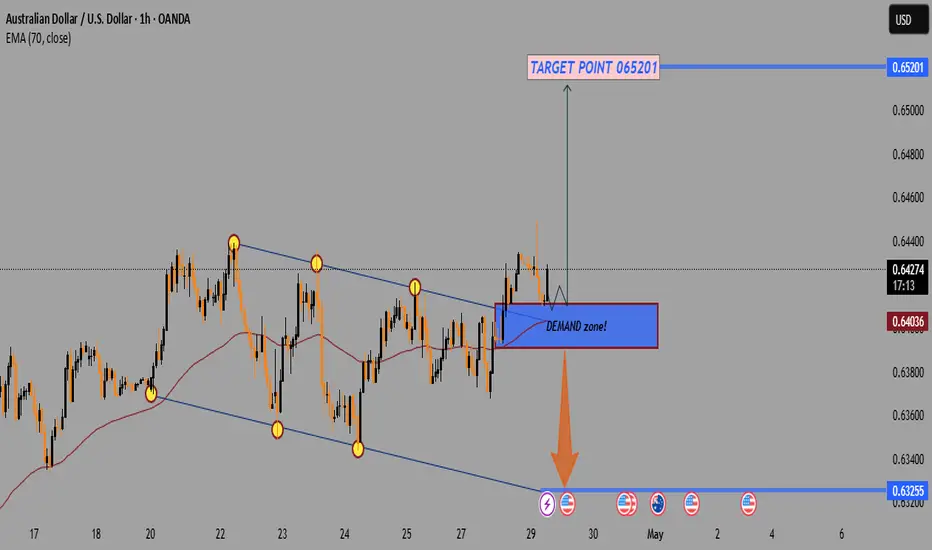
AUD/USD Bullish Breakout – Demand Zone Retest Before Targeting 📉 Chart Pattern:
🔻 Formed a descending wedge/channel pattern (yellow dots).
💥 Recently broke out upward — this is typically a bullish signal!
📦 DEMAND Zone (Support):
📘 Blue box labeled “DEMAND zone!” shows a strong area of buyer interest.
🔁 Price is currently retesting this zone — a healthy move after breakout.
✅ Holding this zone could confirm bullish continuation.
🎯 Target Point:
🚀 Marked at 0.65201 — labeled "TARGET POINT 065201".
📏 Measured move suggests this is a realistic bullish price objective.
📊 Technical Indicator (EMA 70):
📉 The 70 EMA (red line) is at 0.64037.
✅ Price is above the EMA, signaling upward momentum.
Upcoming Economic Events:
⚠️ Multiple high-impact news events (USD and AUD flags) are scheduled around April 30 – May 2.
🌪️ Expect potential volatility — manage risk accordingly!
Summary:
✅ Bias: Bullish
🟢 Buy Opportunity: If price holds above demand zone.
🎯 Target: 0.65201
❌ Invalidation: Break below demand zone → support near 0.63255
"AUD/USD Reversal Setup – Short from Supply Zone!''🔹 Trend Overview:
Price was in a strong uptrend 🔼, forming higher highs and higher lows.
Key Zones:
🟦 Supply Zone (🔵 Resistance Area):
0.63803 - 0.64064
Price entered this zone and started to slow down ⏸️, showing signs of seller strength.
🔵🟤🟤🟤
📍Entry Point: 0.63803
This is where the short (sell) trade is planned.
✍️ "Let’s short it here!"
🚫 Stop Loss: 0.64064
Just above the supply zone to avoid false breakouts.
🛑 "If it goes here, we're out!"
🎯 Target Point: 0.62800
Previous support zone.
🟢💰🟢
💥 "This is where we take profit!"
Indicators:
📈 EMA (7) – Black line
Shows price momentum. Currently flattening ➡️, meaning bulls are losing steam.
Trade Idea Summary:
📉 Bias: Bearish (Short)
✅ Entry: 0.63803
🛑 Stop Loss: 0.64064
🎯 Target: 0.62800
⚖️ Risk/Reward Ratio: ~1:3.8 (Very solid!)
⏱️ Timing: Watching for signs of reversal before entering

AUD/USD) Resistance level pullback Short Read The ChaptianSMC Trading point update
analysis of the AUD/USD pair on the 2-hour timeframe, showing a possible bearish setup. Here's a breakdown of the idea behind it:
Key Observations:
1. Current Trend:
The pair was in an uptrend, as indicated by the rising channel (parallel trendlines). However, it has now broken out of that channel.
2. Resistance Level:
The price has reached a resistance zone around 0.64000, and it seems to be rejecting this level.
3. 2 Timeframe Demand Zone:
Around the 0.63300 – 0.63400 range, this area previously acted as a demand zone (support), and the chart suggests price might retest it.
4. Projected Move:
First, a pullback up into the resistance zone could occur.
Then a drop to the demand zone.
If the demand zone fails to hold, the price could head down toward the key support/FVG (Fair Value Gap) around 0.61000 – 0.61500.
5. EMA (200):
The 200 EMA is below the price, suggesting longer-term bullish pressure, but it's starting to flatten, which could signal weakness in the uptrend.
6. RSI Indicator:
RSI is around 52, showing neutral momentum—neither overbought nor oversold, allowing room for movement in either direction.
Mr SMC Trading point
---
Idea Summary:
The chart suggests a potential reversal from the uptrend into a downtrend, triggered by a failure to break above resistance. The two key targets for a bearish move are:
First: the 2TF demand zone
Final: the key support/FVG zone
Pales support boost 🚀 analysis follow)

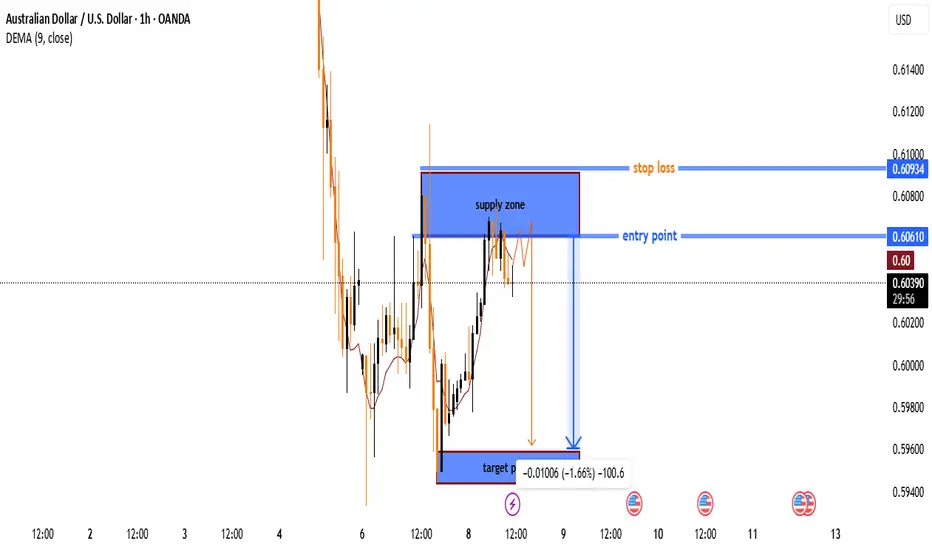
AUD/USD Supply Zone Rejection Trade Setup🔵 Supply Zone → (Blue highlighted area) The price is expected to reverse from here.
🔹 Entry Point → 0.60610 📍 (Marked with a blue line) The trade is planned to start here.
🟠 Stop Loss → 0.60934 ❌ (Marked with an orange line) If the price goes above this, the trade will be exited to prevent further loss.
🔻 Target Point → 0.59400 🎯 (Marked at the bottom) Expected profit zone if the trade moves as planned.
📉 Trade Plan:
✅ Short position (Sell trade) expected to drop from the supply zone.
🚀 Risk-to-reward ratio looks good as the potential profit is higher than the risk.
⚠️ Risk Factor: If price breaks above the supply zone, the setup might fail.
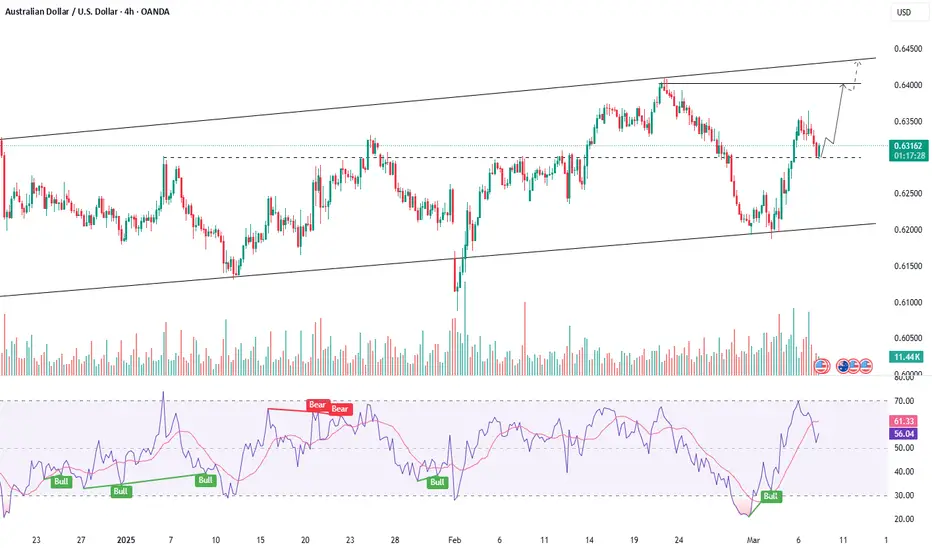
AUD/USD: Bullish Momentum Builds from Strong DemandIn the 4-hour AUD/USD chart, strong supply and demand zones are visible. A significant demand zone is observed around the 0.62269 level. Within the chart, a Change of Character (ChoCh) is identified from the 0.6323 level, and a Break of Structure (BoS) is noted at the 0.63211 level. A strong selling reaction has been observed from the supply zone, and the market has retested that level again.
On the demand side, the market has touched the strong demand zone twice and showed a bullish formation each time. Currently, the price is forming a strong bullish candle again.
Based on the Fibonacci levels, potential upside targets could be seen at 0.62717, 0.63128, and 0.63312, provided the market holds above the demand zone. However, if the demand zone is broken, there is a possibility of the market dropping down to 0.61901 .

AUDUSD - SELL - Wave 5 - Elliott wave AUD/USD (Australian Dollar/US Dollar) is a major currency pair in the Forex market, representing the exchange rate between the Australian Dollar (AUD) and the US Dollar (USD). It is influenced by factors such as:
Commodity Prices: Australia is a major exporter of commodities like iron ore and gold, so AUD/USD is highly correlated with commodity price movements.
Interest Rate Differentials: The Reserve Bank of Australia (RBA) and the US Federal Reserve's interest rate decisions impact the pair significantly.
Market Sentiment: AUD is often seen as a risk-on currency, meaning it strengthens during times of global economic optimism and weakens during uncertainty.
US Economic Data: Since USD is the world's reserve currency, US economic indicators like inflation, employment, and GDP growth influence AUD/USD.
This pair is popular among traders due to its liquidity and volatility, making it a favorite for both short-term and long-term strategies. Are you currently trading AUD/USD, or just analyzing it?

AUDUSD - RETRACEMENT WITHIN UPTREND BEFORE FURTHER GROWTHSymbol - AUDUSD
CMP - 0.6302
AUDUSD pair, supported by a decline in the US dollar, holds significant potential for continued growth. However, given the upcoming NFP release today, Friday, the associated risks are heightened.
Currently, the currency pair is establishing a local uptrend, and in conjunction with the weakening dollar, the Australian dollar may sustain its strengthening trajectory. On the 4-hour chart, a local correction is developing towards an imbalance zone, with a strong support level at 0.6300 The price is displaying a false breakout, attempting to capture liquidity and subsequently consolidate at higher levels. Should the bulls successfully defend the 0.6300 – 0.6330 range, the price is positioned to maintain its upward momentum in both the short and medium term.
Key support levels: 0.6300, 0.6255
Key resistance levels: 0.6330, 0.6363
A consolidation above the 0.6300 level, followed by a sustained rise and consolidation above 0.6330, would confirm the bulls' intentions for further upward movement. However, with the NFP release and other significant economic data on the horizon, the risks are amplified, and elevated market volatility should be expected.
AUDUSD - SWING TRADE IDEA ON LONG SIDESymbol - AUDUSD
AUDUSD is currently trading at 0.6305
I'm seeing a trading opportunity on buy side.
Buying AUDUSD pair at CMP 0.6305
I will be adding more if 0.6270 - 0.6240 comes & will hold with SL 0.6215
Targets I'm expecting are 0.6360 - 0.6410 & 0.6450
Disclaimer - Do not consider this as a buy/sell recommendation. I'm sharing my analysis & my trading position. You can track it for educational purposes. Thanks!
