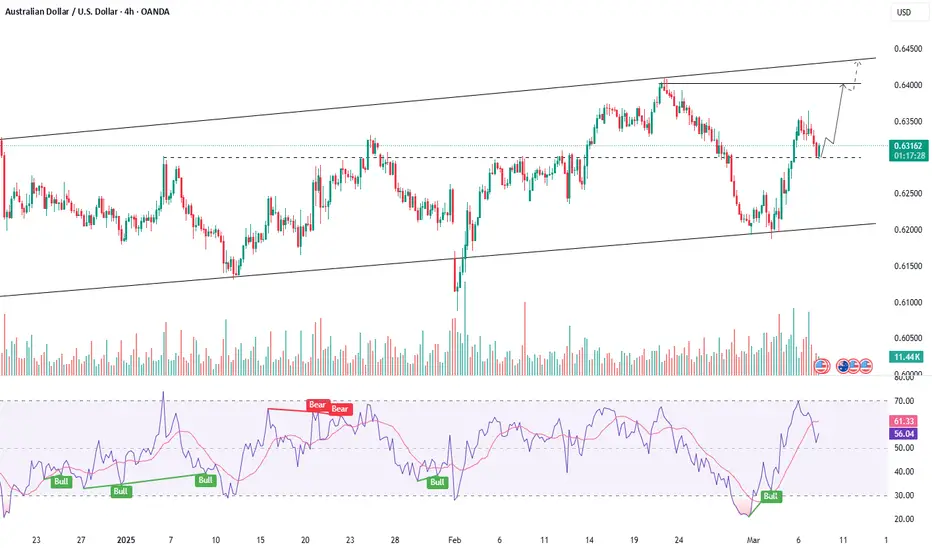
AUDUSD BREAKS CHANNEL RESISTANCE - TREND SHIFT AHEAD?Symbol - AUDUSD
AUDUSD is undergoing a corrective phase after breaking above the resistance of the descending channel. The market now requires consolidation or the formation of a trading range above 0.6525 to sustain bullish momentum.
The US dollar remains in a consolidation phase and shows limited potential for further appreciation. Mounting pressure ahead of the upcoming Federal Reserve meeting may act as a supportive factor for the Australian dollar.
The pair is transitioning into a distribution phase following a period of consolidation. The breakout above 0.6525 confirmed a breach of the descending channel’s resistance, signaling the early stages of a potential trend reversal. Sustained price action above this level could pave the way for continued upside movement.
Resistance levels: 0.6567, 0.6610
Support levels: 0.6525, 0.6493
Currently, the pair is attempting to establish a shift in trend direction. The ongoing consolidation and distribution above the previously broken trendline are constructive signs. However, the formation of a defined trading range will be essential to confirm the establishment of a new local uptrend.
Audusdanalysis

AUDUSD(20250912)Today's AnalysisMarket News:
U.S. initial jobless claims surged to 263,000 in the week ending September 6, reaching a near four-year high. Traders are fully pricing in three Federal Reserve interest rate cuts by the end of 2025.
Technical Analysis:
Today's Buy/Sell Levels:
0.6636
Support and Resistance Levels:
0.6712
0.6683
0.6665
0.6607
0.6588
0.6560
Trading Strategy:
If the price breaks above 0.6665, consider a buy entry, with the first target at 0.6683.
If the price breaks below 0.6636, consider a sell entry, with the first target at 0.6607.

AUDUSD(20250908)Today's AnalysisMarket News:
Non-farm payroll growth fell significantly short of expectations, with June's data revised downward to negative territory, marking the first contraction since 2020. The unemployment rate hit a nearly four-year high.
Technical Analysis:
Today's buy/sell levels:
0.6548
Support and resistance levels:
0.6633
0.6601
0.6580
0.6515
0.6494
0.6463
Trading Strategy:
On a breakout above 0.6580, consider a buy entry, with the first target at 0.6601.
On a breakout above 0.6548, consider a sell entry, with the first target at 0.6515

AUDUSD - TESTING KEY RESISTANCESymbol - AUDUSD
CMP - 0.6530
AUDUSD continues to advance amid persistent uncertainty surrounding the US dollar, which remains in a consolidation phase. The currency pair is approaching a key resistance level at 0.6537
The dollar is currently range-bound due to prevailing market indecision. In contrast, the Australian dollar is gaining strength and appears poised to test a significant liquidity zone.
Within the context of the prevailing trend, the pair is progressing toward both resistance and the identified liquidity area. Given the considerable distance from the initial opening, the potential for continued upside may diminish as the pair nears its target. A false breakout above 0.6537 could signal the onset of a corrective pullback.
Resistance level: 0.6537
Support levels: 0.6509, 0.6480
A swift movement toward resistance without sustained bullish momentum could result in a false breakout at 0.6537 Should the price consolidate below this threshold, a corrective phase may follow before any potential resumption of the upward trend.
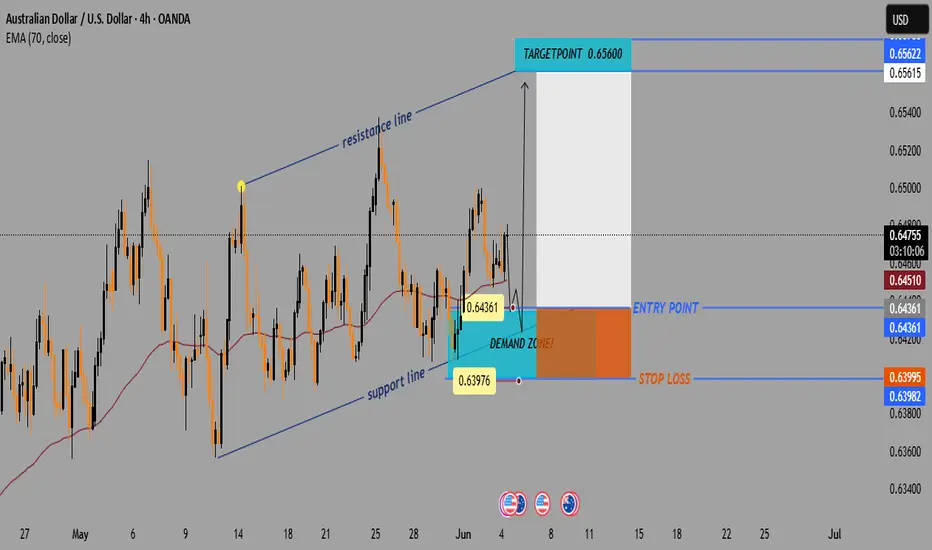
AUD/USD Bullish Setup: Demand Zone Bounce Toward 0.65600📈 Price Channel Analysis
🔼 The pair is moving within an ascending channel: • Support Line 🟦 – lower trendline showing bullish structure
* Resistance Line 🟥 – upper boundary acting as potential target
💡 This suggests bullish momentum is intact unless the price breaks below support.
📌 Key Trade Levels
🔵 Entry Point: 0.64361
* 👇 Positioned just above the DEMAND ZONE
* 📍Near the 70 EMA — a key dynamic support
🟨 Demand Zone: Area between 0.6400 – 0.6436
* 🧲 Buyers are expected here
* Good spot for a bullish entry
🔴 Stop Loss: 0.63995
* 🚨 Below the demand zone = limited risk
🟢 Target Point: 0.65600
* 🎯 Aligned with the upper resistance line
* Nice upside potential
⚙️ Technical Indicator
📉 EMA 70 (red line) = 0.64510
* Price is bouncing near it
* 📊 Acts as trend support — confirming buy idea
📊 Risk-to-Reward Ratio
🔻 Risk: ~36 pips (Entry → Stop Loss)
🔺 Reward: ~124 pips (Entry → Target)
✅ R:R Ratio ≈ 3.4:1 👍
🧠 Trade Idea Summary
📘 Trade Type 🔼 Buy (Long)
💰 Entry 0.64361
🛑 Stop Loss 0.63995
🎯 Target 0.65600
🌟 Bias Bullish
🔍 Final Thoughts
✅ Strong setup within a bullish channel
📉 EMA support + 🟦 Demand zone = Good confluence
📅 Watch out for USD news (see icons below chart)
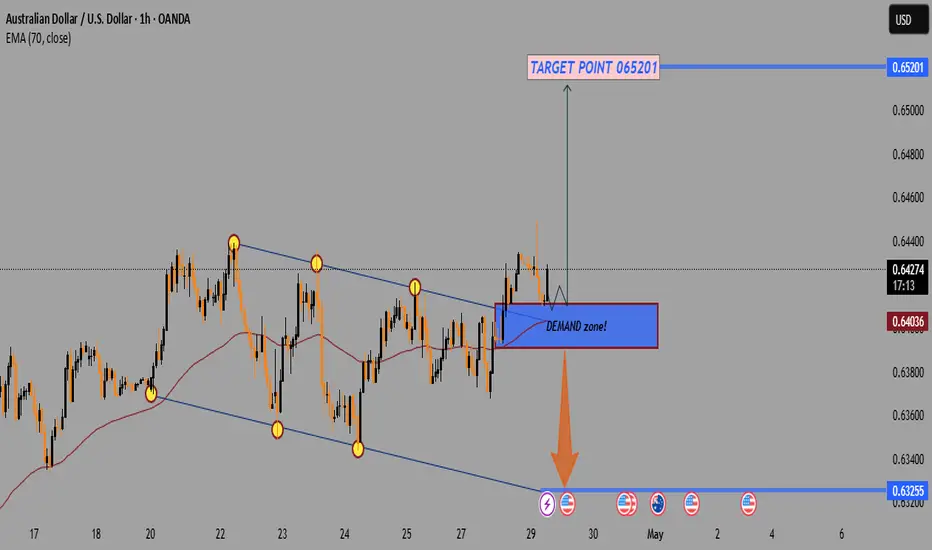
AUD/USD Bullish Breakout – Demand Zone Retest Before Targeting 📉 Chart Pattern:
🔻 Formed a descending wedge/channel pattern (yellow dots).
💥 Recently broke out upward — this is typically a bullish signal!
📦 DEMAND Zone (Support):
📘 Blue box labeled “DEMAND zone!” shows a strong area of buyer interest.
🔁 Price is currently retesting this zone — a healthy move after breakout.
✅ Holding this zone could confirm bullish continuation.
🎯 Target Point:
🚀 Marked at 0.65201 — labeled "TARGET POINT 065201".
📏 Measured move suggests this is a realistic bullish price objective.
📊 Technical Indicator (EMA 70):
📉 The 70 EMA (red line) is at 0.64037.
✅ Price is above the EMA, signaling upward momentum.
Upcoming Economic Events:
⚠️ Multiple high-impact news events (USD and AUD flags) are scheduled around April 30 – May 2.
🌪️ Expect potential volatility — manage risk accordingly!
Summary:
✅ Bias: Bullish
🟢 Buy Opportunity: If price holds above demand zone.
🎯 Target: 0.65201
❌ Invalidation: Break below demand zone → support near 0.63255
"AUD/USD Reversal Setup – Short from Supply Zone!''🔹 Trend Overview:
Price was in a strong uptrend 🔼, forming higher highs and higher lows.
Key Zones:
🟦 Supply Zone (🔵 Resistance Area):
0.63803 - 0.64064
Price entered this zone and started to slow down ⏸️, showing signs of seller strength.
🔵🟤🟤🟤
📍Entry Point: 0.63803
This is where the short (sell) trade is planned.
✍️ "Let’s short it here!"
🚫 Stop Loss: 0.64064
Just above the supply zone to avoid false breakouts.
🛑 "If it goes here, we're out!"
🎯 Target Point: 0.62800
Previous support zone.
🟢💰🟢
💥 "This is where we take profit!"
Indicators:
📈 EMA (7) – Black line
Shows price momentum. Currently flattening ➡️, meaning bulls are losing steam.
Trade Idea Summary:
📉 Bias: Bearish (Short)
✅ Entry: 0.63803
🛑 Stop Loss: 0.64064
🎯 Target: 0.62800
⚖️ Risk/Reward Ratio: ~1:3.8 (Very solid!)
⏱️ Timing: Watching for signs of reversal before entering

AUD/USD) Resistance level pullback Short Read The ChaptianSMC Trading point update
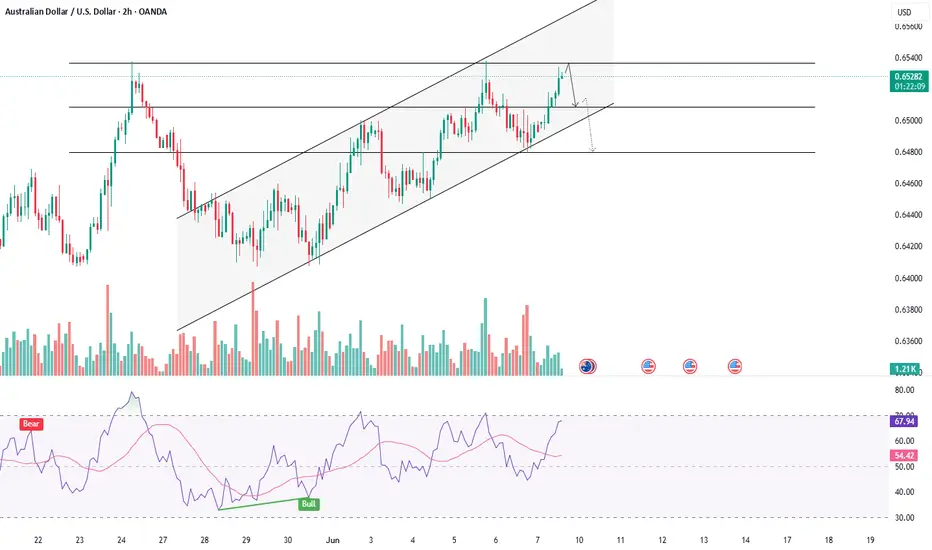
analysis of the AUD/USD pair on the 2-hour timeframe, showing a possible bearish setup. Here's a breakdown of the idea behind it:
Key Observations:
1. Current Trend:
The pair was in an uptrend, as indicated by the rising channel (parallel trendlines). However, it has now broken out of that channel.
2. Resistance Level:
The price has reached a resistance zone around 0.64000, and it seems to be rejecting this level.
3. 2 Timeframe Demand Zone:
Around the 0.63300 – 0.63400 range, this area previously acted as a demand zone (support), and the chart suggests price might retest it.
4. Projected Move:
First, a pullback up into the resistance zone could occur.
Then a drop to the demand zone.
If the demand zone fails to hold, the price could head down toward the key support/FVG (Fair Value Gap) around 0.61000 – 0.61500.
5. EMA (200):
The 200 EMA is below the price, suggesting longer-term bullish pressure, but it's starting to flatten, which could signal weakness in the uptrend.
6. RSI Indicator:
RSI is around 52, showing neutral momentum—neither overbought nor oversold, allowing room for movement in either direction.
Mr SMC Trading point
---
Idea Summary:
The chart suggests a potential reversal from the uptrend into a downtrend, triggered by a failure to break above resistance. The two key targets for a bearish move are:
First: the 2TF demand zone
Final: the key support/FVG zone
Pales support boost 🚀 analysis follow)

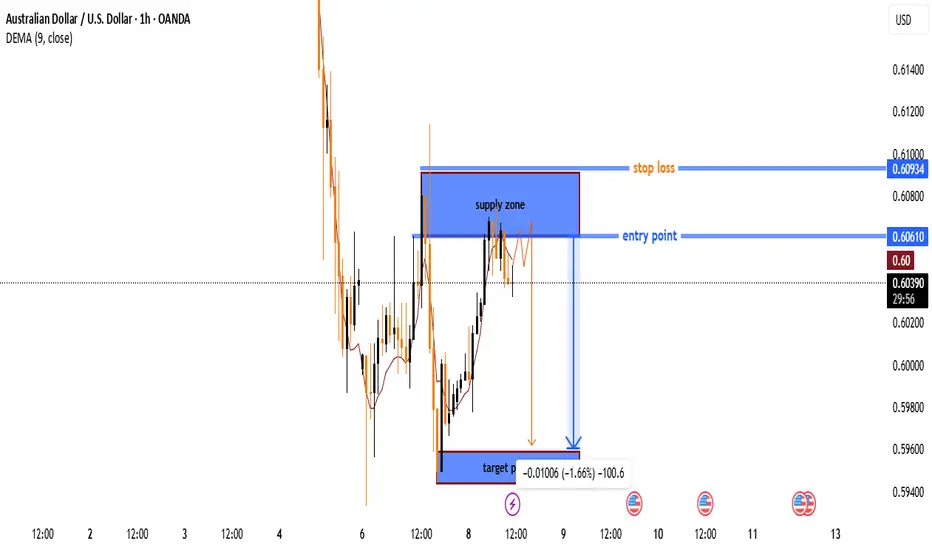
AUD/USD Supply Zone Rejection Trade Setup🔵 Supply Zone → (Blue highlighted area) The price is expected to reverse from here.
🔹 Entry Point → 0.60610 📍 (Marked with a blue line) The trade is planned to start here.
🟠 Stop Loss → 0.60934 ❌ (Marked with an orange line) If the price goes above this, the trade will be exited to prevent further loss.
🔻 Target Point → 0.59400 🎯 (Marked at the bottom) Expected profit zone if the trade moves as planned.
📉 Trade Plan:
✅ Short position (Sell trade) expected to drop from the supply zone.
🚀 Risk-to-reward ratio looks good as the potential profit is higher than the risk.
⚠️ Risk Factor: If price breaks above the supply zone, the setup might fail.
AUD/USD: Bullish Momentum Builds from Strong DemandIn the 4-hour AUD/USD chart, strong supply and demand zones are visible. A significant demand zone is observed around the 0.62269 level. Within the chart, a Change of Character (ChoCh) is identified from the 0.6323 level, and a Break of Structure (BoS) is noted at the 0.63211 level. A strong selling reaction has been observed from the supply zone, and the market has retested that level again.
On the demand side, the market has touched the strong demand zone twice and showed a bullish formation each time. Currently, the price is forming a strong bullish candle again.
Based on the Fibonacci levels, potential upside targets could be seen at 0.62717, 0.63128, and 0.63312, provided the market holds above the demand zone. However, if the demand zone is broken, there is a possibility of the market dropping down to 0.61901 .

AUDUSD - RETRACEMENT WITHIN UPTREND BEFORE FURTHER GROWTHSymbol - AUDUSD
CMP - 0.6302
AUDUSD pair, supported by a decline in the US dollar, holds significant potential for continued growth. However, given the upcoming NFP release today, Friday, the associated risks are heightened.
Currently, the currency pair is establishing a local uptrend, and in conjunction with the weakening dollar, the Australian dollar may sustain its strengthening trajectory. On the 4-hour chart, a local correction is developing towards an imbalance zone, with a strong support level at 0.6300 The price is displaying a false breakout, attempting to capture liquidity and subsequently consolidate at higher levels. Should the bulls successfully defend the 0.6300 – 0.6330 range, the price is positioned to maintain its upward momentum in both the short and medium term.
Key support levels: 0.6300, 0.6255
Key resistance levels: 0.6330, 0.6363
A consolidation above the 0.6300 level, followed by a sustained rise and consolidation above 0.6330, would confirm the bulls' intentions for further upward movement. However, with the NFP release and other significant economic data on the horizon, the risks are amplified, and elevated market volatility should be expected.
AUDUSD - SWING TRADE IDEA ON LONG SIDESymbol - AUDUSD
AUDUSD is currently trading at 0.6305
I'm seeing a trading opportunity on buy side.
Buying AUDUSD pair at CMP 0.6305
I will be adding more if 0.6270 - 0.6240 comes & will hold with SL 0.6215
Targets I'm expecting are 0.6360 - 0.6410 & 0.6450
Disclaimer - Do not consider this as a buy/sell recommendation. I'm sharing my analysis & my trading position. You can track it for educational purposes. Thanks!

Audusd Pullback It also means that should the US dollar continue to strengthen and the yuan weaken, AUD/USD runs the real risk of moving below 63c. The 10-day SMA is capping as resistance and makes a likely area for bears to reload, unless the Feed deliver a dovish surprise to send AUD/USD higher.

Audusd - 1 hr bullish trend Audusd rally now - 1 hr timeframe
Buy now at 0.64000
Target 0.64600++
Good luck...!

Audusd - 1 hr bullish trend Audusd rally now - 1 hr timeframe
Buy now at 0.64000
Target 0.64600++
Good luck...!

AUD/USD TRADE SETUP Yesterday AUD made it 3months low $0.64404 and today little bit positive but still making on daily time frame lower low . Aud will continue it’s downside move to $0.63000 .
Better stay away from aud trade or made short side positions till do not made higher high formation formations / closed above daily based higher to previous high .
Stay tuned with me for more updates:-

AUDUSD R:R 1:4Liquidity Sweep and CHoCH
Imbalance with FVG
Its tapped the Previous Unmitigated supply.
Its already created the EQL and TL Liquidity.
Once entered the Entry zone go with confirmation Entry with CHOCH.

BUY LONG AUDUSDLong position of AUDUSD as its at important support level touching the trendline where market has previously rejected and also having multiple wicks rejection making a strong support near trendline. Giving a buy/long opportunity on AUDUSD

AUDUSD 1D Timeframe ProjectionAUDUSD 1D Timeframe Projection.
Daily and Weekly trends are Bullish.
DISCLAIMER: All labelling and wave counts are done by me manually and I will keep changing according to the LIVE MARKET PRICE ACTION. So don't be bias, hope on my trade plans...try to learn, and make your strategy... Following is not that easy...

AUDUSD Idea H1Here is my analysis for AUDUSD on H1 using Order Block. The price could go bullish, you can put a pending order on the Order block or find an entry on LTF within OB Zone. Trade Safe!

AUSDUSD shortFOREXCOM:AUDUSD
Hello traders , here is the full multi time frame analysis for this pair, let me know in the comment section below if you have any questions, the entry will be taken only if all rules of the strategies will be satisfied. wait for more Smart Money to develop before taking any position . I suggest you keep this pair on your watchlist and see if the rules of your strategy are satisfied...
Keep trading
Hustle hard
Markets can be Unpredictable, research before trading.
Disclaimer: This trade idea is based on Smart money concept and is for informational purposes only. Trading involves risks; seek professional advice before making any financial decisions. Informational only!!!!

AUD/USD Trade Setup - AUD/USD is currently trading in a bearish trend
- AUD/USD correlates with gold as well
- GOLD is currently looking bearish as well

AUDUSD 4H outlookFOREXCOM:AUDUSD
Markets can be Unpredictable, research before trading.
Disclaimer: This trade idea is based on Smart money concept and is for informational purposes only. Trading involves risks; seek professional advice before making any financial decisions. Informational only!!!!
