Automotive Axles - ATH Breakout - Investment Ideas#Automotive Axles Limited - Technical Analysis
Current Price: 1,790.80
#Breakout & Retest = Opportunity
#Technical Setup
Strategy: Swing to Short Term Trade
✅ **ATH Breakout + Retest** - Successfully retested breakout zone
✅ **Higher High Formation** - Clear uptrend structure
✅ **EMAs Sorted** - Bullish alignment confirmed
✅ **Trendline Breakout** - Long-term resistance conquered
#Key Levels
Support: 1,520 (Tight SL) | 1,504 (Major support)
Swing Targets:
- T1: 2,078
- T2: 2,189
- T3: 2,284
Short-Term Targets:
- T1: 2,546
- T2: 2,800
- T3: 2,933
- Grand T4: 3,125
#tradesetup
Entry: Current levels (1,790 - 1,800)
Stop Loss: 1,520 (daily closing basis)
Risk-Reward: 1:3+ (excellent)
Timeframe: 2-6 months
Disclaimer: For educational purposes only. Not investment advice. Trading involves substantial risk. Consult a SEBI-registered financial advisor before making investment decisions. Past performance doesn't guarantee future results.
#AutomotiveAxles #SwingTrading #BreakoutTrading #TechnicalAnalysis #NSE #AutoStocks #ShortTermTrading #StockMarket #ATHBreakout #IndianStocks
Autosector

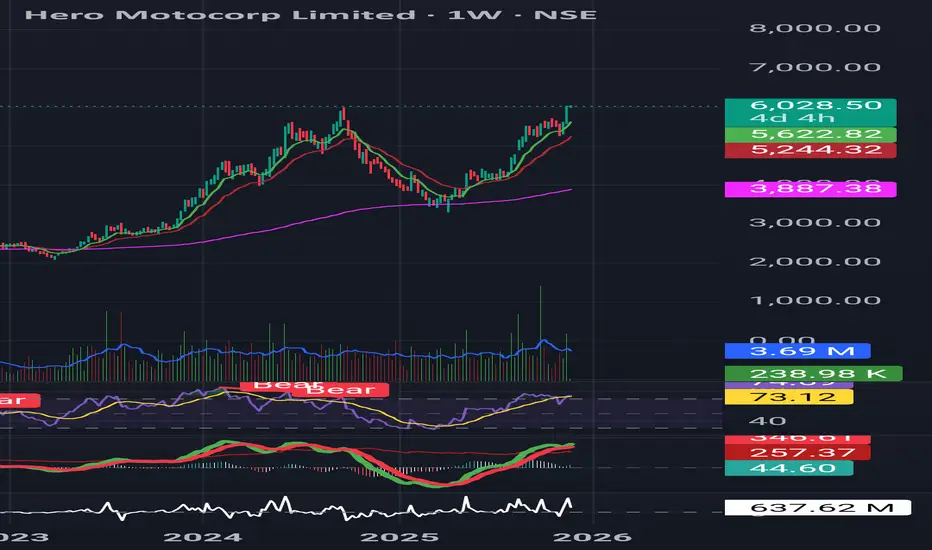
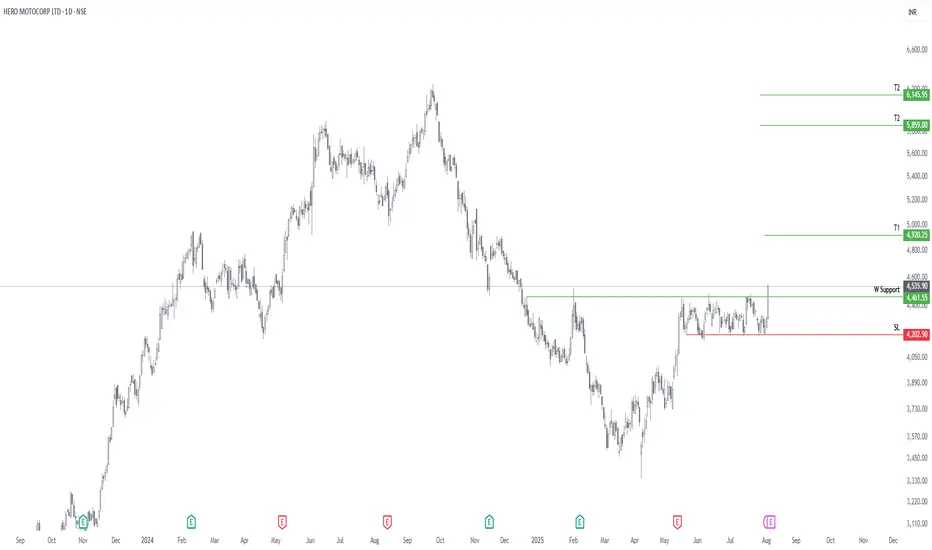
Hero MotoCorp — Saucer Continuation Pattern DevelopingHero MotoCorp is forming a saucer continuation structure on both daily and weekly charts.
Price is retesting the breakout zone around ₹6040 with low volume and small-bodied candles — a healthy momentum pause.
What’s strong:
• Trend intact (9/21/200 EMA rising)
• MACD bullish
• RSI holding strong despite flattening
• EFI above zero → buying pressure intact
• Weekly timeframe supports the same setup
Trade Plan:
• Entry: Close above ₹6040 with 2× volume
• SL: ₹5918 (ATR-based)
• Targets: ₹6442 → ₹6744
Trend remains bullish as long as price holds above 9/21 EMA.
BAJAJ AUTOHello & welcome to this analysis
The decline from September 2024 high till April 2025 low appears to be a 5 waves down impulse that I have marked as A of the corrective ABC wave.
The rise from April 2025 low till September 2025 high appears to be corrective ABC in structure.
If we consider the corrective as completion of B of ABC then the current decline would unfold into another 5 waves impulse down to complete C of ABC
If we consider the corrective as completion of (A) of B of ABC then the decline would pause between 8400 - 8000 to attempt another leg up within the corrective.
In either scenario a decline is likely coming as long as it stays below 9200
Conclusion
Short term weakness, investors/buyers should wait for proper structure to unfold before attempting longs
All the best

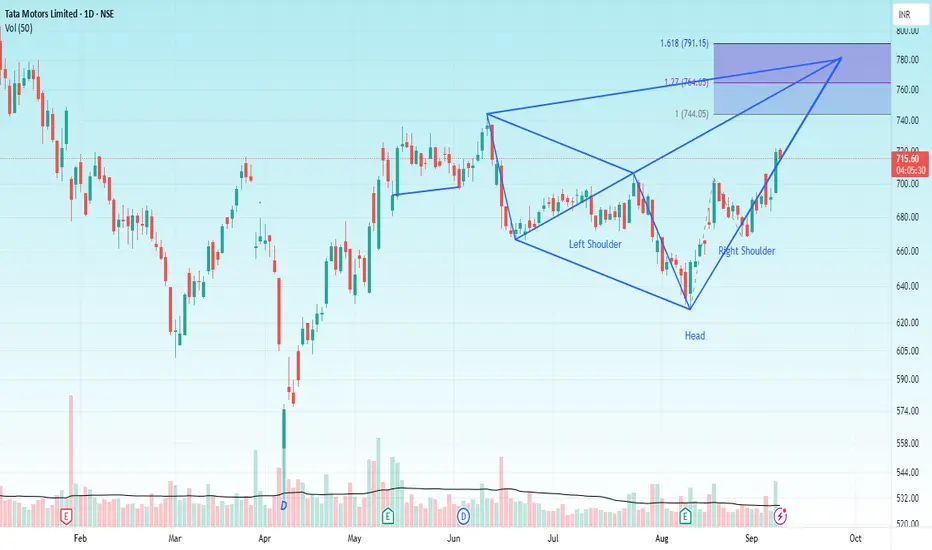
TATA MOTORS Hello & welcome to this analysis
The stock in daily time frame has given a double breakout
Inverse Head & Shoulder
Bullish Harmonic Seahorse
The upside levels as per IHS are 740 & 790 while the Seahorse pattern is indicating 775.
Both patterns have strong support at 690-700 and both would be considered invalid below 665
All the best
Nifty Auto Sector : A possible talk of the Town.The much talked sector of the Indian stock market is Automobile sector after the government slashed the GST rate from 28% to 18% for small cars and trimming effective tax on large engine SUVs.
Major gainer from the GST rate cuts were the companies dealing in passenger vehicles i.e. 4-wheeler & 2-wheeler.
1. Impact of rate cuts on Passenger Vehicles (2-wheelers)
a. Lower Price : India is a price sensitive market and the price cut will significantly boost the volumes as the entry level bikes and scooters will become affordable, a potential boost to the rural demand after a good monsoon this year.
b. Stock Makret reaction : HeroMoto Corp, Bajaj Auto and TVS Motors are the major beneficial of the GST reform. Analysts project mid to high sales growth in the 2-wheeler companies over the coming quarters as the sector will recover from the sluggish growth due to high inflation rate post-COVID .
c. Margin Expansion : Companies may pass most of the benefits to the consumers but could allow retention of a portion of the benefits, leading to improved Operating margins. Both demand boost and margin gains can be seen in premium models like Bajaj Pulsar, TVS Apache, Royal Enfield (Eicher Motors).
d. Impact on EV : EV scooters (Ola Electric, Ather, TVS iQube, Bajaj Chetak) already benefit from FAME-II subsidies. Now, with ICE two-wheelers getting cheaper, EV makers might face tighter price competition, but overall demand expansion will grow the entire category.
2. Impact of rate cuts on Passenger Vehicles (4-wheelers)
a. Price reduction fuels demand : GST cut on small cars, SUVs and large cars will reduce effective rate from 50%+ to around 40% making cars more affordable across segments, stimulating demand from middle class families as well as premium buyers.
b. Passenger Vehicles Boost : Maruti suzuki (small cars leader) is the biggest beneficiary as price sensitive buyers will return to showrooms. While M&M and Tata motors benefits from the SUVs, which remain the fastest growing category.
c. EV Four-Wheelers : GST cut makes ICE vehicles cheaper, but EVs (already taxed at just 5% GST) remain far cheaper on tax. Beneficiaries: Tata Motors (Nexon EV, Tigor EV), M&M (XUV400 EV, BE 6E, XEV 9E), Maruti (upcoming EVs).
3. Stocks and their YTD Returns
a. Hero Moto Corp (29.23%) : Dealing in 2-wheelers, the stock has giving good return and remain a hot stock as it had acquired 32.5% in Euler Motors, signaling entry into Electric 3-wheeler segment.
b. Bajaj Auto (4.18%) : Stock has delivered a Net profit of Rs. 2049 Crore (up~ 5.8%) while declaring a dividend too. The company has faces a potential "zero month" in August for EVs due to rare-earth magnet supply issues from China. Some brokerages remain neutral suggesting the stock is fully valued in the short term.
c. TVS Motors (46.78%) : Companies EV Expansion and its iQube saw 44% YoY growth. Company plans launching new EV Scooters and EV 3-wheelers.
d. Eicher Motors (36.47%) : Royal enfield recorded its highest quarter sale (~2.8 lakh units) and crossed 1 Million sales in FY25. Though, company will not be relaxed by the GST rate cuts as the premium Bikes (over 350 cc) will now be taxed 40% up from ~31%. Stock is creating new ATH high on the prospect of the Commercial vehicles as reduction of auto components costs by 7-8%. Better margins, improved volumes and healthy ROI in coming quarter, reinforces its growth outlook.
e. Maruti Suzuki (37%) : Maruti is the leading small car producers and will be the leading beneficial of the GST rate cut on small cars. The entry in the EV will also improve the company's portfolio and the upcoming festive season seeing the discounted rate of the GST may help boost the sales.
f. Tata Motors (-6.55%) : Company's outlook is mixed to cautiously optimistic, growth drivers include EV adoption and strong demand on the upcoming car models. Most analysts project modest upside in single digits.
g. Mahindra & Mahindra (19%) : Most beneficial of the GST rate as uniform rate of 40% across all SUVs, 18% on the small cars, 5% GST on tractor segment. The company has demonstrated impressive EV segment growth. The favorable GST reform, pent-up demand and strong booking will help company in good quarter numbers.
Indian Auto sector can be seen as a good sector to invest in for the upcoming quarter considering GST rate cuts, festive season demand and EV adoption.

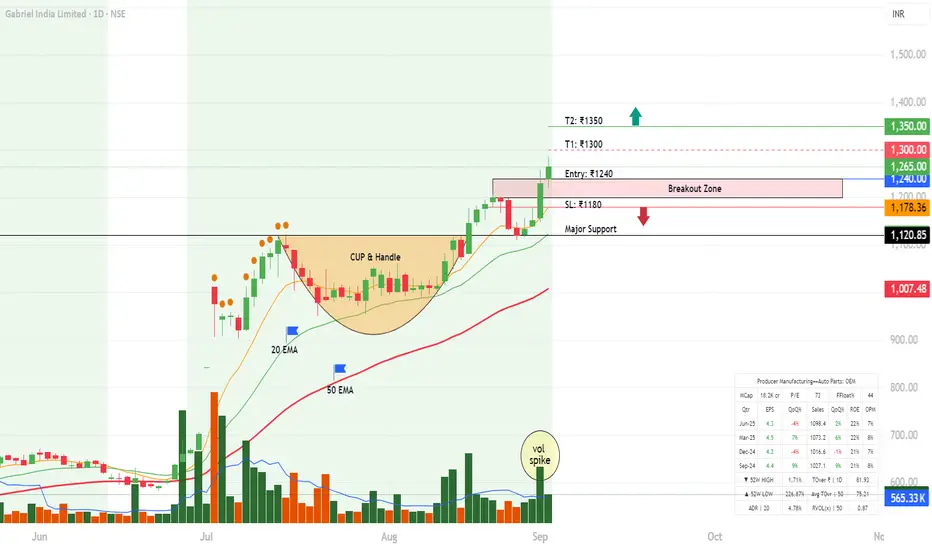
Gabriel India Ltd | Textbook Cup & Handle Breakout | Swing TradeGabriel India has formed a classic Cup & Handle pattern on the daily timeframe and given a decisive breakout above ₹1200 with strong volumes.
This indicates institutional accumulation and signals the start of a potential bullish leg.
Technical Analysis
Pattern: Cup & Handle → bullish continuation
Breakout Zone: ₹1200–1240 (now acting as strong support)
Current Price: ₹1265 (close as of 02 Sep 2025)
Volume: Noticeable spike, validating breakout strength
EMA Setup: Price trending above 20EMA (₹1178) & 50EMA (₹1123) → trend intact
Fundamental Key Area
Sector: Auto Ancillary (OEM supplier – suspension systems)
Market Cap: ~₹18,200 Cr (Mid-cap)
P/E: ~73 → premium valuation, market pricing in growth
Recent EPS: ₹4.3 (Jun-25) → steady growth
Sales Growth: +22% YoY (Jun-25) → consistent performance
Operating Margin: ~8% → stable margins for auto sector
Trade Plan
Entry Zone: ₹1240–1265 (CMP or on dips)
Stop-Loss: ₹1180 (below handle support & 20EMA)
Targets:-
T1: ₹1300 (Partial booking) (expected timeline 1-2 weeks)
T2: ₹1350 (Extended move) (expected timeline 2-3 weeks)
RR ≈ 1:1.8 → Favourable setup
Note: This analysis is shared purely for educational and informational purposes based on chart patterns and publicly available data. It should not be considered as investment advice. Please do your own research or consult a financial advisor before making trading decisions.
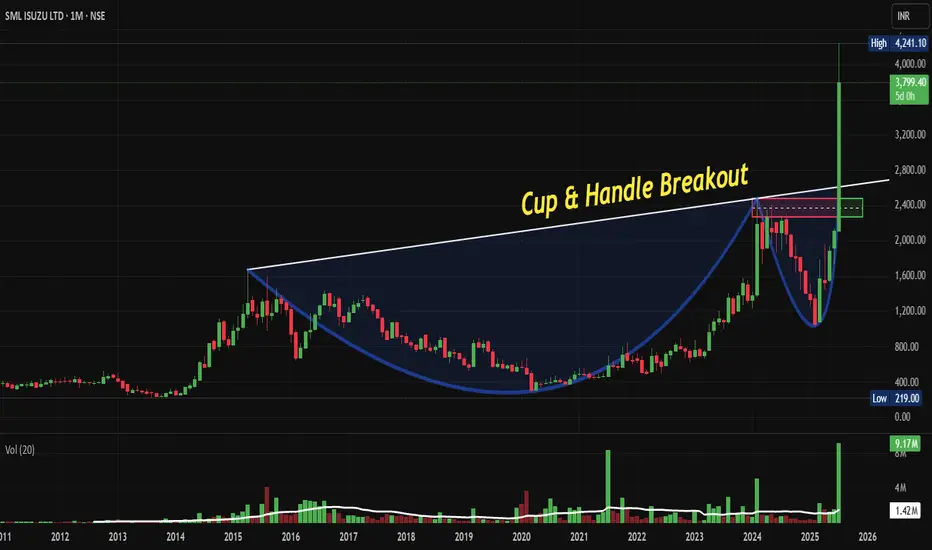
SMLISUZU: Explosive Cup and Handle Breakout, Chart of the Month From Years of Consolidation to Explosive Breakout: Why NSE:SMLISUZU Cup & Handle Pattern Could Deliver Multi-Bagger Returns. Let's Deep Dive into "Chart of the Month"
Price Action Analysis:
- Current trading price is approximately ₹3,799.40
- The stock has demonstrated a textbook Cup & Handle formation spanning over a decade (2015-2025)
- Post-breakout momentum shows strong bullish continuation with healthy volume expansion
- Recent breakout above the ₹2,400 breakout level indicates institutional accumulation
Volume Spread Analysis:
- Volume spike during the 2024-2025 breakout phase confirms genuine institutional interest
- Average daily volume has increased significantly from historical levels
- Volume pattern shows healthy distribution during consolidation phases and accumulation during breakouts
- Recent volume bars indicate sustained buying interest at higher levels
Key Technical Levels:
Base Formation:
- Primary base formed between 2020-2023 at ₹400-800 levels
- Secondary base consolidation occurred in 2023-2024 around ₹1,200-1,600 range
- The decade-long cup formation created a strong foundation for the current uptrend
Support Levels:
- Immediate support: ₹3,200-3,400 (recent consolidation zone)
- Strong support: ₹2,400-2,600 (cup breakout level)
- Critical support: ₹1,800-2,000 (previous resistance turned support)
- Long-term support: ₹1,200-1,400 (base formation)
Resistance Levels:
- Immediate resistance: ₹4,200-4,400 (psychological round number)
- Next resistance: ₹4,800-5,000 (projected target based on cup depth)
- Long-term target: ₹6,000+ (measured move from cup formation)
Technical Pattern:
Cup & Handle Pattern
- Formation period: 2015-2025 (10-year formation)
- Cup depth: Approximately ₹1,800 (from ₹2,400 high to ₹600 low)
- Handle formation: 2024-2025 consolidation
- Breakout confirmation: Volume expansion above ₹2,400
Moving Average Alignment:
- Price trading above all major moving averages
- Strong uptrend with moving averages in bullish sequence
- No signs of trend reversal in the immediate term
Trade Setup:
Entry Levels:
- Aggressive entry: ₹3,600-3,700 (current market price on minor dips)
- Conservative entry: ₹3,200-3,400 (on pullback to support)
- Accumulation zone: ₹2,800-3,200 (for long-term positions)
Exit Levels:
- Target 1: ₹4,500-4,700 (25-30% upside)
- Target 2: ₹5,500-5,800 (50-60% upside)
- Target 3: ₹6,500+ (multi-bagger potential)
Stop-Loss Strategy:
- For aggressive entries: ₹3,100 (8-10% risk)
- For conservative entries: ₹2,800 (12-15% risk)
- Trailing stop: Use a 20% trailing stop once the position moves 30% in favour
Position Sizing & Risk Management:
Position Sizing Guidelines
- Conservative investors: 2-3% of portfolio
- Moderate risk investors: 3-5% of portfolio
- Aggressive investors: 5-8% of portfolio (maximum recommended)
Risk Management Framework
- Never risk more than 2% of the total portfolio on a single trade
- Use position sizing formula: (Portfolio Risk ÷ Trade Risk) × 100
- Implement pyramid buying on pullbacks to support levels
- Book partial profits at each target level (33% at each target)
Portfolio Allocation Strategy:
- Core holding: 60% of position for long-term (2-3 years)
- Trading position: 40% for swing trades and profit booking
- Rebalance quarterly based on technical developments
Sectoral & Fundamental Backdrop:
Commercial Vehicle Sector Overview:
- The Commercial Vehicles market in India is projected to grow by 2.13% (2025-2030), resulting in a market volume of 1,165.00k vehicles in 2030
- India's commercial vehicle industry is gearing up for a modest recovery, with ICRA forecasting a 3-5 per cent year-on-year growth in wholesale volumes for FY26
- The India Commercial Vehicles Market size is estimated at 51.09 billion USD in 2025, and is expected to reach 62.95 billion USD by 2029, growing at a CAGR of 5.36%
Industry Dynamics:
- Infrastructure development is driving demand for commercial vehicles
- The government's focus on road construction and the logistics sector
- The e-commerce boom is increasing last-mile delivery vehicle demand
- Replacement demand cycle supporting steady growth
Company Fundamentals:
- Net profit of SML ISUZU rose 44.34% to Rs 67 crore in the quarter ended June 2025 as against Rs 46 crore during the previous quarter ended June 2024. Sales rose 13.39% to Rs 846 crore in the quarter ended June 2025
- Market Cap: 5,498 Crore (up 84.8% in 1 year), Revenue: 2,498 Cr, Profit: 142 Cr, Promoter Holding: 43.96%
Business Model Strengths:
- NSE:SMLISUZU Limited manufactures and sells commercial vehicles and related parts in India and internationally. Its products include trucks and buses
- Strong partnership with Isuzu Motors for technology and product development
- Focus on fuel-efficient and reliable commercial vehicles
- Growing aftermarket services contributing to recurring revenue
Financial Health Indicators:
- Consistent revenue growth over recent quarters
- Improving profit margins, indicating operational efficiency
- Stable promoter holding, suggesting management confidence
- Strong balance sheet supporting growth investments
Risk Assessment:
Technical Risks:
- Failure to hold ₹3,200 support could trigger correction to ₹2,800
- High volatility expected due to recent sharp price appreciation
- Potential profit booking pressure at psychological levels
Fundamental Risks:
- Cyclical nature of the commercial vehicle industry
- Dependency on economic growth and infrastructure spending
- Competition from established players like Tata Motors
- Raw material cost fluctuations impacting margins
Market Risks:
- Overall market correction could impact individual stock performance
- Interest rate changes affecting vehicle financing demand
- Regulatory changes in emission norms requiring investment
My Take:
NSE:SMLISUZU presents a compelling technical setup with the successful breakout from a decade-long Cup & Handle pattern. The combination of strong fundamentals, improving sector dynamics, and bullish technical indicators suggests potential for significant upside. However, investors should implement proper risk management given the stock's recent appreciation and inherent sector volatility.
The stock appears well-positioned to benefit from India's infrastructure growth story and the recovery of the commercial vehicle sector. Technical indicators support a bullish outlook with multiple price targets achievable over the next 12-18 months.
Keep in the Watchlist and DOYR.
NO RECO. For Buy/Sell.
📌Thank you for exploring my idea! I hope you found it valuable.
🙏FOLLOW for more
👍BOOST if you found it useful.
✍️COMMENT below with your views.
Meanwhile, check out my other stock ideas on the right side until this trade is activated. I would love your feedback.
Disclaimer: "I am not a SEBI REGISTERED RESEARCH ANALYST AND INVESTMENT ADVISER."
This analysis is intended solely for informational and educational purposes and should not be interpreted as financial advice. It is advisable to consult a qualified financial advisor or conduct thorough research before making investment decisions.
CNXAUTOCNXAUTO index has given long term trend-line and Inverted H&S breakout after so long. We may see a rally up to 28000 which is approx 11-12% from current price. 22800 is very crucial support. Closing below this may change my view. Tax cut news might be leading the rally. Choose stock which are currently strong in this consolidation phase. Keep a closer watch on auto stocks.

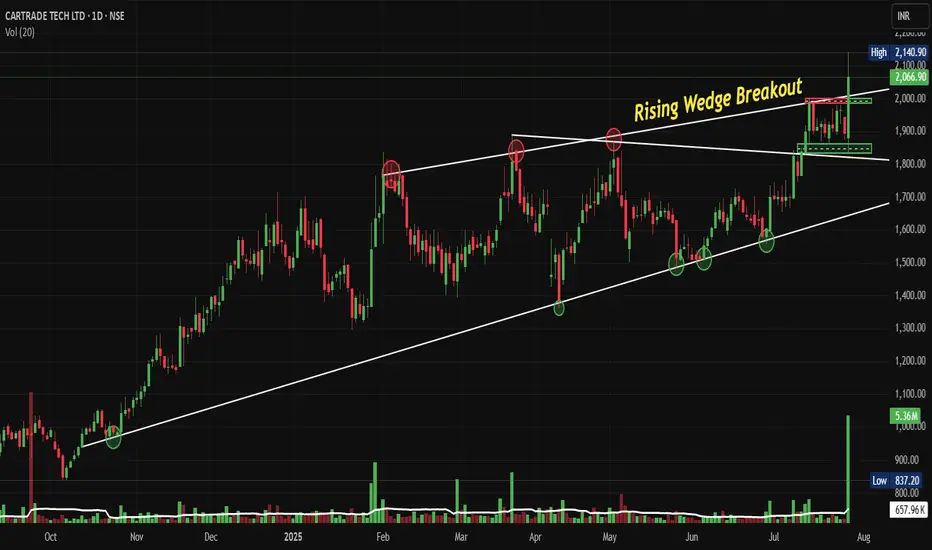
CARTRADE: Breaks Free with Rising Wedge Breakout Post Q1 FY 26NSE:CARTRADE Breaks Free: The Rising Wedge Breakout That's Driving This Auto-Tech Giant to New All-Time Heights with Strong Q1 FY 26
Price Action:
Price Movement and Trend Structure:
• Current Price: ₹2,066.90 (as of July 28, 2025)
• Daily Change: +₹172.20 (+9.09%) - Strong bullish momentum
• Price Range: High ₹2,140.90 | Low ₹2,100.90 | Volume 5.36M shares
• Price Trajectory: Consistent higher highs and higher lows pattern from October 2024
• Recent Action: Sharp acceleration in price movement post-July breakout
• Momentum Character: Strong bullish momentum with gap-up openings and sustained buying
Volume Spread Analysis:
Volume Characteristics:
• Breakout Volume: Exceptional volume spike during the breakout phase (5.36M shares)
• Volume Pattern: Generally increasing volume during upward moves, declining during consolidations
• Average Volume: Approximately 1-2M shares on regular trading days
• Volume Confirmation: The breakout is well-supported by above-average volume, validating the move
Volume Indicators:
• Volume Expansion: 3-4x normal volume during breakout sessions
• Distribution vs Accumulation: Clear accumulation pattern throughout the wedge formation
• Volume-Price Relationship: Positive correlation between volume and price advancement
Chart Patterns:
• Rising Wedge Breakout: The stock has successfully broken out of a long-term rising wedge pattern that was forming since October 2024
• Timeframe: Daily chart showing progression from October 2024 to July 2025
• Breakout Confirmation: Strong breakout above the upper trendline of the wedge with significant volume expansion
• Breakout Level: Approximately ₹1,850-1,900 range
• Pattern Completion: Clean breakout with follow-through buying confirming pattern validity
Key Price Levels:
• All-Time High: ₹2,140.90 (recent high)
• Previous Resistance Zones: ₹1,800, ₹1,900, ₹2,000
• Immediate Support: ₹1,850-1,900 (previous breakout zone)
• Major Support: ₹1,650-1,700 (middle of previous consolidation)
• Long-term Support: ₹1,400-1,450 (bottom of the rising wedge)
Trend Analysis:
• Primary Trend: Strong bullish momentum with consistent higher highs and higher lows
• Secondary Trend: Recently accelerated upward movement post-breakout
• Trend Strength: Multiple touchpoints on both trendlines confirm the validity of the wedge pattern validity
• Momentum: Increasing momentum as evidenced by the steepening price action
Key Support and Resistance Levels:
Key Resistance Levels:
• Immediate Resistance: ₹2,150-2,200 (psychological and technical resistance)
• Next Target: ₹2,300-2,350 (measured move from wedge breakout)
• Long-term Target: ₹2,500+ (extension based on wedge height projection)
Critical Support Levels:
• First Support: ₹1,950-2,000 (recent consolidation zone)
• Strong Support: ₹1,850-1,900 (breakout confirmation level)
• Major Support: ₹1,650-1,700 (50% retracement of recent move)
• Ultimate Support: ₹1,400-1,450 (wedge bottom - unlikely to be tested)
Base Formation:
• Base Pattern: Rising wedge base formed over 9 months (October 2024 to July 2025)
• Base Depth: Approximately ₹1,000 to ₹1,900 range
• Base Quality: High-quality base with multiple retests of support and resistance
• Breakout Strength: Clean breakout with gap-up opening confirming institutional interest
Technical Patterns and Indicators:
Chart Patterns:
• Completed Pattern: Rising Wedge Breakout (Bullish continuation pattern)
• Pattern Reliability: High - well-defined trendlines with multiple touchpoints
• Measured Move Target: ₹2,300-2,400 (based on wedge height projection)
• Time Frame: 9-month pattern completion
Technical Formations:
• Flag and Pennant Potential: Post-breakout consolidation may form continuation patterns
• Gap Analysis: Potential gap fills not immediately concerning given strong fundamentals
• Trend Channel: Stock is establishing a new, steeper upward channel post-breakout
Trade Setup and Strategy:
Entry Levels:
• Aggressive Entry: ₹2,050-2,070 (current market price on dips)
• Conservative Entry: ₹1,950-1,980 (on pullback to breakout zone)
• Momentum Entry: ₹2,100-2,120 (on continuation above resistance)
• Scale-in Strategy: 40% at ₹2,000, 35% at ₹1,950, 25% at ₹1,900
Exit Levels and Targets:
• Target 1: ₹2,200-2,250 (immediate resistance zone) - Book 30% profits
• Target 2: ₹2,350-2,400 (measured move target) - Book 40% profits
• Target 3: ₹2,500-2,600 (extension target) - Book remaining 30%
• Trail Strategy: Trail stop-loss 8-10% below recent swing lows after Target 1
Stop-Loss Strategy:
• Aggressive Stop: ₹1,900-1,920 (below recent support)
• Conservative Stop: ₹1,850-1,870 (below breakout zone)
• Disaster Stop: ₹1,750-1,780 (below major support)
• Risk-Reward Ratio: Minimum 1:2, targeting 1:3 for optimal entries
Position Sizing and Risk Management:
Position Sizing Guidelines:
• Conservative Allocation: 2-3% of portfolio (suitable for risk-averse investors)
• Moderate Allocation: 4-5% of portfolio (balanced approach)
• Aggressive Allocation: 6-8% of portfolio (for high-conviction trades)
• Maximum Position: Not exceeding 10% of the total portfolio, regardless of conviction
Risk Management Rules:
• Single Trade Risk: Maximum 1-2% of portfolio value per trade
• Stop-Loss Discipline: Strict adherence to predetermined stop-loss levels
• Profit Booking Strategy: Systematic profit booking at predetermined targets
• Position Monitoring: Daily review of technical levels and volume patterns
Risk Mitigation Techniques
• Diversification: Avoid overconcentration in a single stock or sector
• Hedging Options: Consider protective puts for large positions
• Correlation Analysis: Monitor correlation with broader auto and tech indices
• News Sensitivity: Be prepared for volatility around earnings and sector news
Sectoral and Fundamental Backdrop:
Industry Landscape:
• Auto Marketplace Growth: India's online auto marketplace is growing at a 27.5% CAGR (2025-2030)
• Digital Transformation: Increasing shift from offline to online vehicle transactions
• Market Leadership: CarTrade Tech is India's leading and only profitable auto marketplace
• Competitive Advantage: Multi-platform presence with CarWale, BikeWale, CarTrade, and OLX India
Business Model Strength:
• Asset-Light Model: Operates 114 auto malls, mostly leased, ensuring capital efficiency
• Revenue Diversification: Multiple revenue streams including listing fees, transaction commissions, and financial services
• Platform Integration: Comprehensive ecosystem covering new cars, used cars, commercial vehicles, and two-wheelers
• Strategic Acquisitions: OLX India acquisition for ₹535.54 crore, strengthening market position
Recent Fundamental Performance:
• Q1 FY26 Results: Revenue of ₹173 crore (22% YoY growth)
• Profit Growth: Net profit doubled year-on-year in Q1 FY26
• Market Capitalization: ₹9,801 crore (up 139% in past year)
• Valuation Metrics: Trading at 4.42 times book value
• EBITDA Performance: EBITDA almost doubled in Q1 FY26
Growth Catalysts:
• Market Expansion: Penetration into tier-2 and tier-3 cities
• Technology Enhancement: AI and ML integration for better user experience
• Financial Services: Growing fintech vertical with loan facilitation
• Electric Vehicle Segment: Positioning for EV marketplace opportunities
• B2B Growth: Expanding dealer and OEM partnerships
Sector Tailwinds:
• Digital Adoption: Accelerated post-pandemic shift to online platforms
• Used Car Market: Growing preference for certified pre-owned vehicles
• Credit Penetration: Increasing vehicle financing accessibility
• Regulatory Support: Government push for digitization and transparency
• Consumer Behaviour: Millennial and Gen-Z preference for online research and transactions
Risk Factors and Considerations:
Technical Risks:
• Overbought Conditions: Stock may be due for consolidation after a sharp run-up
• Gap Risk: Potential for gap-down on negative news or market corrections
• Volume Sustainability: Need for continued high volume to sustain momentum
• Market Correlation: High beta stock susceptible to broader market volatility
Fundamental Risks:
• Economic Slowdown: Auto sales sensitivity to economic cycles
• Competition Intensification: New entrants and existing players' aggressive strategies
• Regulatory Changes: Potential policy changes affecting online marketplaces
• Technology Disruption: Emergence of new technologies or business models
Market Risks:
• Sector Rotation: Shift in investor preference away from auto-tech stocks
• Liquidity Concerns: Mid-cap stock with potential liquidity constraints during market stress
• Earnings Expectations: High growth expectations leading to volatility on any disappointment
• Valuation Concerns: Premium valuations make stock sensitive to market sentiment changes
My Take and Investment Thesis:
NSE:CARTRADE presents a compelling technical setup with a successful rising wedge breakout supported by strong volume and robust fundamental performance. The stock has established itself as a leader in India's growing auto marketplace sector with a diversified business model and strong growth trajectory.
The technical breakout, combined with excellent Q1 FY26 results showing doubled profits and 22% revenue growth, creates a favourable risk-reward scenario for investors. However, given the stock's significant run-up (146% in 11 months), careful position sizing and strict risk management are essential.
The investment thesis is supported by both technical momentum and fundamental strength, making it suitable for investors seeking exposure to India's digital transformation in the automotive sector. The key to success will be disciplined execution of the outlined entry, exit, and risk management strategies while monitoring both technical levels and fundamental developments closely.
Keep in the Watchlist and DOYR.
NO RECO. For Buy/Sell.
📌Thank you for exploring my idea! I hope you found it valuable.
🙏FOLLOW for more
👍BOOST if you found it useful.
✍️COMMENT below with your views.
Meanwhile, check out my other stock ideas on the right side until this trade is activated. I would love your feedback.
Disclaimer: "I am not a SEBI REGISTERED RESEARCH ANALYST AND INVESTMENT ADVISER."
This analysis is intended solely for informational and educational purposes and should not be interpreted as financial advice. It is advisable to consult a qualified financial advisor or conduct thorough research before making investment decisions.
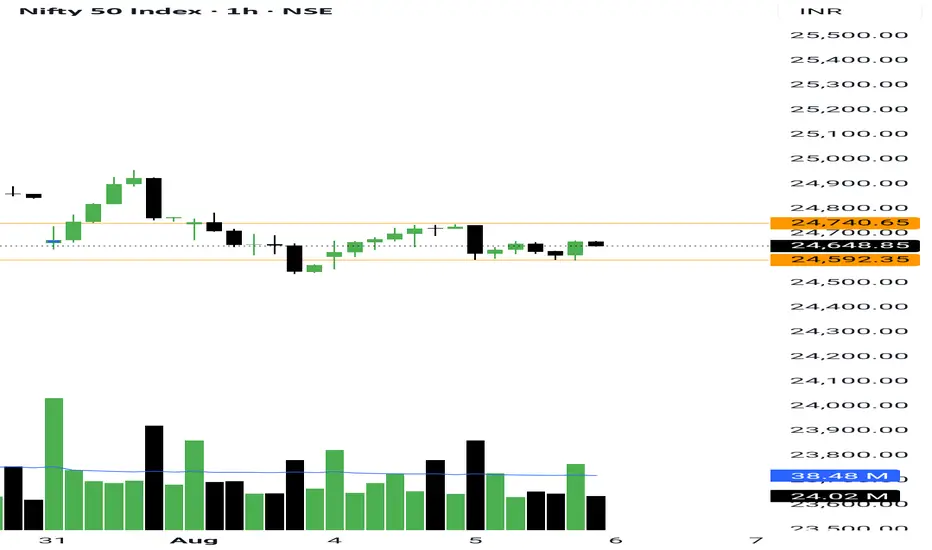
Nifty and Banknifty both giving good sign Yesterday, I spotted stopping volume in NSE:NIFTY — and that’s a good sign.
Nifty gave a strong bounce by the end of the day, which shows buyers stepping in.
Though sellers' volume is still high — above 50 million — the price action looks encouraging.
Today, Nifty’s Pivot is at 24,657
Pivot Percentile is just 0.03%, which means we can expect a trendy move again — either up or down, depending on where it breaks.
Intraday Support: 24,588
Intraday Resistance: 24,733
If the resistance breaks and Nifty holds above it, we might see a strong bounce today.
NSE:BANKNIFTY also looks bounce-ready on the intraday chart.
But only if the support at 55,095 holds well.
Can clearly see stopping volume on the 15-minute chart, which is a positive signal.
Sector Watch:
Yesterday, I saw good movement in NSE:NIFTY_IND_DEFENCE , NSE:CNXAUTO , and Fertilizer sectors. Keep an eye on them for short term trade opportunities.
Yesterday, I traded NSE:FORCEMOT and it gave a move of 4%+.
Still holding the position.
That’s all for today.
Stick to your setup, follow your plan.
Take care and have a profitable day ahead!
HEROMOTOCO Long IdeaHero Motor Corp formed Inverse Head & Shoulder pattern. It broke out today.
Stoploss and targets are given in chart.
Note: Trade as per Risk Management Rules.
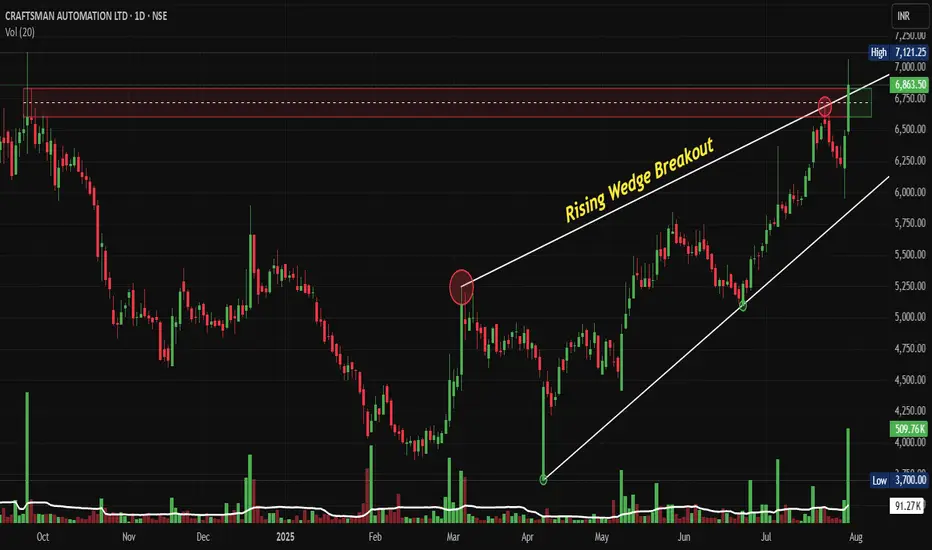
CRAFTSMAN: Rising Wedge Breakout Post Q1 FY26NSE:CRAFTSMAN Breaks Above Rising Wedge: A Bullish Technical Play Worth Watching Post Decent Q1 FY26 Results
Price Action Analysis:
Current Price Movement:
• Current Price: ₹6,863.50 (as of July 30, 2025)
• Day's Performance: +₹415.50 (+6.44%)
• Volume: 91.27K shares
• 52-Week Range: ₹3,700 - ₹7,121.25
Price Structure Analysis:
• Trend: Strong uptrend from March 2025 lows
• Higher Highs: Consistent formation since March 2025
• Higher Lows: Well-defined support levels during pullbacks
• Momentum: Acceleration post-breakout with gap-up opening
Volume Spread Analysis:
• Volume Patterns: Decreasing volume during the consolidation phase
• Breakout Volume: Significant surge indicating institutional participation
• Volume Profile: Above-average participation at key resistance levels
Key Price Levels:
• All-Time High: ₹7,121.25 (immediate target zone)
• Breakout Level: ₹6,500 (now acting as support)
• Previous Resistance: ₹6,200-6,300 (now support zone)
• Major Support: ₹5,800-6,000 (rising trendline confluence)
Base Formation:
• Primary Base: Extended consolidation between ₹4,800-6,500 from March to July 2025
• Duration: Approximately 4 months
• Depth: Shallow correction of 15-20% from previous highs
• Character: Healthy sideways movement with diminishing volatility
Key Support and Resistance Levels:
• Major Resistance: ₹7,121.25 (all-time high)
• Immediate Resistance: ₹6,900-7,000 zone
• Strong Support: ₹6,500 (breakout level)
• Major Support: ₹5,800-6,000 (rising wedge upper trendline)
• Critical Support: ₹5,200-5,300 (previous consolidation zone)
Technical Pattern:
Rising Wedge Breakout:
• Pattern: Bullish breakout from a rising wedge formation
• Formation Period: March 2025 to July 2025
• Breakout Level: ₹6,500 approximately
• Volume Confirmation: Strong volume spike on breakout day
Trade Setup:
Entry Strategy:
• Primary Entry: ₹6,850-6,900 (current levels on any minor dip)
• Aggressive Entry: ₹6,800-6,850 (immediate entry)
• Conservative Entry: ₹6,650-6,700 (on pullback to breakout level)
Target Levels:
• Target 1: ₹7,200-7,300 (immediate resistance zone)
• Target 2: ₹7,800-8,000 (measured move target)
• Target 3: ₹8,500-9,000 (cup and handle projection)
Stop-Loss Levels:
• Aggressive Stop: ₹6,400 (below breakout level)
• Conservative Stop: ₹6,200 (below rising wedge support)
• Trailing Stop: Move to breakeven once Target 1 is achieved
Position Sizing:
• Risk per trade: Maximum 2% of portfolio
• Position size calculation based on stop-loss distance
• For ₹6,850 entry with ₹6,400 stop: Risk = ₹450 per share
• Recommended allocation: 1-2% of equity portfolio
Risk Management:
Risk Factors:
• Market-wide correction could drag the stock down
• Sector rotation out of engineering/auto components
• Profit booking at all-time high levels
• Global economic headwinds affecting the auto sector
Risk Mitigation:
• Strict stop-loss adherence
• Partial profit booking at each target level
• Position size limiting to manage portfolio risk
• Monitoring broader market sentiment
Exit Strategy:
• Book 30% profits at Target 1
• Book another 40% at Target 2
• Trail remaining 30% with rising stop-loss
Sectoral and Fundamental Backdrop:
Business Overview:
• Diversified engineering company with vertically integrated manufacturing
• Three main segments: Automotive Powertrain (51%), Aluminium Products (21%), Industrial & Engineering (28%)
• Market capitalization: ₹16,357 crores
• Revenue: ₹6,323 crores with profit of ₹211 crores (TTM)
Recent Financial Performance(Q1 FY26):
• Q1 FY26 results: Revenue of ₹1,784 crores, profit of ₹70 crores
• PAT growth: 31% YoY in Q1 FY26
• Segment performance: Aluminium Products revenue up 102.82% YoY
• Powertrain revenue: ₹496.41 crores (up 19.23% YoY)
Sector Dynamics:
• Automotive sector recovery post-pandemic
• Increasing adoption of aluminium components for weight reduction
• Growing demand for powertrain components in commercial vehicles
• Beneficiary of the Make in India initiative
Key Clients and Market Position:
• Supplies to tier 1 OEMs including Tata Motors, Cummins, M&M, Royal Enfield
• Strong presence in commercial vehicles, two-wheelers, and tractor segments
• Established player in aluminium die-casting and machining
Growth Drivers:
• Capacity utilization improvements
• Focus on higher-margin aluminium products
• Expansion in industrial and engineering segments
• Increasing content per vehicle trends
Analyst Outlook after Q1 FY26:
• Average 1-year price target: ₹5,754 (though this appears conservative given current price)
• Price target range: ₹4,318 to ₹8,085
• Positive sentiment on aluminium business growth
• Capex guidance of ₹100-120 crores annually for maintenance and debottlenecking
My Take:
The technical setup for NSE:CRAFTSMAN presents a compelling bullish case with the successful breakout from a rising wedge pattern, supported by strong volume and a healthy fundamental backdrop. The stock is well-positioned to test new highs, though traders should remain disciplined with risk management given the proximity to all-time high levels. The diversified business model and strong sectoral tailwinds provide fundamental support to the technical breakout.
Keep in the Watchlist and DOYR.
NO RECO. For Buy/Sell.
📌Thank you for exploring my idea! I hope you found it valuable.
🙏FOLLOW for more
👍BOOST if you found it useful.
✍️COMMENT below with your views.
Meanwhile, check out my other stock ideas on the right side until this trade is activated. I would love your feedback.
Disclaimer: "I am not a SEBI REGISTERED RESEARCH ANALYST AND INVESTMENT ADVISER."
This analysis is intended solely for informational and educational purposes and should not be interpreted as financial advice. It is advisable to consult a qualified financial advisor or conduct thorough research before making investment decisions.
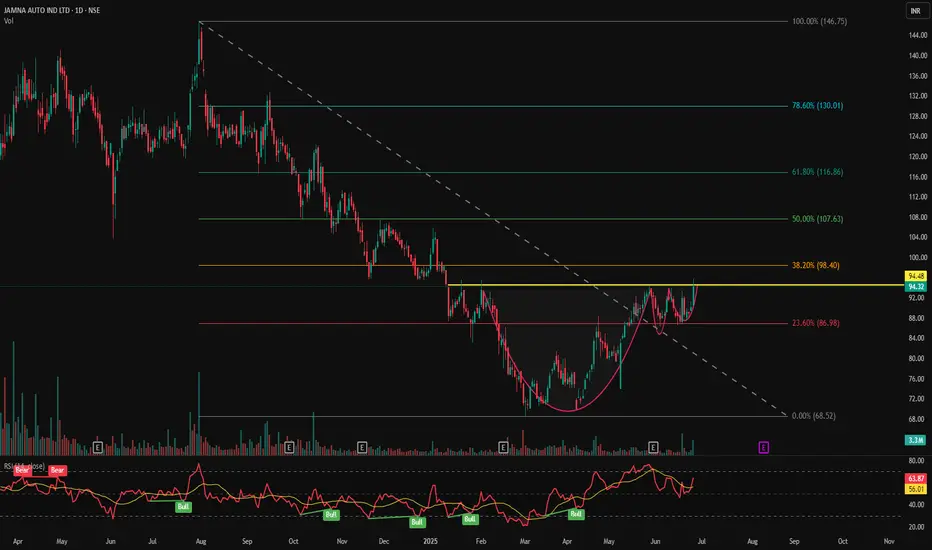
JAMNAAUTO - VCP Pattern Near Breakout📊 JAMNA AUTO (JAMNAAUTO) – VCP Pattern Near Breakout | RSI Momentum | Volume Surge | Daily Chart
📅 Chart Date: June 26, 2025
📈 CMP: ₹94.32 (+4.60%)
📍 Ticker: NSE:JAMNAAUTO
🔍 Technical Analysis Summary
☕ Cup & Handle Formation
The chart shows a well-formed Cup & Handle pattern
Neckline resistance at ₹94.48 – a break above this zone could trigger bullish continuation
Pattern suggests accumulation and breakout setup after prolonged downtrend reversal
📈 Volume
Rising volume on recent candles, supporting strength of potential breakout
Volume above 3.3M confirms strong buying interest
📊 RSI Indicator (14)
RSI currently at 63.87 and rising
Multiple historical RSI Bullish crossovers visible during base and handle formation
RSI > 60 indicates momentum is favoring bulls
📍 Key Price Levels
✅ Breakout Zone (Neckline): ₹94.48
🚀 Upside Targets (Post-breakout estimate):
₹102
₹110
₹120+
🛡️ Support Zones:
₹90 (immediate)
₹85 (handle base)
₹80 (cup base)
📌 Trade Setup Idea
Entry: On breakout above ₹94.50 with volume
SL: Below ₹89
Targets: ₹102 → ₹110 → ₹120+
Risk-Reward: Good, considering rounded base and handle plus RSI confirmation
⚠️ Disclaimer
This chart analysis is for educational purposes only. Always DYOR (Do Your Own Research) and consult a financial advisor before making investment decisions.
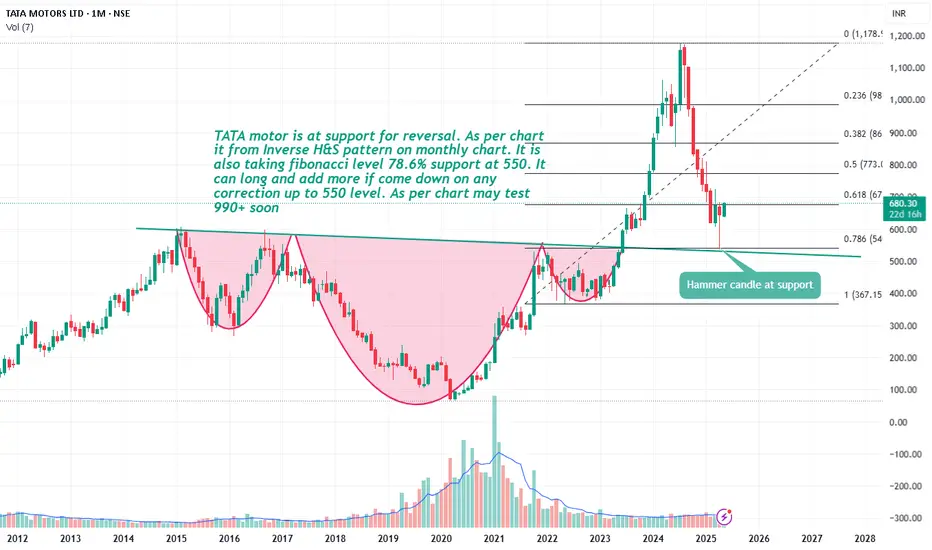
Tata motor long on any correction.TATA motor is at support for reversal. As per chart it from Inverse H&S pattern on monthly chart. It is also taking fibbonacci level 78.6% support at 550. It can long and add more if come down on any correction up to 550 level. As per chart may test 990+ soon.
Tata motor sign of correction.As per chart analysis stock is trading in LL & LH pattern. It is facing resistance at 78.6%.
Candle pattern showing evening star pattern which is sign correction. It may test 580 soon.

Auto Index Nears Breakdown: Hero Motocorp a Top Short Pick◉ Auto Sector Overview NSE:CNXAUTO
● The auto sector has recently experienced significant selling pressure, driving the index to hover just above its key support level at 22,000.
● However, there are concerns that this support level may not hold for long, potentially leading to a breakdown and continuation of the downtrend.
In light of this scenario, short positions in select stocks within the sector could present a viable trading opportunity.
◉ Hero Motocorp Technical Analysis NSE:HEROMOTOCO
● On the weekly chart, Hero Motocorp has formed a Head & Shoulders pattern, a classic bearish reversal signal.
● The price has recently breached the neckline of this pattern, indicating a potential for further downside movement. This breach reinforces the bearish outlook for the stock.
◉ OI Data Analysis
● Open interest data shows a buildup of new short positions during recent trading sessions, further supporting the bearish sentiment.
● Additionally, the option chain data highlights a significant concentration of put writers at the 3900 level.
● With this level now breached, the stock is expected to maintain its negative momentum, potentially leading to further declines.

ASHOK LEYLAND LONG IDEA......Pros
Ashok Leyland chart looks good for reversal.
Auto sector looks relatively strong compared to other sectors in this fall.
Risk:Reward
Stoploss is Trend line breakdown. Target is ATH. Which gives best Risk:Reward.
Cons: Broader Market is very bad currently. One +ve thing in this market is "It is oversold". So Risk Management is very important now.
Note This is Technical view only. No idea about Fundamentals.

The Wheels are Turning: Auto Sector Sees Major GainsIndian auto stocks surged on January 2, 2025, fuelled by impressive December sales numbers, which propelled the Nifty Auto index to its highest daily gain in six months.
◉ Key Players
1. Eicher Motors NSE:EICHERMOT
● Surged 7%, with December sales up 25% YoY to 79,466 units, and exports rising 90% YoY.
2. Ashok Leyland NSE:ASHOKLEY
● Rose 5%, with December sales exceeding estimates, up 5% YoY, and Medium and Heavy Commercial Vehicles sales up 8% YoY.
3. Maruti Suzuki India NSE:MARUTI
● Extended gains for the second straight day, rallying 5%, driven by strong December car sales and bullish management commentary.
4. Mahindra & Mahindra NSE:M&M
● Up over 3% for the second consecutive day, with December SUV sales jumping 18% YoY to 41,424 units, driven by strong demand.
◉ Overall Outlook
The Indian automotive market is poised for continued growth, driven by a resilient economy and robust consumer demand. Potential interest rate cuts are expected to further fuel this growth, making vehicle financing more accessible and affordable for consumers. As a result, the road ahead looks promising for FY26, with expectations of sustained growth and increased sales in the automotive sector.

Cummins India Ltd: Eyeing a Major BreakoutCummins India Ltd (NSE: CUMMINS) is signaling strong bullish momentum on the weekly chart with a falling wedge and bullish flag combination .
Key Insights:
Patterns: Falling wedge + bullish flag – strong continuation signals.
Current Price: ₹3,671.00 (+1.98%).
Breakout Zone: ₹3,750 (watch for a sustained move).
Targets: ₹3,929 → ₹4,169 → ₹4,500 → ₹5,600+ (bullish flag projection).
Support Levels: ₹3,422 and ₹3,251.
A breakout above ₹3,750 with volume confirmation could push prices toward ₹5,600+, aligning with the bullish flag target.

Bajaj Auto Ltd.: Descending Wedge - Breakout or Breakdown?Bajaj Auto Ltd. is currently trading within a descending wedge pattern, indicating potential consolidation or a breakout scenario. Here’s the technical breakdown:
Key Observations
Descending Wedge:
The price is narrowing, with lower highs and lows, signaling reduced selling momentum.
Support Zone:
₹8,800–₹8,900 serves as a strong support level. A breakdown below this could lead to further downside.
Resistance Levels:
₹9,262.90: Immediate resistance.
₹9,642.45 and ₹9,995.55: Higher levels to watch in case of a breakout.
Trade Outlook
Bullish View:
A breakout above the wedge’s upper trendline signals upward momentum, targeting ₹9,262 and beyond.
Bearish View:
A breakdown below ₹8,800 could push the price to ₹8,600 or ₹8,400.

TVSMOTORReasons for considering a long position on TVS Motor:
1. Price at Support Zone: The daily horizontal support zone indicates a level where demand has historically been strong, which could push the price higher from here.
2. Above 200-Day Moving Average: Trading above this long-term moving average suggests a bullish trend, as it’s a widely-watched indicator of a stock’s overall direction.
3. Positive Relative Strength Against Nifty: Outperforming the Nifty shows that TVS Motor has stronger momentum, a good sign of investor confidence in this stock specifically.
4. Nifty Auto at Support Zone and 200-Day Moving Average: The sector’s overall strength at support, combined with it holding above the 200-day moving average, adds a supportive macro backdrop.
Waiting for confirmation with a CHOCH (Change of Character) on the 1-hour timeframe is a solid approach. Here’s a structured plan based on that:
1. Wait for CHOCH on 1-Hour: The CHOCH would confirm a potential shift in market structure, signaling the beginning of bullish momentum. This adds more reliability to the trade setup.
2. Entry on Retest / FVG / IFVG:
• Retest: After the CHOCH, a retest of the breakout zone could provide an optimal entry, ensuring the breakout holds.
• Fair Value Gap (FVG): If an FVG appears within this structure, entering here could capture the shift in momentum at a lower-risk point.
• Imbalance Fair Value Gap (IFVG): An entry on an IFVG could further refine your risk-to- reward ratio, especially if market liquidity fills these gaps.

TATA MOTORSReasons to consider going long on Tata Motors:
1. Technical Support Levels: Tata Motors is positioned at a horizontal support level and a fair value gap on the daily timeframe, indicating potential for a reversal or bounce.
2. Fundamental Strength: Tata Motors is fundamentally strong, likely benefiting from a well- positioned product line, growing market share, and financial resilience.
3. Sector Support: The Nifty Auto index is also at its support level and is taking support at the 200-day moving average, which could signal broader strength for the auto sector and support upward movement for stocks like Tata Motors.
Waiting for confirmation with a CHOCH (Change of Character) on the 1-hour timeframe is a solid approach. Here’s a structured plan based on that:
1. Wait for CHOCH on 1-Hour: The CHOCH would confirm a potential shift in market structure, signaling the beginning of bullish momentum. This adds more reliability to the trade setup.
2. Entry on Retest / FVG / IFVG:
• Retest: After the CHOCH, a retest of the breakout zone could provide an optimal entry, ensuring the breakout holds.
• Fair Value Gap (FVG): If an FVG appears within this structure, entering here could capture the shift in momentum at a lower-risk point.
• Imbalance Fair Value Gap (IFVG): An entry on an IFVG could further refine your risk-to- reward ratio, especially if market liquidity fills these gaps.

"Retailer Trap in Action? | TATAMOTORS✅"Tata Motors (-3.8%) has hit its lowest point since January, down 28% from July highs. Are you buying the dip?"
✅"Inducement is a process where market movements are manipulated to encourage traders to take positions that are likely to fail. The idea is that large institutions can influence price movements to attract various traders and trap them in losing trades."
💡Insight:
📍Business Split: Tata Motors is separating its Passenger and Commercial Vehicle businesses to streamline operations, with a Jaguar Land Rover IPO expected soon
📍Sales Boosting Discounts: October 2024 sees major festive discounts on models like the Nexon and Harrier to regain market share
📍Sales Performance: A 2% year-over-year increase in Q1 FY25, led by strong growth in commercial vehicles despite slight dips in passenger vehicles
💡✍️Applied Tools:-
1️⃣Trap Trading
2️⃣Strong order block zone
3️⃣Fake channel breakout
4️⃣Inducement Strategy
✅Check out my TradingView profile to see how we analyze charts and execute trades.
⭕️ Swing Trading opportunity: Price Action Analysis Alert !!!⭕️
💡FNO Stocks📉📈📊
🙋♀️🙋♂️If you have any questions about this stock, feel free to reach out to me.
📍📌Thank you for exploring our idea! We hope you found it valuable.
🙏FLLOW for more !
👍LIKE if useful !
✍️COMMENT Below your view !
