Why Every Trend Needs an Anchor Markets Are Test Matches, Not T20s — Why Every Trend Needs an Anchor
Understanding AVWAP: Learning to Read Where the Market Remembers
One of the biggest challenges for traders is knowing which levels actually matter.
Markets print hundreds of candles, but only a few prices carry memory.
Anchored VWAP (AVWAP) is a tool that helps us identify those prices — where meaningful participation occurred.
Yesterday’s price action in Nifty Futures offers a very good learning example.
During a sharp, emotional sell-off, price declined and stopped precisely at the AVWAP anchored from the 7th April 2025 low — a day that also marked the highest traded volume of the last year (~20 million contracts).
This outcome wasn’t accidental. It was structural.
What AVWAP Really Represents
AVWAP is not just another indicator.
It shows:
The average price paid by participants since a chosen point
Weighted by volume, not time
Reflecting real positioning, not theoretical averages
In simple terms:
AVWAP tells us where the market’s money is positioned from a specific event.
Because large participants manage risk around their average price, AVWAP often becomes a decision zone, not just a line.
Why the Anchor Is More Important Than the Indicator
AVWAP is only as effective as the event you anchor it to.
The market does not respect arbitrary dates.
It respects events that forced commitment.
High-quality anchor points include:
Days with exceptionally high volume
All-time highs or major breakouts
Crash lows (2008, COVID)
Major structural bottoms (such as 2023)
Panic or capitulation candles
These are the moments when positioning changes hands and long-term inventory is created.
April 2025: A Lesson in Confluence
Let’s break this down step by step.
1. The 2023 Bottom
This was not just another swing low.
It was a cycle-defining bottom for Nifty.
Anchoring an AVWAP from this point gives us a long-term cost reference for market participants who entered near that structural low.
2. April 7, 2025
On this day:
Nifty Futures formed a swing low
Volumes expanded to the highest level of the past year (~20M)
Price was trading very close to the AVWAP from the 2023 bottom
This alignment is important.
When a new high-volume low forms near an older structural AVWAP, it tells us larger players are engaging at a familiar cost zone.
3. What Happened After
Following April 2025:
Price trended higher
Pullbacks repeatedly found support near this AVWAP
Buyers defended the level consistently
This behavior shows acceptance above the anchor — a sign of healthy structure.
4. The Recent Panic Sell-Off
During yesterday’s sell-off:
Emotion dominated price action
Weak hands exited positions
Price declined directly into the April 7 AVWAP
Selling pressure slowed and price stabilized
This is exactly how strong reference levels behave — they don’t prevent volatility, but they absorb it.
Why AVWAP Works During Volatile Markets
AVWAP becomes especially useful when volatility expands.
That’s because:
Institutions track their average cost
Risk is adjusted near those levels
Decisions are made where positioning is concentrated
As a general framework:
Above AVWAP → structure remains constructive
Below AVWAP → supply increases, caution required
Reclaim of AVWAP → trend strength resumes
AVWAP doesn’t predict direction.
It highlights where decisions are likely to happen.
Practical Guidance for Using AVWAP
1. Be Selective With Anchors
Before anchoring, ask:
“Was this a moment when the market was forced to commit?”
If not, skip it.
2. Always Look at Volume
The best AVWAPs come from:
Highest volume days
Breakdowns or breakouts with expansion
Panic or capitulation events
Volume validates relevance.
3. Look for Confluence, Not Precision
AVWAP works best when it aligns with:
Prior swing lows or highs
Trend structure
Higher timeframe context
April 2025 was powerful because it aligned with the AVWAP from the 2023 bottom.
4. Let Volatility Confirm the Level
Quiet markets don’t test conviction.
Volatile markets do.
If a level holds during panic, it deserves respect.
My Perspective
AVWAP is not about drawing more lines.
It’s about learning which prices the market remembers.
When price reacts during fear — not comfort — you are seeing real structure, not coincidence.
Study those reactions.
Over time, you’ll begin to see that the market leaves clear footprints — and AVWAP is one of the best tools to track them.
My Take on markets vsTest Matches
In Test cricket, great innings aren’t built on constant aggression.
They are built around an anchor — the batsman who:
Absorbs pressure
Respects good deliveries
Holds one end while others play around him
This is exactly how great players likes of Sachin Tendulkar, Rahul Dravid Virat Kohli et all have built his best Test knocks — not by chasing every ball, but by playing around a stable base.
Markets behave the same way.
Price can swing, panic can spread, momentum players can come and go — but long-term structure holds around anchored reference points.
AVWAP acts like that anchor batsman.
It doesn’t score flashy runs every session.
It doesn’t predict the next ball.
But as long as price respects it, the innings stays intact.
When panic arrives, the anchor absorbs it.
When momentum returns, the innings continues.
As traders and investors, our job is not to play every delivery.
Our job is to recognize where the market is anchoring, and then build positions with patience — just like a Test match, not a highlight reel.
Because in both cricket and markets:
Those who stay anchored, stay in the game the longest.
Avwap

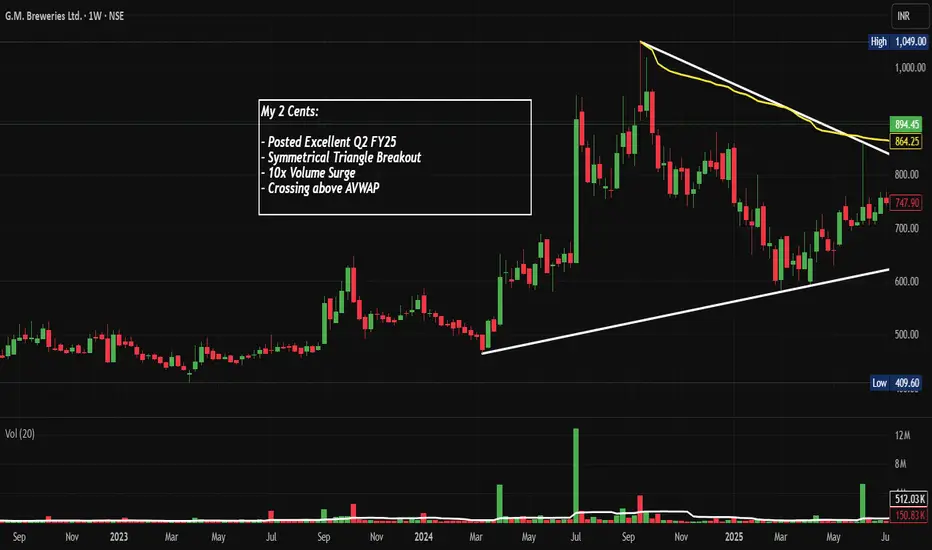
GMBREW: Broke Out Post Q2 FY26 with 10x Vol, Chart of the WeekA Small-Cap Brewery Stock NSE:GMBREW Broke Out With 10x Volume and Posted 61% Profit Growth in Q2 FY26. Let's Analyse in the "Chart of the Week"
As per the Latest SEBI Mandate, this isn't a Trading/Investment RECOMMENDATION nor for Educational Purposes; it is just for Informational purposes only. The chart data used is 3 Months old, as Showing Live Chart Data is not allowed according to the New SEBI Mandate.
Disclaimer: "I am not a SEBI REGISTERED RESEARCH ANALYST AND INVESTMENT ADVISER."
This analysis is intended solely for informational purposes and should not be interpreted as financial advice. It is advisable to consult a qualified financial advisor or conduct thorough research before making investment decisions.
Price Action Analysis:
Trend Structure:
- The stock has been trading in a well-defined ascending triangle pattern from March 2023 to September 2025
- Lower trendline support starts around 500 levels and has been holding consistently
- Upper resistance formed a symmetrical descending trendline from the August 2024 peak near 1,049
- The consolidation phase between 650-750 lasted approximately 12-14 months, indicating strong accumulation
Recent Breakout Dynamics:
- On October 9, 2025, the stock witnessed a powerful breakout above the descending resistance trendline
- The breakout candle closed at 894.45, representing a gain of 22% in a Week
- Price crossed above the Volume Weighted Average Price (VWAP) with conviction
- The breakout occurred exactly at the apex of the symmetrical triangle, a textbook technical setup
Base Formation:
- A solid base was formed between 650-750 levels from June 2024 to September 2025
- This 15-month consolidation created a strong platform for the next leg up
- The base shows higher lows, indicating persistent buying interest
- Multiple tests of the 700 level without breaking down confirmed strong institutional support
Volume Spread Analysis:
Volume Surge Characteristics:
- The breakout day witnessed volume of 11.88 million shares, representing approximately 10x the average Weekly volume
- Prior peak volume was recorded in July 2024 at around 11 million shares during a similar rally
- The volume spike confirms genuine institutional participation rather than retail speculation
- Volume during the consolidation phase remained subdued, typical of healthy base-building
Volume-Price Correlation:
- The recent volume expansion coincided with the Q2 FY25 earnings announcement
- Volume preceded the price breakout, suggesting informed accumulation
- Absence of distribution volume during the decline from 1,049 to 650 indicates strong hands holding positions
Support and Resistance Levels:
Key Support Zones:
- Immediate support: 850-860 (breakout point and previous resistance turned support)
- Secondary support: 780-800 (VWAP zone)
- Major support: 700-720 (top of the consolidation base)
- Critical support: 650 (lower boundary of the triangle pattern)
Key Resistance Levels:
- Immediate resistance: 900-920 (psychological level and minor supply zone)
- Major resistance: 1,000-1,049 (previous 52-week high from August 2024)
- Extended resistance: 1,150-1,200 (measured move from triangle breakout)
- Long-term resistance: 1,300-1,350 (Fibonacci extension based on prior rally)
Technical Pattern Recognition:
Symmetrical Triangle Breakout:
- The pattern took 18 months to form, indicating a significant accumulation phase
- Pattern reliability is high, given the strong volume confirmation
- The apex breakout timing increases the probability of follow-through momentum
Volume Price Analysis (VPA):
- The breakout exhibits classic VPA characteristics: rising prices on expanding volume
- No signs of climactic selling during the base formation
- Professional money accumulation is evident from the volume footprint
- Current setup suggests continuation rather than exhaustion
Sectoral Backdrop and Industry Analysis:
Indian Alcohol Sector Overview:
- The Indian alcohol market is estimated at USD 60.11 billion in 2025 and expected to reach USD 101.10 billion by 2032, exhibiting a CAGR of 7.7%
- India's growing middle class is becoming more affluent, driving increased alcohol consumption as disposable incomes rise
- India's total alcoholic beverage sector is the world's third largest, with yearly sales of $44 billion
- In India, beverage alcohol volumes rose 4% in the first half of 2024, driven by strong demand for premium-plus spirits
Growth Drivers:
- Premiumization trend as consumers upgrade to higher-quality spirits and beer
- Expanding retail distribution channels, including modern trade and e-commerce
- Rising disposable incomes and urbanization are creating a larger addressable market
- Changing social attitudes toward moderate alcohol consumption, especially among younger demographics
- Tourism and hospitality sector recovery post-pandemic, boosting on-premise consumption
Sector Risks and Challenges:
- Heavy regulatory environment with varying state-level policies on alcohol sales
- High taxation is impacting margins and affordability
- Licensing complexities and distribution restrictions in certain states
- Raw material price volatility affecting input costs
- Social stigma and health concerns are potentially limiting market expansion
Fundamental Analysis:
Recent Financial Performance:
- In Q2 FY26, net profit rose 61% year-on-year, with revenue growing 20% to ₹718 crore, while EBITDA margin expanded to 6.25% from 4.62%
- For H1 FY26, total revenue reached ₹1,356 crore, marking 13% growth, with net profit rising 30% to ₹61 crore
- Margins saw healthy growth at 24.9% compared to 18.9% last year
- The strong Q2 results were the primary catalyst for the recent breakout
Company Fundamentals:
- Market capitalization stands at approximately 2,042 crore with annual revenue of 679 crore and profit of 143 crore
- Promoter holding is strong at 74.4%, indicating management confidence
- The company has delivered moderate sales growth of 6.32% over the past five years
- GM Breweries operates with no debt and demonstrates good profit growth
Valuation Metrics:
- As of October 9, 2025, GM Breweries is trading at a discount of 16% based on median intrinsic value estimates
- The stock trades in the small-cap segment with relatively lower liquidity compared to large-cap peers
- Recent earnings surprise has likely re-rated the stock, but valuation remains reasonable relative to growth
- P/E multiple expansion likely as margins improve and profitability accelerates
Competitive Positioning:
- Compared to industry leaders, GM Breweries lacks strong brand value and has limited market coverage
- The company operates primarily in select states, providing regional focus but limiting nationwide presence
- Opportunity exists to expand distribution footprint and invest in brand building
- Focus on operational efficiency and margin expansion differentiates from competitors
Bull Case Arguments:
- Strong earnings momentum with 61% profit growth, indicating operational leverage
- Technical breakout from 18-month base supported by exceptional volume confirms institutional interest
- Favourable industry tailwinds with 7.7% sector CAGR supporting long-term growth
- Debt-free balance sheet provides financial flexibility for expansion
- High promoter holding at 74.4% aligns management interests with shareholders
- Current valuation at 16% discount to intrinsic value offers a margin of safety
Bear Case Considerations:
- Limited brand recognition compared to established industry players
- Restricted geographic presence limits growth potential
- Heavy regulatory oversight and taxation pose ongoing challenges
- Small-cap liquidity concerns may lead to higher volatility
- Dependence on discretionary consumer spending makes business cyclical
- Historical revenue growth of 6.32% over five years is modest
Monitoring and Review Parameters:
Key Metrics to Track:
- Quarterly revenue and profit growth rates versus expectations
- Margin expansion, sustainability and operating leverage
- Volume growth in key markets and product categories
- Market share gains or losses relative to competitors
- Any changes in promoter holding or institutional ownership patterns
Technical Review Points:
- Weekly closing price relative to the breakout level of 850
- Volume sustainability above 3-4 million shares daily average
- Formation of higher highs and higher lows to confirm an uptrend
- Any breakdown below 780 would invalidate the bullish thesis
- RSI and momentum indicators for early signs of exhaustion
Risk Triggers:
- Fundamental: Any quarterly earnings miss or margin compression
- Technical: Weekly close below 780 or breach of major support zones
- Sectoral: Adverse regulatory changes or significant tax increases
- Market: Broader market correction below key support levels affecting risk appetite
- Time-based: If the stock underperforms the sector or broader market for two consecutive quarters
Full Coverage on my Newsletter this Week
Keep in the Watchlist and DOYR.
NO RECO. For Buy/Sell.
📌Thank you for exploring my idea! I hope you found it valuable.
🙏FOLLOW for more
👍BOOST if you found it useful.
✍️COMMENT below with your views.
Meanwhile, check out my other stock ideas on the right side until this trade is activated. I would love your feedback.
As per the Latest SEBI Mandate, this isn't a Trading/Investment RECOMMENDATION nor for Educational Purposes; it is just for Informational purposes only. The chart data used is 3 Months old, as Showing Live Chart Data is not allowed according to the New SEBI Mandate.
Disclaimer: "I am not a SEBI REGISTERED RESEARCH ANALYST AND INVESTMENT ADVISER."
This analysis is intended solely for informational purposes and should not be interpreted as financial advice. It is advisable to consult a qualified financial advisor or conduct thorough research before making investment decisions.
LICI, a strong name about to breakout?LICI is consolidating for almost 130 days (Good period of consolidation) after giving 100% move in 80 days.
-In DTL, BO anticipation if retest again.
-Good shakeouts
-1003 good support (AVWAP from ATH)

Olectra Greentech Limited setting up for big moveOlectra Greentech Limited, a mojor electric bus company, in DTL BO zone.
Also anticipation of BO of AVWAP from 52W High.

BSE, will it breach this AVWAP?Lets learn new thing:
AVWAP (stands for Anchored Volume Weighted Average Price): the average Price of a stock weighted by Volume from an Anchored point (swing low or swing high are good anchor points). Think like moving average but volume also include (not entirely true but to keep easy you can think like that) so it become more powerful as it involves both price and volume.
Now come to BSE, check white AVWAP how it was major resistance and gave fake breakout too. But when it breaches, it gave good Breakout (BO).
Again new blue AVWAP acting as good resistance, now have to check how it acted when it breach this line.
If it will give good breakout, add this powerful tool to your charts.
To learn more about this tool, DM me.
No sell/buy recommendations

Jubilant Ingrevia 120424Here I look at a weekly and daily chart of Jubilant Ingrevia. Which has recently broken out after several months of consolidation. The breakout gains further importance as it has also crossed couple of significant AVWAP lines.

SOLAR INDUSTRIES 28/06/2023I analyze chart patterns, price-volume analysis, along with volume profile and avwap. Also check the momentum in daily and weekly charts. Finally make a risk-reward trade setup.

SEQUENT SCIENTIFIC 20/06/2023 Price Volume Analysis, AVWAP, Volume Profile. Chart pattern. Risk-reward scenarios.

LALPATHLAB ANALYSIS 17/06/2023I analyse Lalpathlab on weekly and daily chart. Price, Volume, AVWAP, Volume Profile, other technical indicators are used. Possible targets and risk/reward is also discussed.

Honeywell Automation I analyze the chart of Honeywell Automation - price, volume, trendlines, other technical data points across daily and weekly timeframe.

HDFC Life 04/06/023 Price-volume and technical analysisHere I do price-volume analysis of HDFC Life, in both daily and weekly chart. Also I look at few technical indicators like EMAs, RSI, AVWAP do understand the structure of the chart.

SGX NIFTY- Above 18k Inverted H&S Breakout!Attached: SGX NIFTY Daily Live Market Chart as of 27th April 2023
Price has put in a Clean Inverted Head & Shoulders Breakout signaling further Upside from here and BULLs in the Driver Seat!
I have used Fib Extension Ratios of
3= 1
3= 1.272
3= 1.618
to get Upside Targets for this Rally
The Inverted Head & Shoulder Measured Pattern Target comes at Target 2 in the Chart which is approx. 18950
On a Further Note, Price has also cleared all the Overhead Supply in the form of Anchored VWAPs and so the Path is Clear for SGX NIFTY to rocket upwards!
Stop Loss/ View Invalidates below 17600

Nifty Futures AVWAP Chart AnalysisAttached: Nifty Futures Daily Chart as of 24th April 2023
SELF EXPLANATORY Chart (all the different colored lines are Anchored VWAPs)
Price has closed above AVWAP from 13th April High (recent Swing) and is all set to head higher from here for POC @ 17900 (Volume Profile concept)

SGX NIFTY- Anchored VWAP Detailed Analysis!Attached: SGXNIFTY Daily Live Market Chart as of 24th March 2023 (post 12:00 AM)
I am sharing this to bring to your attention the following points:
1. Price is currently consolidating below a Cluster of Anchored VWAPs (labelled on the chart). These same AVWAPs have acted as support in the past, see from where Price had rallied off in Oct 2022 for example
2. Price is also consolidating in the Lower Half of the Falling Trend Channel drawn from the Dec 2022 Highs
3. 16800 is the Make or Break Level using the Law of Polarity (labelled on the chart)
So when Price breaks⚠️ down these 3 Confluences, expect the 🐻Bear Market/ Bear Trend📉 to ACCELERATE 🩸!
And that will then Open the AVWAP Downside Targets🎯 as follows:
T1= 16400
T2= 15800
T3= 15300
Also these are the Very Same Downside Targets that I have been calling for when Nifty was trading at 18000 in the first week of Jan 2023.
In addition to all of this you would also notice my Elliot Wave marking for the B Wave false breakout to New Highs. We are in Wave C of a Bear Market presently.
Best,
Siddharth Bhansali

Aurobindo Pharma: Bullish SetupNSE:AUROPHARMA has quite a few interesting setup traits:
In the volume profile one can see the two PoC (Point of Control) - one during downtrend - another during uptrend - placed at 444 and 474 level.
The PoC at 474 is really interesting. Means the interest is at the sustained levels of price.
Absolute high volume
Uptick in Momentum (RSI).
Price Structure - was creating LH-LL. Then last one month (since 1st week of Feb) it actually pulled up and able to deny the structure by making a High higher than previous lower-high. That denotes the end of corrective phase.
And then price is actually inside a Darvas box since last two weeks.
Today it seems getting out of the Darvas box with volume and momentum.
See the two AVWAP placements :) The upper line avwap line it will touch as T1.
Please keep the SL at downtrend PoC at 445.

RVNL - Simplest Avwap Chart On a weekly timeframe the chart is religiously following its anchored VWAP since the march 2020 low.
It has been creating accumulation zones shown in the BLUE color boxes shifting UP

Strong close by stockStock was consolidating in a range after giving a strong upmove. Today the stock has given a strong close and close above AVWAP ST Dev 1. Can be a good pick for a positional trade.

Reversal play in Shyam Metalics (#SHYAMMETL) With Nifty Metal Index breaking out today , lets see how Shyam Metalics NSE:SHYAMMETL can play out from here...
Stock was clearly in downtrend, making Lower Highs and Lower Lows (blue & red highlights on the chart).
But it can reverse from here now. How? Here are some observations:
- It recently took support at IPO Price
- Made first Higher High (green highlight)
- Currently facing resistance from 14th Sep AVWAP (Rs. 354).
- Can take support at 20th Dec AVWAP (Rs. 338)
- Crossing above Rs. 354 will most probably break the support-turned resistance zone of Rs.360 too with force.
- Later, it can face resistance from 22nd July AVWAP (Rs. 383) and come to retest the Rs. 360 area.
- There should be no looking back once it crosses the 22nd July AVWAP
- Company has high ROE (above 20%) and currently trades at lower valuation multiples than its peers.
Disclaimer: Do not consider this as a trade recommendation.

Beaten down stock. Reversal possible. Strong volumesStock was in downtrend. Today it has formed a very strong candle which closed above AVWAP and High Volume Node

ESAB India - Retested AVWAPESAB India rose quickly. After that was consolidating and today tested AVWAP calculated from the recent move. Stock had high delivery qty during the recent week. A low risk setup

Banknifty analysisAn Anchored VWAP is drawn with anchor date 28th Jan 2021 which was the previous swing low. The price took support initially at 23rd Feb, 1st March. It finally broke below AVWAP on 15th March, retraced the AVWAP line on 16th March, and continued the downward trend. We could conclude that the bear has taken control of the market. It then acted as resistance on 29th April and 18th May. Price finally broke above AVWAP on 21st May which started a bull phase of the BNF. What's interesting to see here is two AVWAPs with anchor dates 28th Jan and 16th Feb (previous swing low and high respectively) almost coincide near price level 34000 for last one or two months forming a sort of zone of confluence. This must act as strong support for BNF. We must watch for this level in the near future and trade accordingly. The next immediate level of support is 33500 although not so strong.
IN SHORT- STRONG SUPPORT FOR BNF AT 34000.

BATA India Mean Reversion Setup
- Self explanatory & Annotated Chart
- Key Levels are Marked
- Enter at BO level @ 1340
- Exit at Target level @ 1445 , approx 7-8% upside
- Time Frame is few Days
- Stop Loss level for Risk as per your choice also mentioned
- High probability setup based on AVWAP Study + Multi Time Frame + Pattern + RSI
- Stock is Bullish on all time frames for a Mean Reversion (am not posting charts of other time frames but have a look for yourself)
Good Luck :)
If you find this Trade Idea helpful, please Like, Comment & follow me on Twitter to keep updated with my Trading activity & new ideas.
Note: I rarely post Ideas on Trading View platform (have only recently started)

United Spirits Ready For Bull Run Hi Folks ,
United Spirits Ready For Bull Run, Stock Analysis using Market Structure and Phase analysis with Anchored Volume Weighted Average Price hop you like it.
Thanks,
