Axis Bank | Intraday Price Behavior Using Square-Based GeometryDisclaimer:
This analysis is for educational purposes only. I am not a SEBI-registered advisor. This is not financial advice.
Educational Case Study | 1 April 2024
This idea shares an educational intraday case study on Axis Bank, focusing on how price capacity and time awareness were observed using square-based geometric methods discussed in classical market studies.
The objective is to study historical chart behavior, not to suggest trades or outcomes.
📊 Chart Context
Instrument: Axis Bank Ltd. (NSE)
Date: 1 April 2024
Timeframe: 15-minute (Intraday)
During the early part of the session, Axis Bank showed upward movement. A structured framework was applied to observe how price interacted with predefined reference levels as the session progressed.
🔍 Observational Framework Used
The low of the initial intraday structure was treated as a reference point (around 1048)
From this reference, square-based projections were observed
A level near 1064 aligned with a 45-degree projection, often associated with normal intraday price reach in historical studies
A higher projection was noted only as a contextual boundary, not an expectation
All levels were considered potential reaction zones, not fixed resistance points.
📈 Observed Intraday Behavior
Price gradually moved toward the projected zone during the session
Near this area, the market showed temporary pressure and difficulty sustaining above the level
A short-term response was observed around the projected zone
Minor price variation around the level was consistent with normal market behavior
This observation aligns with how price has historically interacted with similar geometric areas.
📘 Educational Takeaways
Square-based geometry can help outline logical intraday price capacity
The 45-degree projection often acts as an area of interest, not a precise barrier
Time awareness adds structure when observing intraday movement
Small deviations around projected zones are normal and expected
This approach encourages rule-based observation rather than precision fixation
All insights are based on historical chart study only.
📌 Important Note
This case study is shared strictly for learning and research purposes.
Geometric levels and time windows do not guarantee outcomes and should be treated as contextual analytical tools.
Market behavior may include:
Temporary pauses
Short-term pressure
Continuation or expansion depending on broader structure
🚀 Summary
This intraday case study demonstrates how price geometry and time alignment can be used to observe market behavior objectively and systematically.
More educational chart studies will follow.
AXISBANK

Axis Bank | Observed Price Reaction Near a 45° LevelCase Study – 8 November 2024
This idea presents an educational case study focused on intraday price behavior near a geometric level, specifically a 45° projection, observed on Axis Bank on 8 November 2024.
The study is shared to understand how price, time, and structure may interact around predefined geometric zones — without any predictive or advisory intent.
📊 Chart Observation
On 8 November 2024, Axis Bank moved toward a projected level derived from a 45° calculation, originating from an intraday reference point using Square-of-9–based methodology.
The projected zone appeared near 1168
During the afternoon session, price showed temporary pressure and rejection around this area
The behavior aligned with previously observed reactions near similar geometric levels
This observation highlights how markets may respond near certain structural zones, depending on context and timing.
🔍 What This Case Study Illustrates
Identifying a 0° reference from an intraday extreme
Observing price movement capacity along a 45° path
Noting time sensitivity, where reactions often occur near specific time windows
Understanding how a geometric zone can act as a potential reaction area, rather than a fixed resistance
These observations are intended to support chart study and market behavior analysis, not decision-making shortcuts.
📌 Educational Note
This post discusses observed historical behavior on charts.
Geometric levels and angles represent areas of interest, not guaranteed outcomes.
Market behavior may include:
Temporary pauses
Short-term pressure
Expansion or continuation depending on broader structure
No trade direction or execution guidance is provided.
🚀 Conclusion
This case study demonstrates how combining geometry, structure, and time can add clarity to intraday chart analysis when used objectively.
More such educational observations will follow.
Disclaimer:
This analysis is for educational purposes only. I am not a SEBI-registered advisor. This is not financial advice.

Are You a Market Student? That’s Exactly Who This Is ForDisclaimer:
This analysis is for educational purposes only. I am not a SEBI-registered advisor. This is not financial advice.
Most traders spend years searching for consistency, clarity, and a better way to interpret price behavior.
If your interest goes beyond indicators and focuses on how price and time interact structurally, then this series is meant for you.
This idea marks the beginning of a study-based series focused on classical market observation methods inspired by W.D. Gann principles — strictly from an educational and analytical perspective.
🔎 Purpose of This Series
Markets often display repetitive behavior when observed through time, price, and structure.
In this series, we will study how historical market behavior has shown:
Time and price relationships
Cyclical tendencies
Geometric price movement
Structural behavior on charts
Reactions around specific angles and zones
The objective is not prediction, but observation and understanding.
📘 What You’ll See in Upcoming Ideas
Future posts may include:
Chart-based observations
Explanation of classical concepts
Historical examples from charts
Study of time, price, and structure interaction
How older analytical methods can still be observed in modern markets
All examples are shared to study market behavior, not to suggest trades.
📌 Important Note
This is not a trading call and not a strategy recommendation.
Zones, angles, and levels discussed represent areas where markets have historically shown reactions, not guaranteed outcomes.
Markets may additionally show:
Temporary pressure
Pauses in momentum
Expansion or contraction depending on context
🚀 Moving Forward
This post serves as an introduction only.
If you are curious about cycle studies, structural analysis, and classical market observation, stay connected for future ideas.
Let’s study the market logically, objectively, and step by step.

AXISBANK - STWP Equity Snapshot________________________________________
📊 STWP Equity Snapshot – AXISBANK
(Educational | Chart-Based Interpretation)
________________________________________
📌 Intraday Reference Levels (Structure-based)
Reference Price Zone: 1308
Risk Reference (If price weakens): 1231
Observed Upside Zones: 1401 → 1462
These levels show where price may pause, react, or move faster during short-term action.
________________________________________
📌 Swing Reference Levels
(Hybrid Model | 2–5 days | Observational)
Reference Price Zone: 1308
Risk Reference (If support fails): 1210
Higher Range Zones (If strength continues): 1503 → 1649
Swing levels help understand bigger price movement, not day-to-day noise.
________________________________________
🔑 Key Levels – Daily Timeframe
Support Areas: 1266 | 1232 | 1211
Resistance Areas: 1320 | 1341 | 1375
These are zones where price previously reacted, either by stopping, reversing, or moving faster.
________________________________________
📌 What the chart is showing (Simple view)
Trend is up
Price recently moved strongly with good volume
Earlier resistance was tested and crossed
Some resistance ahead is still weak
This means buyers are active, but price may pause at higher levels.
________________________________________
📊 Chart Structure & Indicator Summary
Structure: Higher highs and higher lows
Trend: Up
Momentum: Moderate
RSI: Around 61 – strong but not overbought
Volume: Above average – healthy participation
________________________________________
🔍 STWP Market Read
AXISBANK is showing positive price structure with improving momentum.
However, since price has already moved fast, risk remains high at higher levels.
Strength is visible — but patience and risk control matter here.
________________________________________
📈 Final Outlook (Condition-Based)
Momentum: Moderate
Trend: Up
Risk: High
Volume: Moderate
________________________________________
💡 STWP Learning Note
Strong charts do not mean easy trades.
Focus on structure, risk per trade, and review, not prediction.
________________________________________
⚠️ Disclaimer
This post is shared only for educational and informational purposes.
It is not a recommendation or investment advice.
Please consult a SEBI-registered financial advisor before making any trading or investment decision.
________________________________________
📘 STWP Approach
Observe price. Respect risk.
Let structure guide decisions — not emotions.
🚀 Stay Calm. Stay Clean. Trade With Patience.
________________________________________
💬 Did this snapshot help you understand the chart better?
🔼 Boost to support structured learning
✍️ Share your views in comments
🔁 Forward to someone learning price action
👉 Follow for simple, clean STWP insights
If you want, next I can:
Convert this into a TradingView-ready post
Or make a fixed simple template for all bank stocks

Unlock India’s Derivatives Power1. The Rise of Derivatives in India
Derivatives—such as futures, options, and swaps—derive their value from underlying assets like stocks, indices, commodities, currencies, and interest rates. India’s derivatives journey began in the early 2000s when SEBI introduced index derivatives to modernize capital markets and reduce speculation in cash segments. Over time, the market matured, attracting domestic retail traders, institutional investors like mutual funds, FPIs, and corporate hedgers.
Today, the Indian derivatives market on the NSE and BSE records billions of dollars worth of contracts daily, with index options (especially Nifty and Bank Nifty) leading global volumes. The democratization of trading platforms, reduction of brokerage costs, and increased financial literacy have further strengthened participation.
2. Why Derivatives Matter for India’s Financial System
Unlocking India’s derivatives power requires recognizing the major roles derivatives play:
a. Risk Management
Derivatives allow traders and businesses to hedge against price volatility in stocks, commodities, interest rates, and currencies.
For example:
A gold importer hedges price movements using MCX gold futures.
A portfolio manager uses Nifty options to guard against market downturns.
This reduces uncertainties in business operations and enhances economic stability.
b. Price Discovery
Futures markets incorporate expectations about future prices, interest rates, demand changes, and macroeconomic events.
For example:
Rising crude oil futures may signal anticipated geopolitical tensions.
Falling index futures may reflect market caution before major policy announcements.
Thus, derivatives become a leading indicator for spot markets.
c. Liquidity Enhancement
The derivatives market trades massive volumes daily, which increases liquidity. High liquidity ensures:
Low transaction costs
Tight bid-ask spreads
Efficient entry and exit
This attracts even more participants, creating a virtuous growth cycle.
d. Leveraged Opportunities
Derivatives allow exposure to large positions with a small margin.
However, leverage is double-edged—working for and against traders. Proper risk discipline is essential.
3. Key Segments Driving India’s Derivatives Strength
a. Equity Derivatives
These dominate India’s markets.
Index Options
Nifty and Bank Nifty options are the backbone of derivatives trading.
Advantages:
Deep liquidity
Lower manipulation risk
Suitable for hedging and speculation
Single Stock Futures and Options
Used heavily by institutional players.
b. Currency Derivatives
India’s growing global trade and foreign investments make currency futures vital for:
Exporters hedging USD/INR or EUR/INR
Importers mitigating forex risk
Traders capturing arbitrage opportunities
c. Commodity Derivatives
MCX, NCDEX, and BEE provide platforms for commodity futures across:
Metals (gold, silver, aluminium)
Energy (crude oil, natural gas)
Agriculture (soybean, cotton, sugar)
This reduces volatility for farmers, industries, and logistics players.
d. Interest Rate Derivatives (IRD)
This segment supports:
Banks
NBFCs
Corporate treasuries
IRD helps stabilize bond markets and strengthen monetary policy transmission.
4. Technological Drivers Unlocking India’s Derivative Power
India’s derivatives boom is heavily powered by technology:
a. High-Speed Trading Platforms
Advanced order-matching engines on NSE and BSE allow microsecond-level execution.
b. Algorithmic and Quant Trading
AI and mathematical models enable:
Auto-trading systems
Statistical arbitrage
Options strategies like iron condors, butterflies, spreads
These bring efficiency and sophistication.
c. Mobile Trading Revolution
Retail participation surged due to:
Zero-commission brokers
Mobile trading apps
Real-time charts and indicators
This democratizes access to derivatives for small investors.
d. Big Data Analytics
Traders now rely on:
Options chain analytics
Market depth
Implied volatility indicators
Open interest interpretation
These help decode market sentiment.
5. How Policy and Regulation Support Derivative Market Growth
a. SEBI’s Robust Regulatory Framework
SEBI ensures transparency, limits manipulation, and protects investors through:
Strict margining systems
Daily settlement
Position limits
Surveillance mechanisms
b. Stock Exchanges’ Risk-Management Systems
NSE and BSE maintain:
Real-time risk monitoring
Market-wide circuit breakers
SPAN and peak margins
These prevent destabilizing events.
c. Government Initiatives
Reforms supporting derivatives growth:
Unified market regulator
Introduction of new derivative products
Increased FPI limits
Commodity market integration with mainstream markets
6. Retail Traders: The New Power in Indian Derivatives
Retail traders now form a major part of index options volume due to:
a. Low Capital Requirements
Options require very low capital at entry compared to futures.
b. Easy-to-use platforms
Everything from charting to algo tools is readily accessible.
c. Increasing financial education
YouTube channels, apps, and online courses fuel interest.
d. Popular intraday strategies
Like:
ATM/OTM straddle-strangle
Trend-following options
Breakout futures trading
Open interest analysis
Retail participation expands market depth and liquidity.
7. Challenges Before India Fully Unlocks Derivatives Power
India must overcome several hurdles:
a. Over-Speculation Risk
Excessive speculation in weekly options can lead to:
High losses for inexperienced traders
Market volatility
b. Low Understanding of Risks
Many traders jump into derivatives without:
Risk management
Position sizing
Stop-loss planning
Education is crucial.
c. Limited Institutional Depth
While retail dominates volume, institutional participation in options is still evolving.
d. Regulatory Overhang
Frequent rule changes (like margin norms) sometimes disrupt traders.
8. The Future: Where India’s Derivatives Market Is Heading
The next decade promises massive growth through:
a. Introduction of New Products
More sectoral index derivatives
Long-term options
Interest rate swaps
Commodity options expansion
b. Retail + Institutional Balance
A healthier mix of FPIs, DIIs, and retail will bring stability.
c. Global Integration
India may become a major derivatives hub like:
Chicago
London
Singapore
d. AI-Driven Derivatives Trading
AI systems will automate:
Strategy generation
Position management
Sentiment analysis
This transforms how derivatives are traded.
Conclusion
Unlocking India’s derivatives power is not just about trading; it is about strengthening the entire financial ecosystem. Derivatives offer tools for hedging, speculation, price discovery, and economic stability. With technological innovation, rising retail participation, strong regulation, and diversified product offerings, India is positioned to become a global leader in derivatives.
For traders, investors, businesses, and policymakers, understanding derivatives is essential for navigating and benefiting from India’s fast-evolving markets. As the country continues to grow economically and digitally, derivatives will play a central role in shaping the next era of financial empowerment.

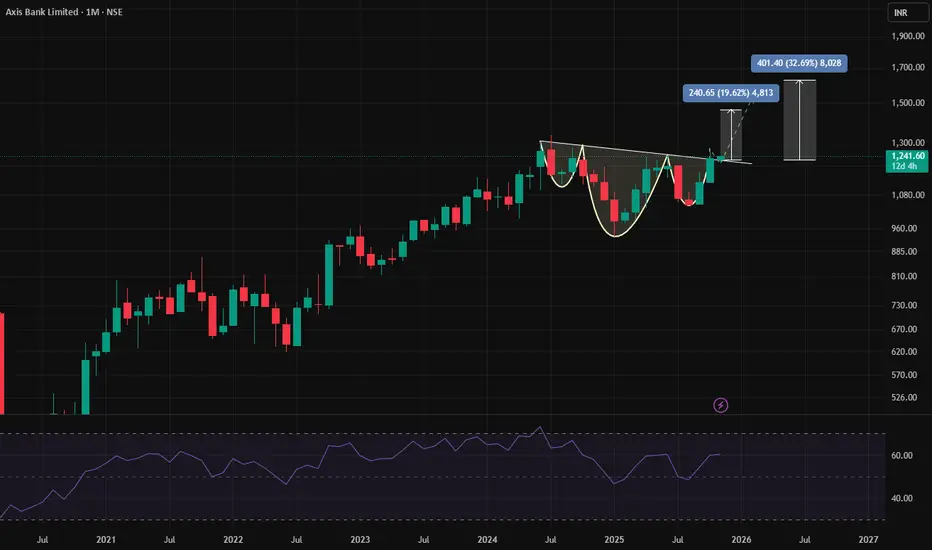
Understanding the Inverse Head & Shoulder Breakout in Axis BankEducational Article: Understanding the Inverse Head & Shoulder Breakout in Axis Bank.
Axis Bank, currently trading around ₹1241 on the monthly charts, is showing a classic inverse head & shoulder breakout at the top of a consolidation zone. This setup, combined with the Relative Strength Index (RSI) trending above 50 and preparing to cross 60, provides a strong technical case for potential upside momentum.
🔍What is an Inverse Head & Shoulder Pattern?
Structure:
Left Shoulder: Initial decline followed by a rebound.
Head: A deeper decline forming the lowest point.
Right Shoulder: A smaller decline, mirroring the left shoulder.
Neckline: The resistance line connecting the peaks of the shoulders.
Breakout Signal: When price breaks above the neckline, it indicates a reversal from bearish to bullish sentiment.
In Axis Bank’s Case:
The pattern has formed after a consolidation phase.
Price is now breaking out of the neckline, suggesting strength and potential continuation upward.
📊 Role of RSI in Confirming Breakouts
The Relative Strength Index (RSI) is a momentum oscillator that measures the speed and change of price movements.
Key Levels:
Above 50 → Indicates bullish momentum.
Crossing 60 → Adds further strength to the uptrend.
Axis Bank’s RSI:
Currently trending above 50.
Preparing to move above 60, which aligns with the breakout, reinforcing the bullish case.
🎯 Learning Points for Traders
Pattern Recognition:
Spotting inverse head & shoulder patterns helps identify potential reversals.
Always confirm with a breakout above the neckline.
Momentum Confirmation:
RSI above 50 signals strength.
A move above 60 during breakout adds conviction to the trade.
Consolidation Context:
Breakouts from consolidation zones often lead to strong directional moves.
Axis Bank’s breakout is happening after a prolonged consolidation, increasing reliability.
Risk Management:
Place stop-loss below the right shoulder or neckline to manage risk.
Avoid chasing the move without confirmation.
📝 Conclusion
The inverse head & shoulder breakout in Axis Bank, supported by RSI strength, presents a textbook example of how price action and momentum indicators work together. For learners, this is a valuable case study in combining chart patterns with RSI confirmation to identify high-probability trading opportunities.
Axis bank is forming a good buy scenario.Axis Bank is in slow selling for weeks after a strong rally and now forming a bullish scenario.
It is taking reversal from protection trendline and braking out bearish trendline.
It is also taking support from daily order block.
it is also taking rejection from 21 EMA
All other Higher duration EMAs are synced in upside direction.
Rejection point is forming a cluster of multiple parameters .
All these in combination making it an attractive buying scenario....
Note – if you liked this analysis, please boost the idea so that other can also get benefit of it.
Also follow me for notification for incoming ideas.
Also Feel free to comment if you have any input to share.
Disclaimer: This analysis is for educational purposes only and does not constitute investment advice. Please do your own research (DYOR) and check with your financial advisor before making any trading decisions.

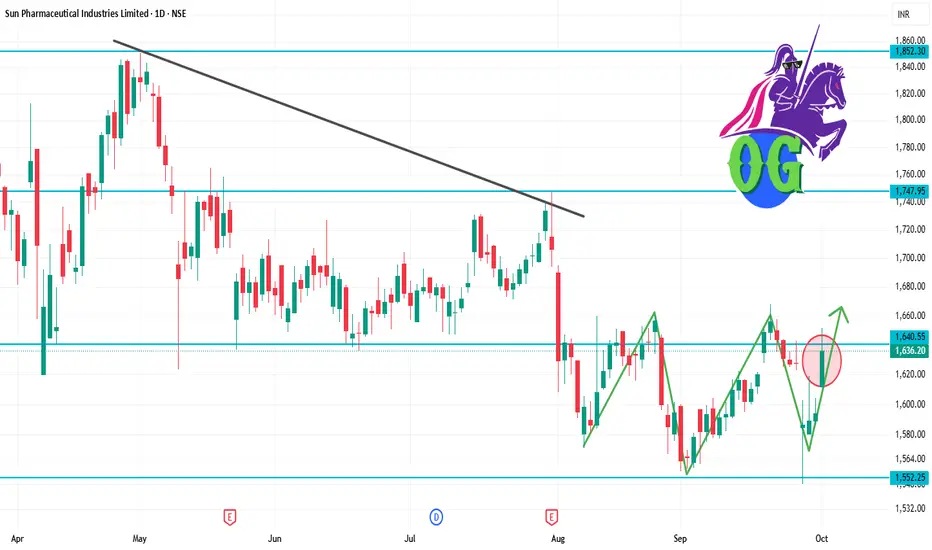
SUNPHARMA 1D Time frameCurrent Snapshot
Current Price: ₹1,636.20
52-Week High: ₹1,952.25
52-Week Low: ₹1,548.00
Strategy & Outlook
Bullish Bias: The stock is in a short-term uptrend with positive momentum indicators.
Buying Opportunity: Consider entering near support zones (₹1,600–₹1,610) with a target towards ₹1,650–₹1,670.
Risk Management: Place stop-loss orders below the support levels to manage potential downside risks.
WEAK AXIS BANK CHART ON 75MINUTE AND DAILYAXIS BANK CURRENTLY TRADING AT 1160 in cash segment and 1168 in Oct futures.
Axis Bank Oct future can be sold at 1168 with SL of 1190 for a target of 1100-1090 in Oct expiry. Also as per Gann pressure dates on 04-Oct (Market Closed) the effect will be seen on 03-Oct or 06-Oct-2025.
Lets hit the target.
📉 THIS CHANNEL IS ONLY FOR EDUCATIONAL PURPOSES.
Disclaimer: I am Not a SEBI registered analyst. I just share my positions to do paper trading and no where its a recommendation! Please do your own analysis before taking any trade.

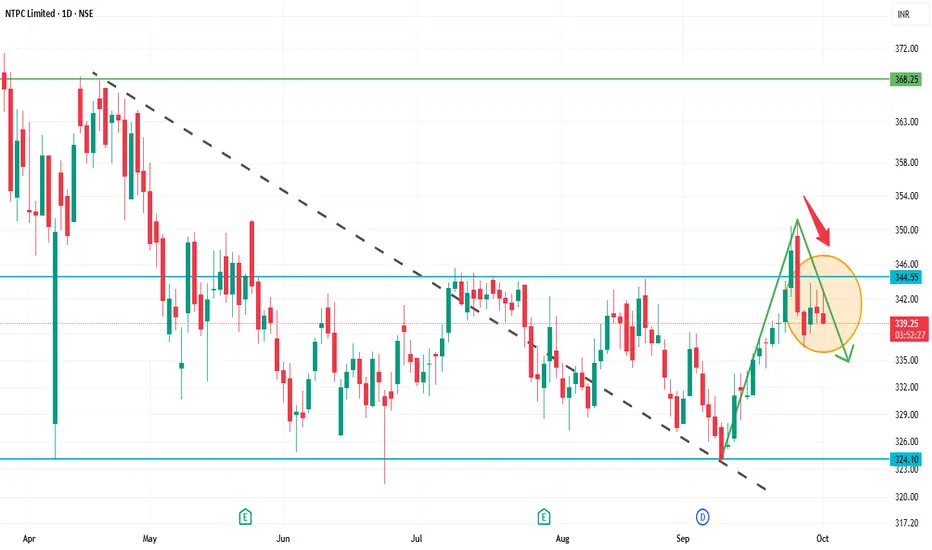
NTPC 1D Time frameOpening Price: ₹340.30
Closing Price: ₹340.25
Day Range: ₹339.45 – ₹343.05
📉 Trend Analysis
Short-Term Trend: Bearish — The stock is trading below key moving averages, confirming the bearish trend.
Medium-Term Trend: Neutral — The stock is in a consolidation phase, characterized by lower highs and lower lows.
Long-Term Trend: Neutral — No significant trend identified; the stock is trading within a range.
🔮 Conclusion
NTPC Ltd. is in a bearish trend with weak momentum.
Break below ₹335.00 could lead to further decline toward ₹330.00.
Break above ₹347.00 would indicate a potential trend reversal.
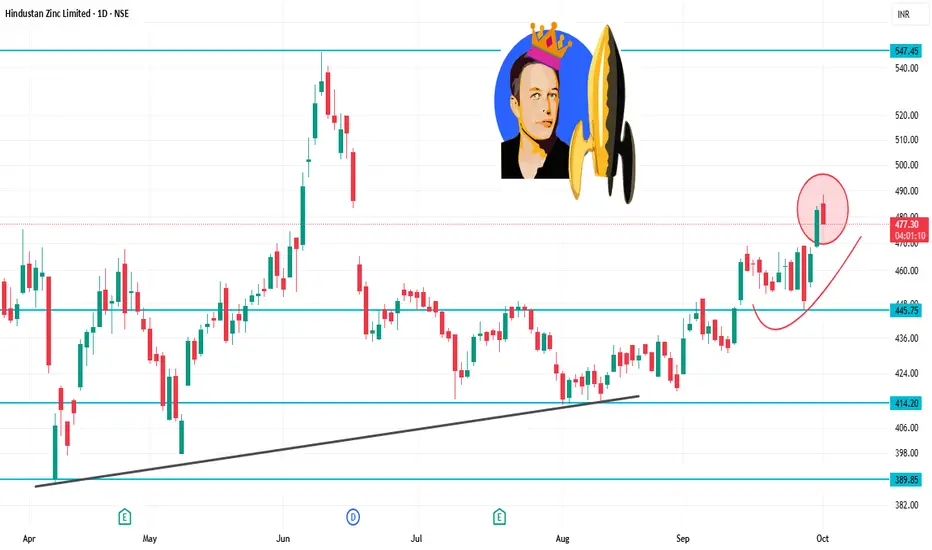
HINDZINC 1D Time frameDay Range: ₹478.35 – ₹488.40
52-Week Range: ₹378.15 – ₹575.40
Volume: 284,459 shares traded
📉 Trend Analysis
The stock is in a downtrend, characterized by:
Lower highs and lower lows.
Failure to break above resistance levels.
The short-term trend remains bearish.
🔮 Conclusion
Hindustan Zinc is in a downtrend with weak momentum.
Break below ₹470.00 could lead to further decline toward ₹460.00.
Break above ₹495.00 would indicate a potential trend reversal.
KOTAKBANK 1D Time frameCurrent Price Snapshot
Current Price: ₹1,991.60
Day’s Range: ₹1,990.50 – ₹2,015.00
52-Week Range: ₹1,679.05 – ₹2,301.90
Technical Indicators
RSI (14-day): 46.61 — indicates a neutral momentum.
MACD: -7.62 — suggests bearish momentum.
Moving Averages: Mixed signals — short-term averages are bearish, while long-term averages are bullish.
Technical Summary: Predominantly Sell signals across various indicators.
Summary
Above ₹2,015: Potential rise toward ₹2,050 – ₹2,100.
Below ₹1,990: Potential fall toward ₹1,950 – ₹1,900.
Between ₹1,950 – ₹2,010: Likely range-bound movement.

AXISBANK 1D Time frameTrading close to ₹1,130.
This is slightly below the earlier ₹1,160–₹1,170 zone we discussed, so the range shifts down.
🔼 Upside (Rise Possibility)
Immediate resistance near ₹1,140 – ₹1,145.
If price breaks and sustains above this, it can move to ₹1,155 – ₹1,165.
Strong momentum above ₹1,165 may extend toward ₹1,175.
🔽 Downside (Fall Possibility)
First support is at ₹1,120 – ₹1,115.
If that breaks, price could slip toward ₹1,105 – ₹1,095.
Closing below ₹1,095 would weaken the trend further.
✅ Summary for Today
Above ₹1,140 → rise possible till ₹1,155 – ₹1,165.
Below ₹1,120 → fall possible till ₹1,105 – ₹1,095.
Between ₹1,120 – ₹1,140 → sideways range.

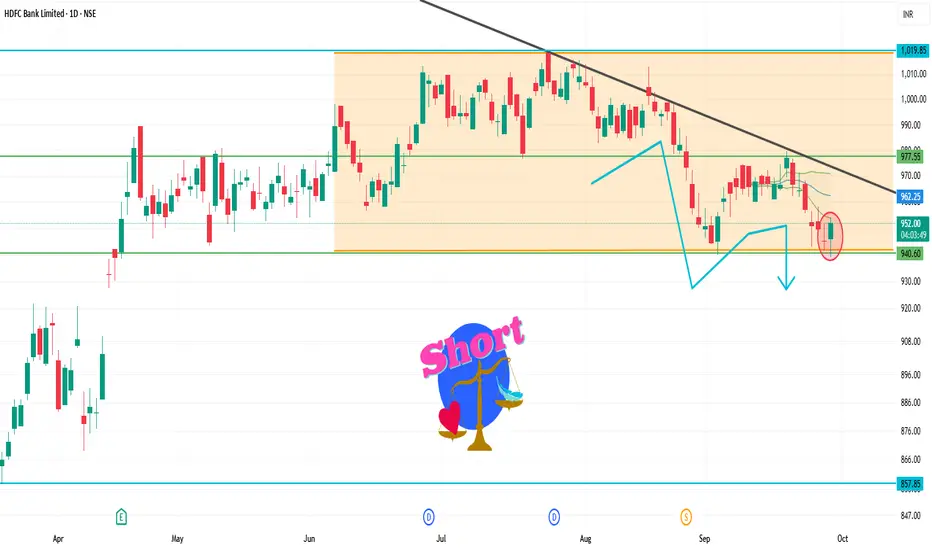
HDFCBANK 1D Time frameCurrent Market Snapshot
Current Price: ₹954.05
Opening Price: ₹945.10
Day's Range: ₹939.10 – ₹953.00
Previous Close: ₹945.05
🔑 Technical Indicators
Relative Strength Index (RSI): 35.08 – indicating a neutral to bearish condition.
Moving Average Convergence Divergence (MACD): -6.02 – suggesting bearish momentum.
Moving Averages: Trading below the 50-day and 200-day moving averages, indicating a bearish trend.
📈 Key Support & Resistance Levels
Immediate Support: ₹939
Immediate Resistance: ₹953
Pivot Point: ₹946
📉 Market Sentiment
Trend: The stock is trading below its 50-day and 200-day moving averages, indicating a bearish trend.
Volume: Trading volume is higher than average, suggesting increased investor activity.
📈 Strategy (1D Timeframe)
1. Bullish Scenario
Entry: Above ₹953
Stop-Loss: ₹939
Target: ₹960 → ₹965
2. Bearish Scenario
Entry: Below ₹939
Stop-Loss: ₹953
Target: ₹930 → ₹925
⚠️ Risk Management
Limit risk to 1% of capital per trade.
Always use stop-loss to protect against unexpected market movements.
Monitor broader market trends and sector-specific news that may impact stock performance.
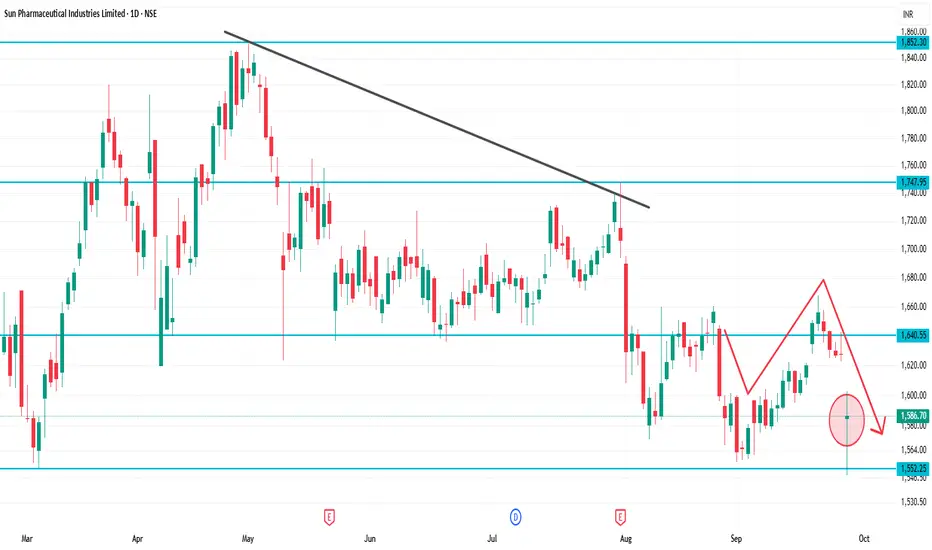
SUNPHARMA 1D Time frameCurrent Price: ~₹1,586
Day Range: ~₹1,582 – ₹1,600
52-Week High: ~₹1,960
52-Week Low: ~₹1,553
📈 Technical Outlook
Immediate Support: ₹1,580 (very close to current price)
Strong Support: ₹1,553 – ₹1,560 (52-week low zone)
Immediate Resistance: ₹1,600 – ₹1,620
Major Resistance: ₹1,650 – ₹1,670
Trend Bias:
Stock is weak, testing lower supports.
If it breaks below ₹1,580, then ₹1,553 may be tested.
A bounce is only possible if it sustains above ₹1,600.
📌 Step-by-Step Market View
Above 1,600: Chance for small recovery toward ₹1,620 – ₹1,650.
Stays between 1,580 – 1,600: Consolidation zone.
Breaks below 1,580: Weakness may extend to ₹1,553.
Axis Bank Bullish Long Term ActivationKey Points
Trend Type- Long Term
Rally is already started, but still a long way to go up.So buy on retracements.
If you have the stock than hold it for few months and more.
Like and share is appreciated.
Thank You
To understand how our coding works read the below post-
NSE:AXISBANK

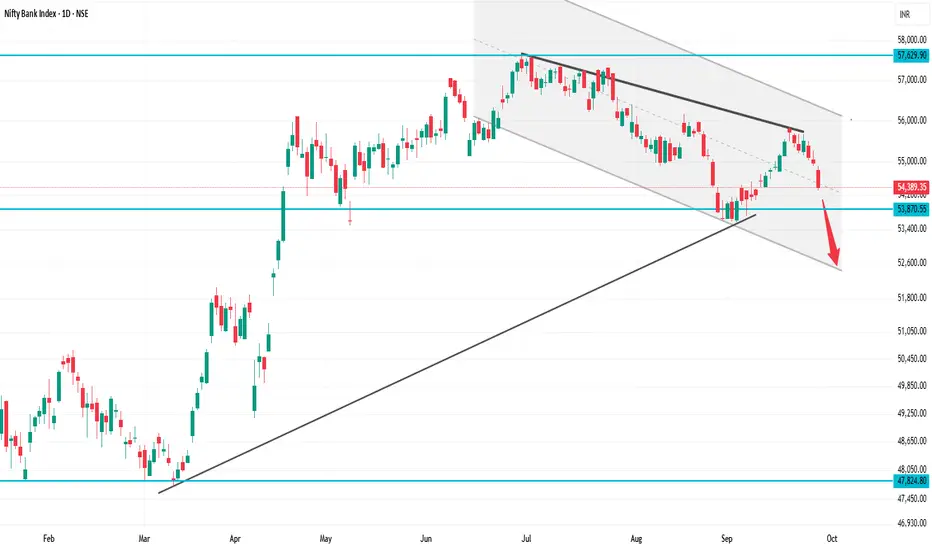
BANKNIFTY 1D Time frame
Previous Close: 55,121
Today Open: 55,061
Day’s High: 55,276
Day’s Low / Last: 54,389
⚡ Strategy
For Intraday / Short-Term Traders:
If BankNIFTY holds above 54,400 – 54,500, a small bounce toward 54,800 – 55,000 is possible.
If it fails to hold 54,400, expect more downside toward 54,000 – 53,800.
Bullish View (Only if recovery): Buy above 54,800 for targets 55,100 – 55,250, SL below 54,500.
Bearish View (Preferred): Sell on rise near 54,700 – 54,900 with SL above 55,000, targets 54,300 → 54,000.
LT 1D Time frameClosing Price: ₹3,644.40
Day’s Range: ₹3,635.70 – ₹3,704.00
Previous Close: ₹3,657.60
Change: Down –0.80%
52-Week Range: ₹2,965.30 – ₹3,963.50
Market Cap: ₹5.13 lakh crore
P/E Ratio (TTM): 32.31
Dividend Yield: 0.93%
EPS (TTM): ₹112.81
Beta: 1.20 (indicating moderate volatility)
🔑 Key Technical Levels
Immediate Support: ₹3,635 – ₹3,640
Immediate Resistance: ₹3,700 – ₹3,710
52-Week High: ₹3,963.50
52-Week Low: ₹2,965.30
📈 Technical Indicators
RSI (14-day): 45.2 – indicating a neutral condition.
MACD: Negative, suggesting bearish momentum.
Moving Averages: Trading below the 50-day and 200-day moving averages, indicating a bearish trend.
📉 Market Sentiment
Recent Performance: L&T experienced a decline of 0.80% on September 25, 2025, underperforming the broader market.
Volume: Trading volume was significantly higher than its 20-day average, indicating increased investor activity.
📈 Strategy (1D Timeframe)
1. Bullish Scenario
Entry: Above ₹3,700
Stop-Loss: ₹3,635
Target: ₹3,750 → ₹3,800
2. Bearish Scenario
Entry: Below ₹3,635
Stop-Loss: ₹3,700
Target: ₹3,600 → ₹3,550

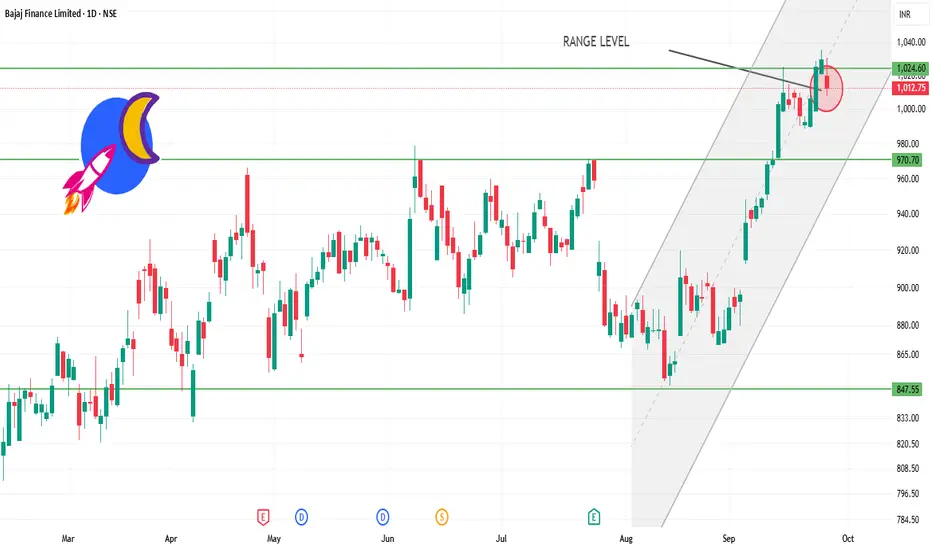
BAJFINANCE 1D time frame📊 Daily Snapshot
Closing Price: ₹1,012.75
Day’s Range: ₹1,008.00 – ₹1,031.10
Previous Close: ₹1,029.75
Change: Down –1.66%
52‑Week Range: ₹645.10 – ₹1,036.00
Market Cap: ₹6.31 lakh crore
P/E Ratio: 36.2
Dividend Yield: 2.76%
EPS (TTM): ₹28.04
Beta: 1.14 (indicating moderate volatility)
🔑 Key Technical Levels
Support Zone: ₹1,008.00 – ₹1,015.00
Resistance Zone: ₹1,031.00 – ₹1,036.00
All-Time High: ₹1,036.00
📈 Technical Indicators
RSI (14-day): 42.88 – approaching oversold territory, suggesting potential for a rebound.
MACD: Positive at 2.46, indicating bullish momentum.
Moving Averages: Trading above the 50-day and 200-day moving averages, indicating an overall uptrend.
📉 Market Sentiment
Recent Performance: Bajaj Finance experienced a decline of 1.66% on September 25, 2025, underperforming the broader market.
Volume: Trading volume was significantly higher than its 50-day average, indicating increased investor activity.
📈 Strategy (1D Timeframe)
1. Bullish Scenario
Entry: Above ₹1,031.00
Stop-Loss: ₹1,008.00
Target: ₹1,045.00 → ₹1,050.00
2. Bearish Scenario
Entry: Below ₹1,008.00
Stop-Loss: ₹1,015.00
Target: ₹995.00 → ₹990.00
SBIN 1D Time frame📊 Daily Snapshot
Closing Price: ₹861.15
Day’s Range: ₹859.95 – ₹870.15
Previous Close: ₹866.20
Change: Down –0.59%
52-Week Range: ₹680.00 – ₹880.50
Market Cap: ₹794,895 crore
P/E Ratio: 10.01
Dividend Yield: 1.85%
EPS (TTM): ₹86.06
Beta: 1.00 (indicating average market volatility)
🔑 Key Technical Levels
Support Zones: ₹860.00 – ₹854.00 – ₹844.00
Resistance Zones: ₹876.00 – ₹886.00 – ₹892.00
All-Time High: ₹912.00
Fibonacci Pivot Point: ₹865.68
📈 Strategy (1D Timeframe)
1. Bullish Scenario
Entry: Above ₹876.00
Stop-Loss: ₹859.00
Target: ₹886.00 → ₹892.00
2. Bearish Scenario
Entry: Below ₹859.00
Stop-Loss: ₹866.00
Target: ₹854.00 → ₹844.00

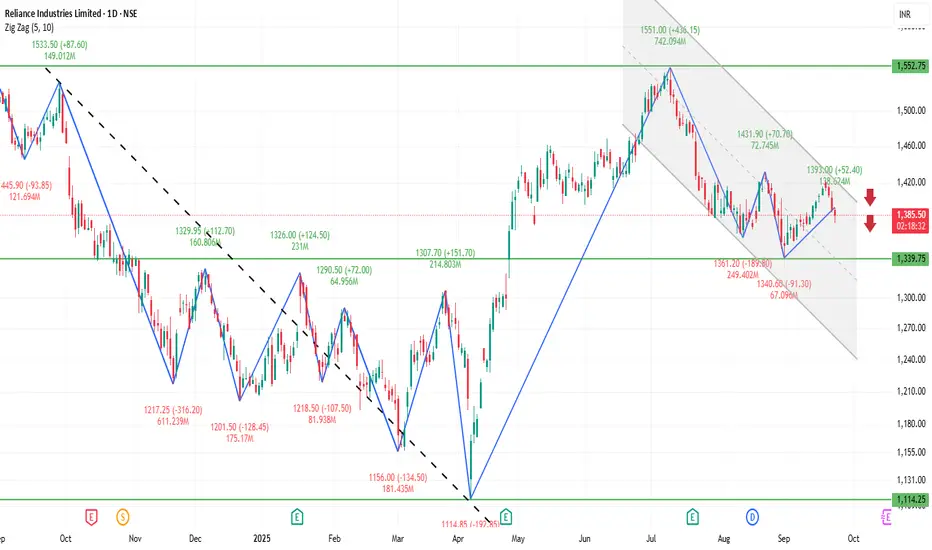
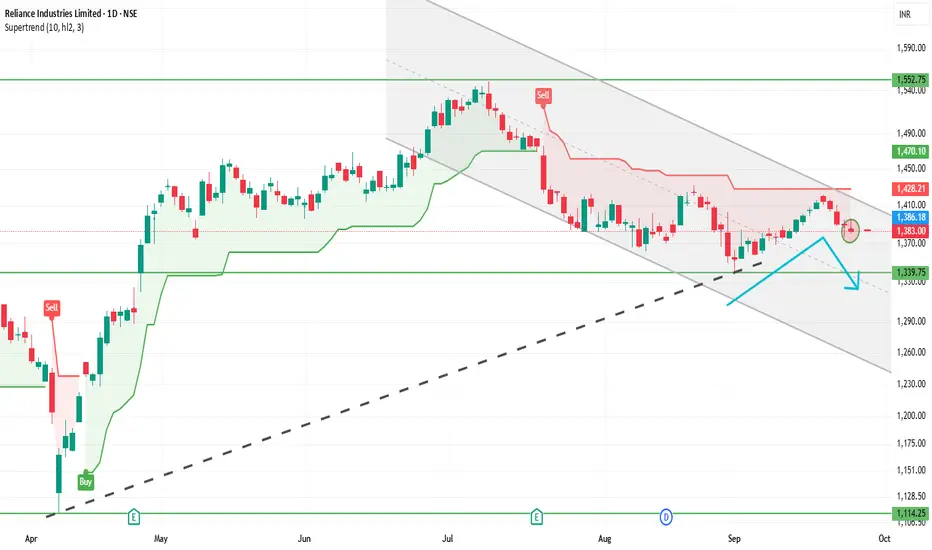
RELIANCE 1D Time frame📊 Reliance Daily (1D) Snapshot
Close: Around ₹1,382
Range of the Day: High near ₹1,396, Low near ₹1,380
Trend: Slight weakness on daily chart (mild red candle)
Stock is consolidating between support and resistance zones.
🎯 Key Daily Levels
Support Zone: ₹1,350 – ₹1,365
Strong Support: ₹1,330
Resistance Zone: ₹1,405 – ₹1,425
Strong Resistance: ₹1,430
📝 Strategy on 1D Chart
Bearish View
If price goes near ₹1,405 – ₹1,425 and fails to sustain, you can short.
Entry: ₹1,410 approx
Stop-loss: ₹1,430
Target: ₹1,365 → ₹1,350
Bullish View
If Reliance holds above ₹1,350 and shows reversal, you can buy.
Entry: ₹1,360 – ₹1,365 zone
Stop-loss: ₹1,330
Target: ₹1,405 → ₹1,425
Breakout Trade
If it closes above ₹1,430 with strong candle, expect momentum upside.
Target: ₹1,460+
Breakdown Trade
If it closes below ₹1,330, selling pressure can push it to ₹1,300 or lower.
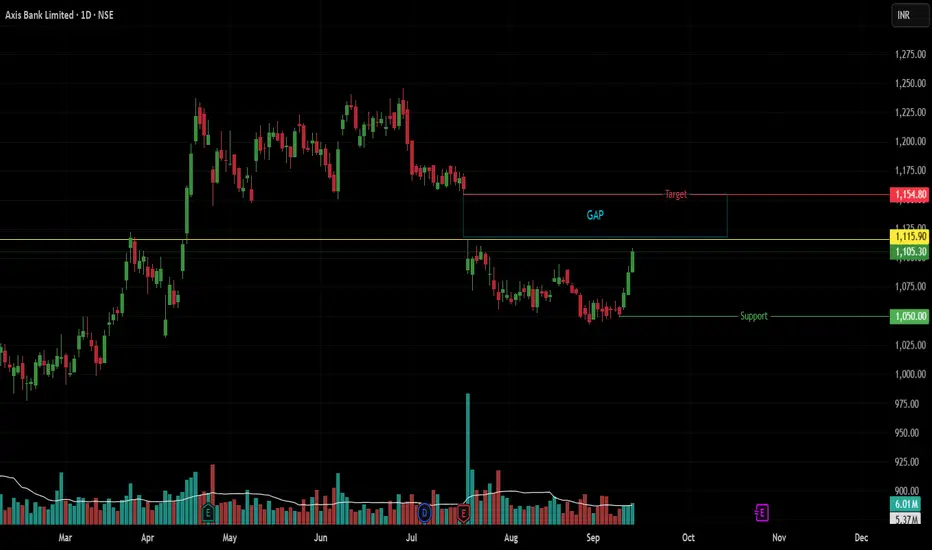
AXISBANK at ₹1115: Breakout or Rejection?Scrip: Axis Bank | Exchange: NSE | Timeframe: Daily
Summary:
Price is approaching a significant resistance level at ₹1115, which was the high of the July 18th gap-down session. A high-volume breakout above this level could trigger a move to fill the gap up to ₹1154. Conversely, a rejection at this resistance could lead to a decline.
Price Action Analysis:
Key Resistance: ₹1115 (The high of the massive gap-down day on July 18). This is the key level to watch.
Gap Analysis: The gap exists between the July 17 low (₹1154) and the July 18 open (₹1090). The first major hurdle to filling it is overcoming the ₹1115 high from that same day.
Key Support: ₹1050 (Recent Swing Low).
Scenario 1: Bullish Breakout (Gap Fill Play)
This scenario requires a true breakout, confirmed by a strong volume surge.
Trigger: A daily candle closing decisively above ₹1115.
Volume Confirmation: The breakout must be supported by significantly higher-than-average volume. This is essential for a "true" breakout and confirms real buying pressure.
Entry: High of the breakout candle (on closing basis).
Stop Loss: Low of the breakout candle.
Target: ₹1154 (To fill the July gap).
Scenario 2: Bearish Rejection (Resistance Hold)
This scenario plays out if the ₹1115 level holds as strong resistance.
Trigger: A clear bearish reversal candlestick at the ₹1115 resistance (e.g., a Shooting Star or Bearish Engulfing pattern on the daily timeframe).
Entry: Low of the reversal candle.
Stop Loss: High of the reversal candle.
Target: ₹1050.
Disclaimer: This is a technical analysis idea and not financial advice. Trading carries a risk of loss. Past performance is not indicative of future results. Always conduct your own research and manage your risk appropriately.
RELIANCE 1D Time frame📍 Current Price Context
Trading around ₹1,386
Price is near a resistance zone → important level to watch.
🔍 Key Levels
Immediate resistance: ₹1,380–₹1,390 (current zone)
Next resistance: ₹1,420–₹1,450 (if breakout happens)
Immediate support: ₹1,350–₹1,360
Stronger support: ₹1,320–₹1,330
📊 Indicators & Trend
Price is just below resistance, so breakout or rejection will decide the move.
RSI near neutral → neither overbought nor oversold.
Structure looks range-bound, but slightly bullish as long as it holds above ₹1,350.
🔮 Possible Scenarios
Bullish breakout → If Reliance sustains above ₹1,390–₹1,400 with volume, next upside target is ₹1,420–₹1,450.
Sideways move → May trade between ₹1,350–₹1,390 until momentum builds.
Bearish pullback → If it fails at resistance, price could slip toward ₹1,350, and if broken, then ₹1,320.
👉 At the current level (₹1,386), Reliance is at a decisive zone. Breakout above ₹1,390 will be bullish, while rejection could send it back to supports.