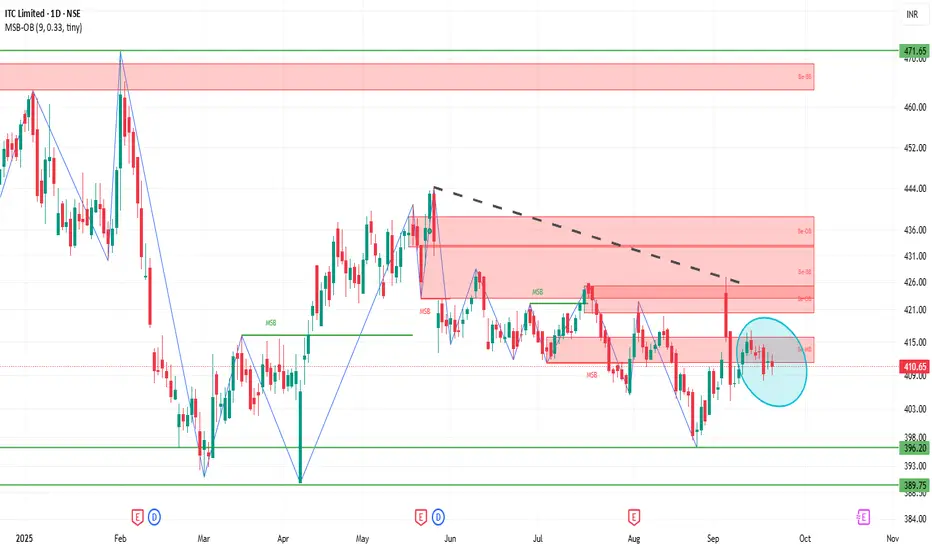
ITC 1D Time frameCurrent Price: Please confirm, but ITC is trading near 440–445 zone recently.
Current Trend: Stock is in consolidation after a recent decline; sideways movement visible.
Support Zone: Strong support lies at 435 – 438. If this holds, stock may bounce.
Resistance Zone: Major resistance is around 450 – 455. A breakout above 455 can bring fresh upside.
Indicators: Daily candles show buyers trying to defend lower levels, but volume is moderate.
Outlook:
Above 455 → bullish momentum may return.
Below 435 → weakness can extend toward 425.
👉 In short:
Range: 435 – 455.
Neutral tone, waiting for breakout.
AXISBANK
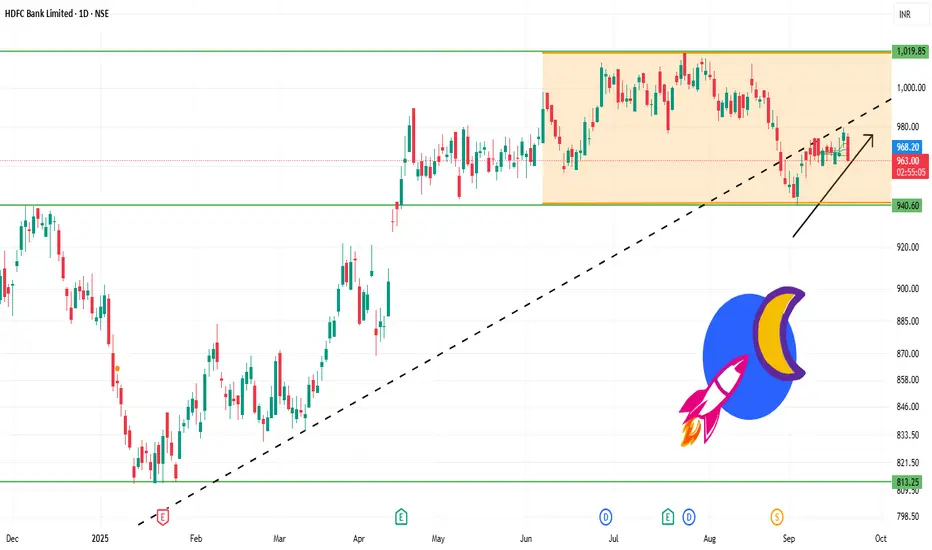
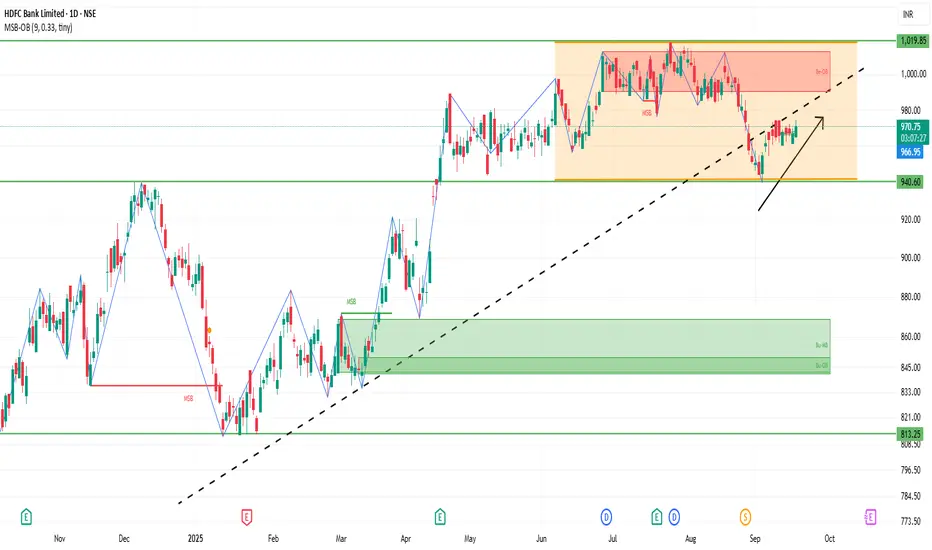
HDFCBANK 1D Time frameTrend
Trading around ₹967 – ₹970.
Stock is in a consolidation phase for the past few months.
Long-term trend is intact since it is above the 200-day moving average.
Support Levels
₹960 – ₹965 → immediate support zone.
₹945 – ₹950 → stronger support; if this breaks, stock may weaken further.
Resistance Levels
₹970 – ₹975 → immediate resistance; stock is struggling to cross this area.
₹980 – ₹992 → next major resistance; breakout above this could open path to ₹1,020.
Indicators
RSI near 55 → neutral to mildly bullish, not overbought.
MACD positive, showing some upward momentum.
Short-term moving averages are mixed, but long-term support remains strong.
Price Action
Range-bound between ₹960 – ₹975.
Breakout or breakdown from this range will decide the next trend.
✅ Facts & Insights
Fact 1: Above ₹975, HDFC Bank can rally towards ₹980 – ₹992 and possibly ₹1,020.
Fact 2: Below ₹960, stock may slip to ₹945 – ₹950, and deeper to ₹920 – ₹900 if weakness continues.
Fact 3: Long-term outlook remains positive, but short-term is sideways until a breakout.
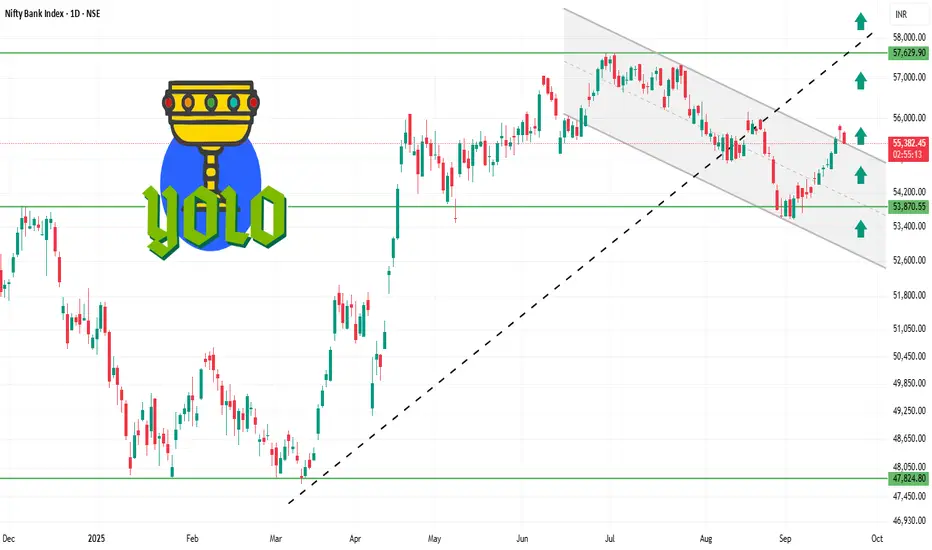
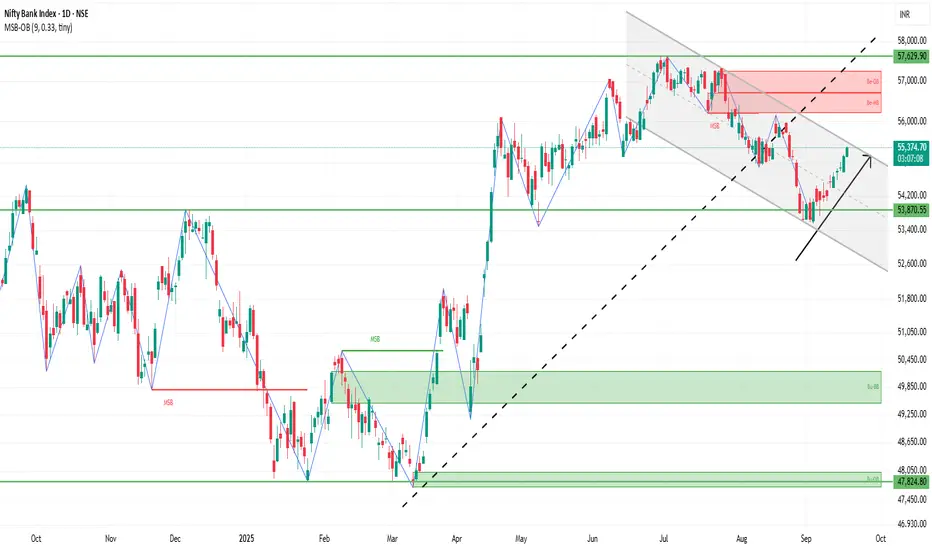
BANKNIFTY 1D Time frame✅ Current Facts
Current Level: ~ 55,400 – 55,480
Trend: Mildly bullish; trading above short-term moving averages (20-day & 50-day EMA).
Momentum Indicators:
RSI (14-day): ~61 → bullish but not overbought.
MACD: Positive → supporting the upward trend.
Price Action: Daily candles show small upper wicks → minor profit-taking near resistance.
⚙️ Outlook
Bullish Scenario:
Holding above 55,350 → retest 55,550–55,600 and possibly 55,700–55,750.
Range / Consolidation:
Price oscillates between 55,350 – 55,550 → sideways trading likely.
Bearish Scenario:
Close below 55,350 → downside risk toward 55,150–55,200 or lower.
⚠️ Key Facts
55,400 – 55,500 is acting as a short-term pivot: above it favors bulls, below it favors bears.
Resistance at 55,550–55,600 is the first hurdle; breakout here can lead to further upside.
Support at 55,300–55,350 is critical; failing to hold may lead to short-term correction.
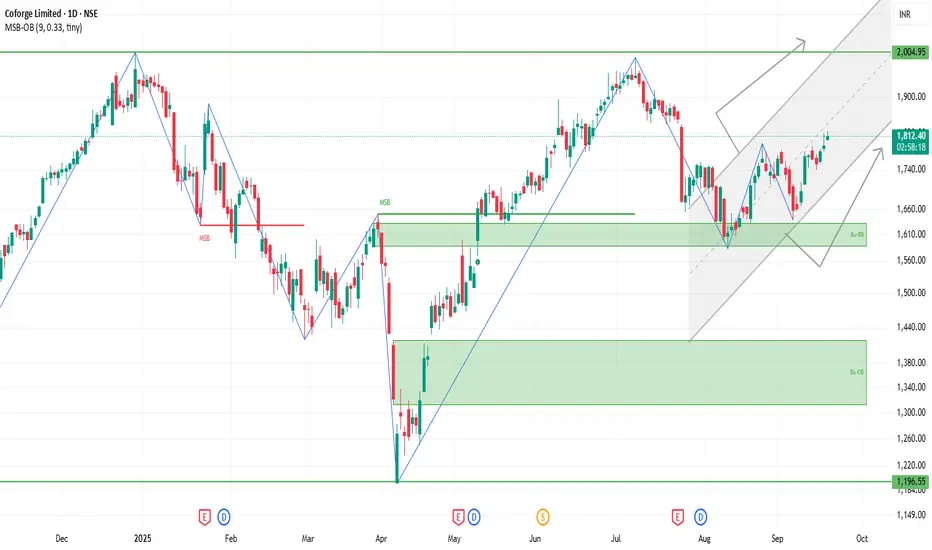
COFORGE 1D Time frameCurrent Snapshot
Price is trading near ₹1,812.
Stock is showing good strength above short-term and long-term moving averages.
Volatility is moderate, so sharp intraday swings are possible.
⚙️ Indicators / Momentum
Moving Averages: All key averages (short, medium, long) are bullish.
MACD / Momentum: Positive, supporting upside.
RSI: Slightly high, showing strength but near overbought zone → chances of small pullback.
📌 Key Levels
Immediate Resistance: ₹1,820 – ₹1,835.
Immediate Support: ₹1,790 – ₹1,800.
Stronger Support: ₹1,750 – ₹1,760 if weakness extends.
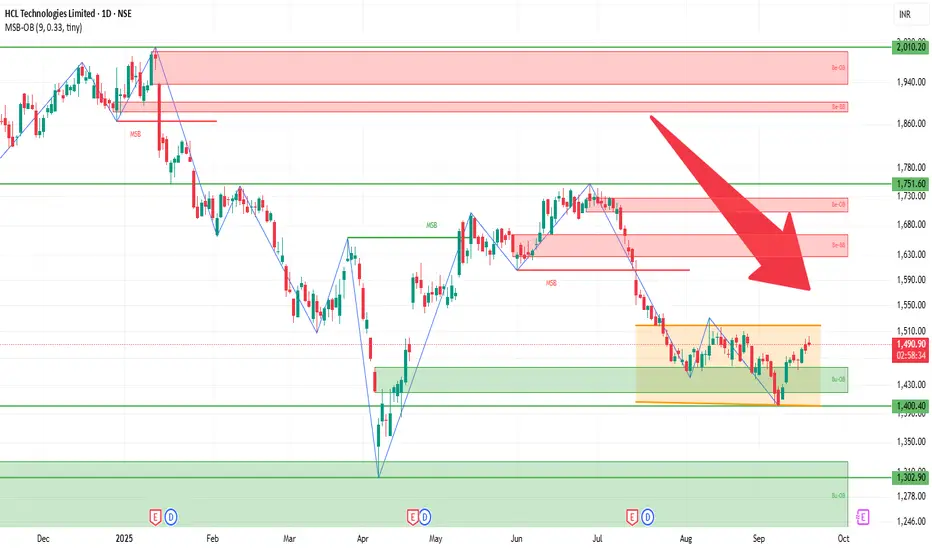
HCLTECH 1D Time frameCurrent Picture
Share price is ~ ₹1,499-₹1,505.
Recent momentum has been upward; the stock is trading above most moving averages—short-, medium-, and long-term.
Indicators are generally favoring continuation of the uptrend.
⚙️ Indicators / Momentum
Many oscillators (RSI, MACD, CCI etc.) are in bullish territory.
Moving averages from 5-, 10-, 20-, 50-, 100- to 200‐day are all aligned bullish (price above them).
Volatility is moderate to high — good movement, but also risk of pullbacks.
📌 Key Support & Resistance Levels
Immediate Resistance: around ₹1,505-₹1,515.
Immediate Support: near ₹1,480-₹1,490.
Stronger support further down around ₹1,400-₹1,420 in case of sharper correction.
✅ Outlook & Risks
Short term bias is bullish as long as price holds above the immediate support (≈ ₹1,480).
If resistance around ₹1,510 breaks decisively, more upside is likely.
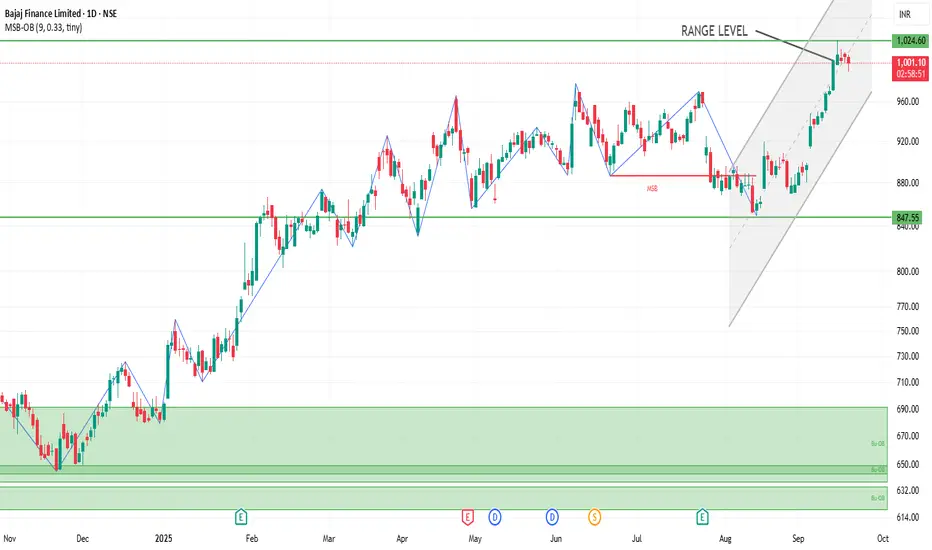
BAJFINANCE 1D Time frameCurrent Overview
Price is trading around ₹995 – ₹1,008.
Recently touched a 52-week high near ₹1,025.
Stock is moving above 50-day and 200-day moving averages, showing a strong uptrend.
⚙️ Indicators (Daily)
RSI (14) → Slightly overbought, but still stable.
MACD & Momentum → Mixed to positive, buyers still in control.
Volume → Strong volume seen near recent highs, showing active participation.
📌 Key Levels
Immediate Resistance: ₹1,010 – ₹1,025 (recent top).
Immediate Support: ₹995 – ₹1,000 (nearby cushion).
Stronger Support: ₹950 – ₹980 zone (50 & 100-day moving averages).
BANKNIFTY 1D Time frame📍 Current Price
BANKNIFTY is trading around 55,319.55, up 0.31% for the day.
🛑 Support Levels (Downside)
55,146.55: Recent low; immediate support.
55,000: Psychological level; key support zone.
54,777.75: Stronger support; breaking this may trigger a larger sell-off.
🔺 Resistance Levels (Upside)
55,397.05: Recent high; near-term resistance.
55,500: Round number resistance; next hurdle.
55,628.40: Strong resistance; breakout here may extend uptrend.
✅ Trend & Outlook
The trend is mildly bullish; price is above key support zones and moving averages.
Resistance is nearby; unless BANKNIFTY breaks 55,500–55,628 decisively, upward move may face pressure.
Downside risk exists if it falls below 55,146–55,000.
HDFCBANK 1D Time frameCurrent Stock Price
Current Price: ₹966.85
Day’s Range: ₹965.15 – ₹974.40
52-Week Range: ₹806.50 – ₹1,018.85
Market Cap: ₹14.88 lakh crore
P/E Ratio: 21.03
EPS (TTM): ₹45.97
Dividend Yield: 1.13%
Book Value: ₹339.84
📈 Trend & Outlook
Short-Term Trend: Mildly bullish; stock showing positive movement in recent sessions.
Resistance Levels: ₹974.40 (day’s high), ₹1,018.85 (52-week high).
Support Levels: ₹965.15 (day’s low), ₹950.00 (recent low).
Investor Sentiment: Positive, supported by institutional buying and favorable outlook.
🧭 Key Notes
Stock has room to move higher if it breaks near-term resistance.
If it falls below support, downside may extend to ₹950 or lower.
Overall, bulls are slightly stronger, but watch resistance for profit booking.
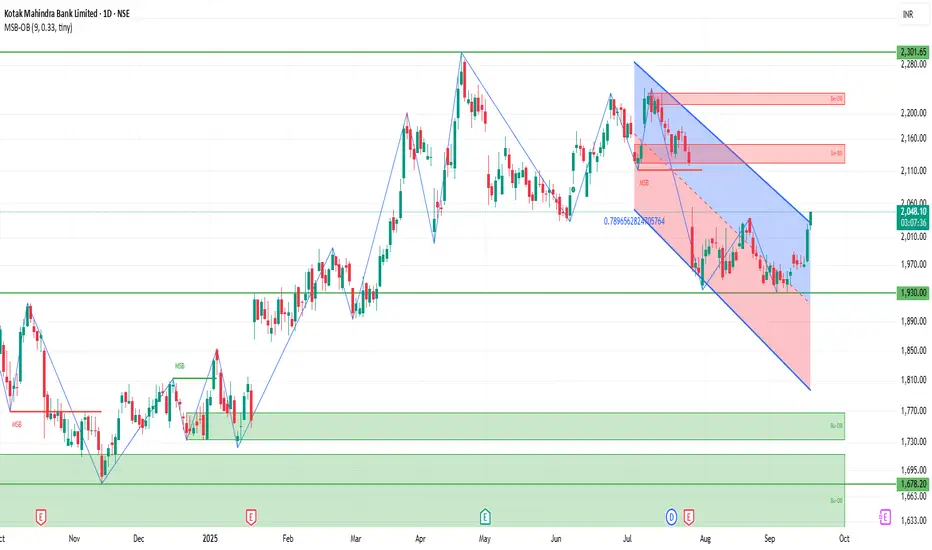
KOTAKBANK 1D Time frameCurrent Stock Price
Current Price: ₹2,045.60
Day’s Range: ₹2,020.30 – ₹2,045.60
52-Week Range: ₹1,679.05 – ₹2,301.90
Market Cap: ₹4.05 lakh crore
P/E Ratio (TTM): 20.47
EPS (TTM): ₹96.30
Dividend Yield: 0.12%
Book Value: ₹740.29
📈 Trend & Outlook
Short-Term Trend: Bullish; the stock is trading above key support levels and showing positive momentum.
Resistance Levels: ₹2,045.60 (day’s high), ₹2,301.90 (52-week high).
Support Levels: ₹2,020.30 (day’s low), ₹2,000.00 (psychological support).
Investor Sentiment: Positive, with strong institutional interest and favorable analyst outlooks.
🧭 Analyst Insights
Valuation: The stock is trading at a P/E ratio of 20.47, which is slightly above the sector average of 19.82, indicating a premium valuation.
Growth Prospects: The bank's strong earnings growth and robust capital position support its premium valuation.
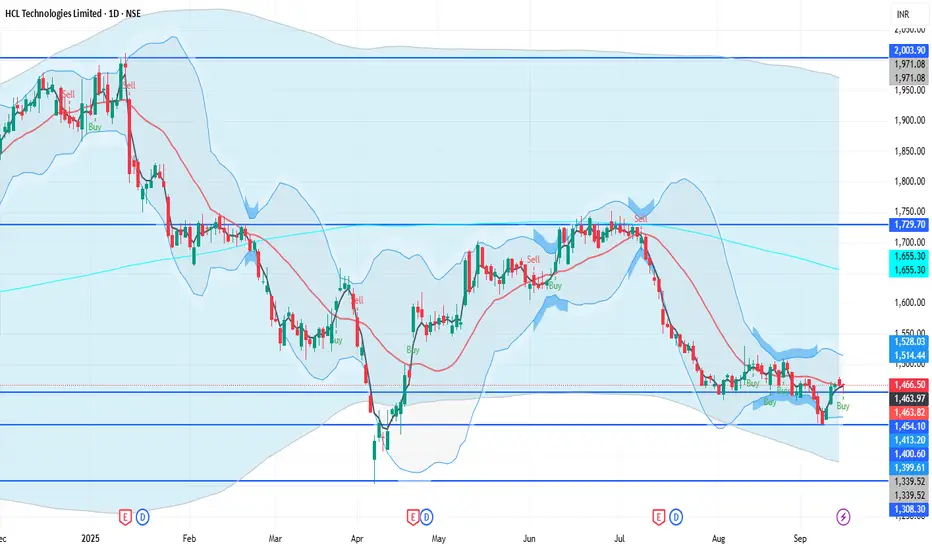
HCLTECH 1D Time frameUpdated Snapshot
Current Price: ₹1,466
Day’s Range: ₹1,452 – ₹1,467
Previous Close: ₹1,467.20
🔹 Support & Resistance
Support 1: ₹1,452 – ₹1,450
Support 2: ₹1,430 – ₹1,420
Resistance 1: ₹1,470 – ₹1,475
Resistance 2: ₹1,490 – ₹1,500
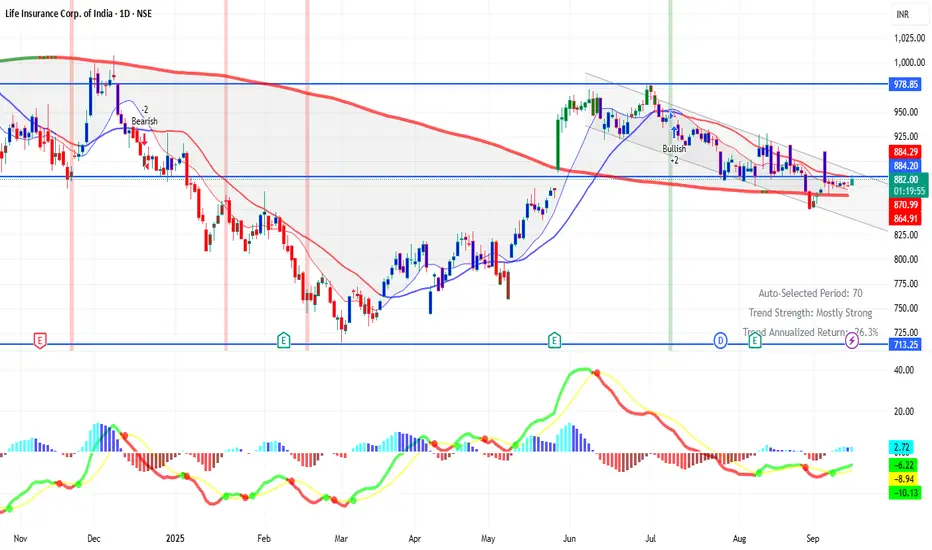
LICI 1D Time framePrice Action
Current Price: ₹882.50 (approx)
52-Week Range: ₹715.30 – ₹1,048.90
P/E Ratio: ~11.4
Book Value per Share: ~₹200+
🔹 Support & Resistance
Strong Support: ₹800 – ₹830
Immediate Resistance: ₹860 – ₹900
Next Resistance (medium-term): ₹1,000+
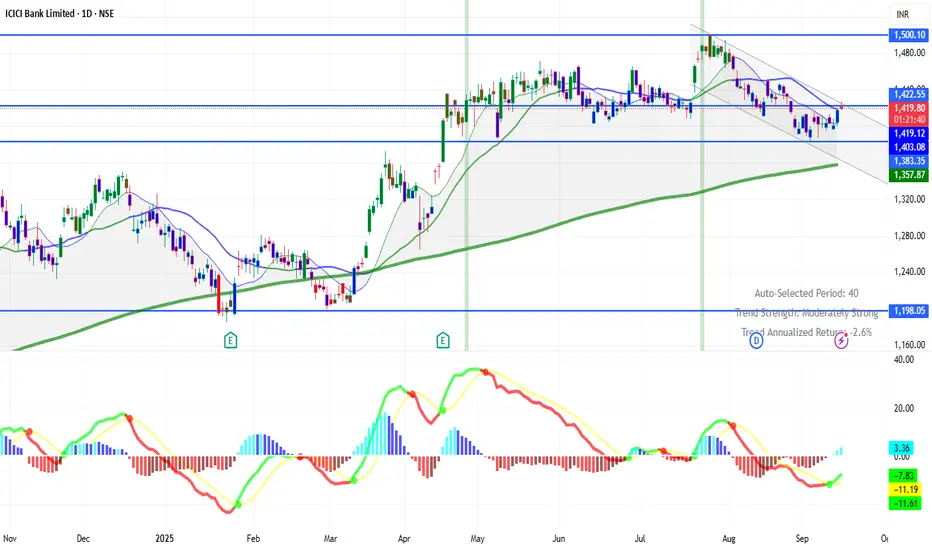
ICICIBANK 1D Time frameCurrent Price: ₹1,422 (approx)
Previous Close: ₹1,417.70
52-Week Range: ₹1,186 – ₹1,500
🔹 Support & Resistance (Daily)
Immediate Support: ₹1,390 – ₹1,392
Next Support: ₹1,360 – ₹1,365
Immediate Resistance: ₹1,407 – ₹1,415
Next Resistance: ₹1,416+
ANGELONE 1D Time frameCurrent Price: ₹2,238 – ₹2,240
Day’s Range: ₹2,212.60 – ₹2,274
Previous Close: ₹2,222.30
🔹 Support & Resistance
Support 1: ₹2,220 – ₹2,215
Support 2: ₹2,200 – ₹2,180
Resistance 1: ₹2,250 – ₹2,260
Resistance 2: ₹2,270 – ₹2,280

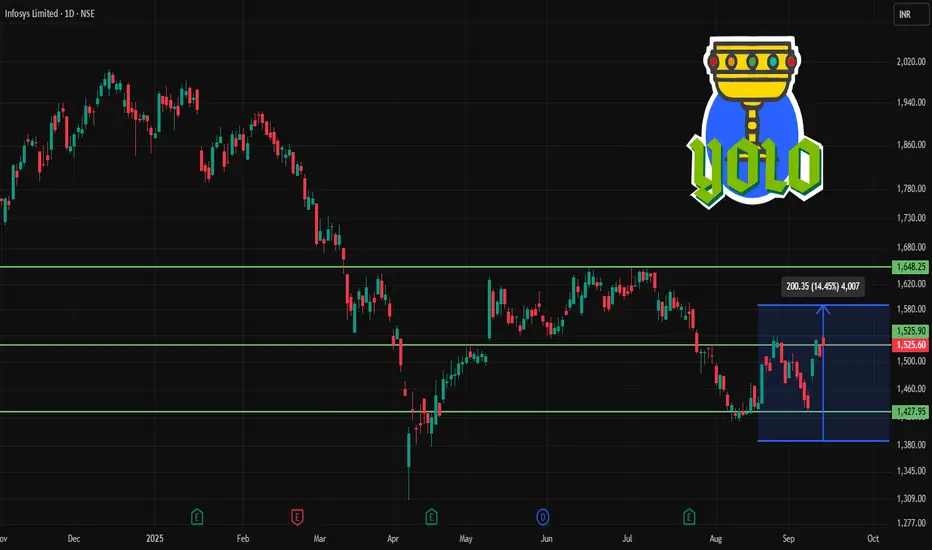
INFY 1D Time frameCurrent Price & Trend
Current Level: ~₹1,525
Trend: Neutral to bullish → stock is slowly recovering from recent lows.
Momentum: Buying support is visible near ₹1,500 zone.
Indicators
RSI: Around 59 → healthy, not yet overbought.
MACD: Positive crossover → signals upward momentum.
Moving Averages: Price is above short-term averages, but medium-term trend is still consolidating.
Bullish Scenario
If INFY sustains above 1,540, it can move toward 1,560 – 1,600.
A breakout above 1,600 could trigger further rally toward 1,650.
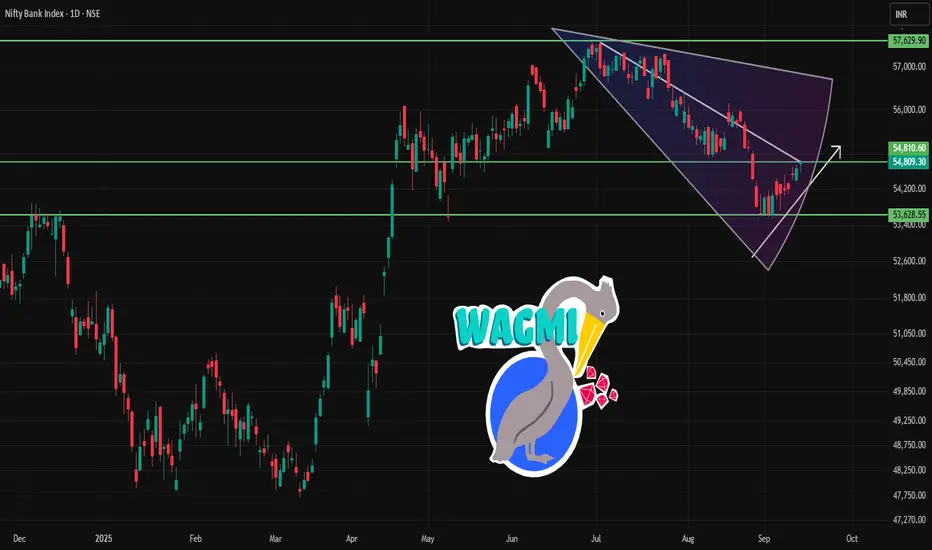
BANKNIFTY 1D Time frameCurrent Price & Trend
Current Level: 54,809
Trend: Neutral to mildly bullish
Range Context: Close to resistance zone, so movement here is crucial
Bullish Case
If Bank Nifty closes above 55,000–55,200, it can rally toward 55,500–55,700.
Sustained buying could push further toward 57,000 in coming sessions.
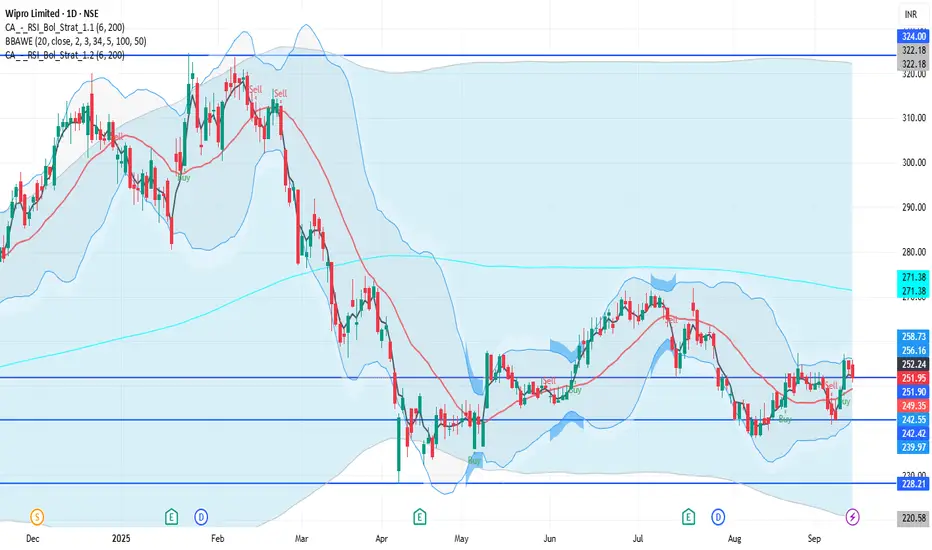
WIPRO 1D Time frameCurrent Price & Trend
Price: ₹251.95
Trend: Neutral; trading approximately 22.5% below its 52-week high of ₹324.60, reached on July 2, 2025.
Momentum: Indicators suggest a neutral to slightly bearish outlook.
Bullish Scenario
Breakout Above ₹257: A sustained move above ₹257 could target ₹265 – ₹270 in the short term.
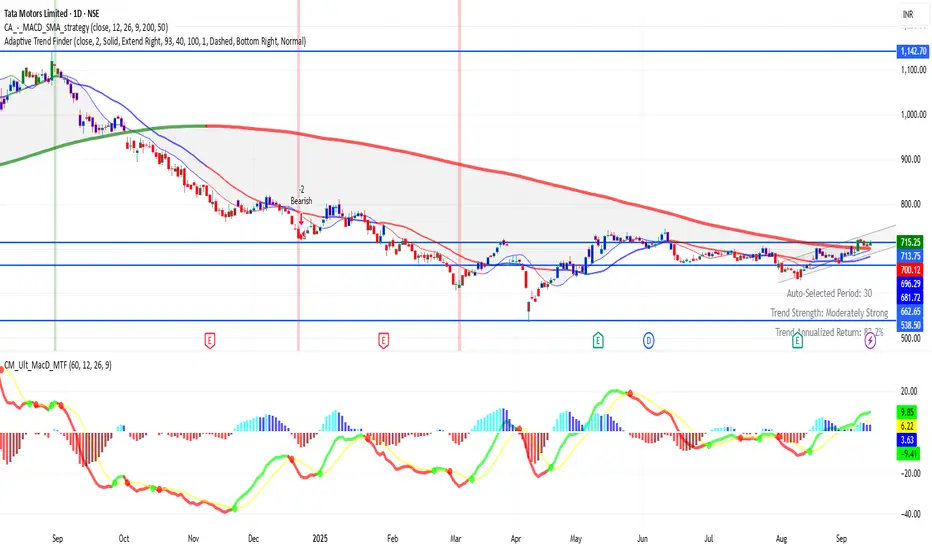
TATAMOTORS 1D Time frameCurrent Status
Price is around ₹715
The stock has been showing strength recently, with many of its moving averages (short- to long-term) supporting the rise.
Technical indicators like RSI, MACD, ADX etc. lean positive — buyers seem to have the upper hand.
There’s an inverted Head & Shoulders pattern forming, which is a bullish reversal signal if confirmed. Support zones are holding up so far.
Bullish Scenario
If Tata Motors stays above ₹700–705 support and breaks past ~₹720–725 with volume:
Possible upside to ~₹730-₹740
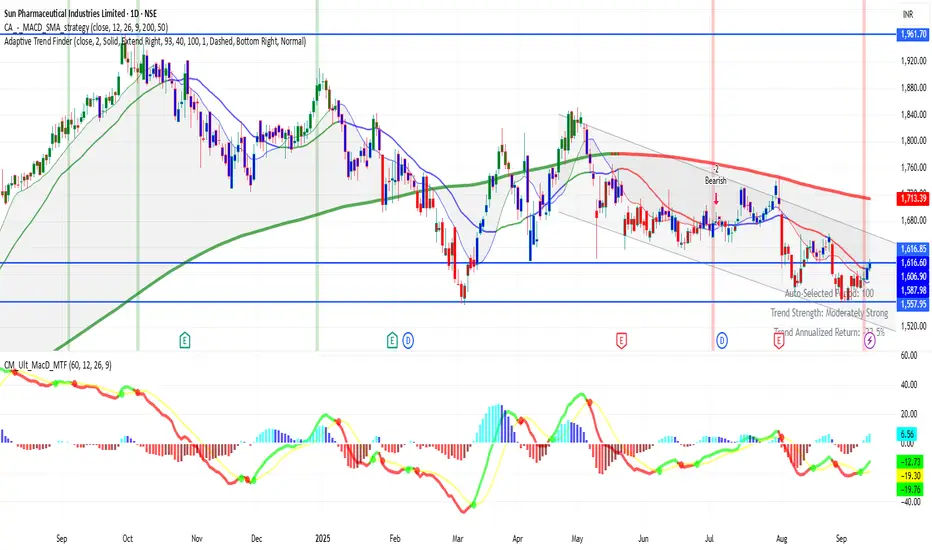
SUNPHARMA 1D Time frameCurrent Snapshot
Stock is around ₹1,616
52-week range: ~ ₹1,553 (low) up to ~ ₹1,960 (high)
Price is significantly below its 52-week peak, indicating past weakness or profit-taking from highs.
Bullish Scenario
If price can hold above the support (~₹1,590–₹1,600) and pushes above the immediate resistance (~₹1,620–₹1,630):
Could see a move toward ₹1,660–₹1,670.
If resistance is crossed with strength, next targets would be ~₹1,740-₹1,750 or more, depending on momentum.
SBIN 1D Time frameCurrent Price Action (Daily Chart)
Price Range: Stock is moving between ₹815 – ₹830 right now.
Trend: Consolidation with mild bullish bias.
Key Levels
Immediate Resistance: ₹830
Next Resistance: ₹840 – ₹850
Major Resistance: Around ₹875 (previous high)
Immediate Support: ₹815 – ₹820
Strong Support: ₹800 – ₹805
Critical Support: ₹785

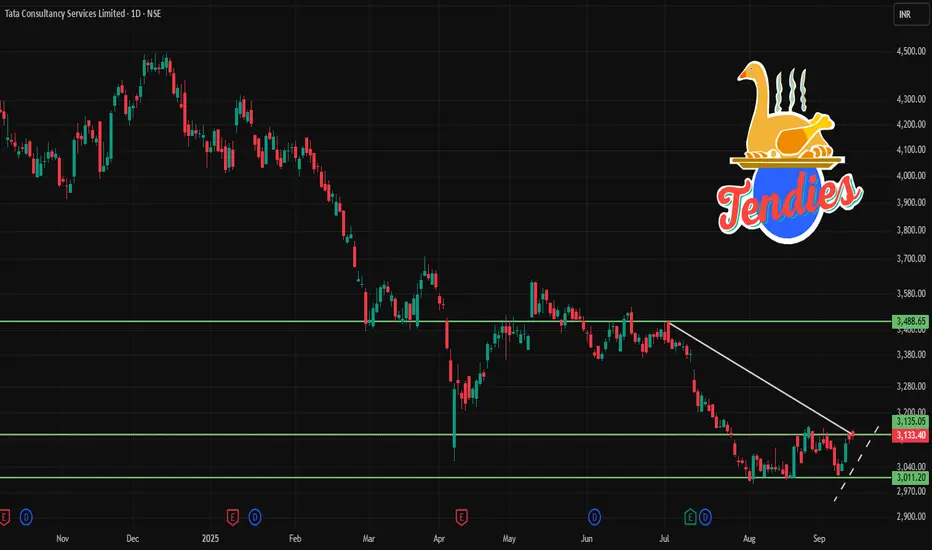
TCS 1D Time frame📉 Current Market Snapshot
Closing Price: ₹3,133.40
Day's Range: ₹3,121.00 – ₹3,148.70
52-Week High: ₹4,547.00
52-Week Low: ₹2,991.60
Market Cap: ₹11,21,000 crore
P/E Ratio (TTM): 22.8
Dividend Yield: 1.93%
Book Value: ₹262
ROE: 52.4%
Debt-to-Equity Ratio: 0.10
EPS (TTM): ₹136.19
Face Value: ₹1.00
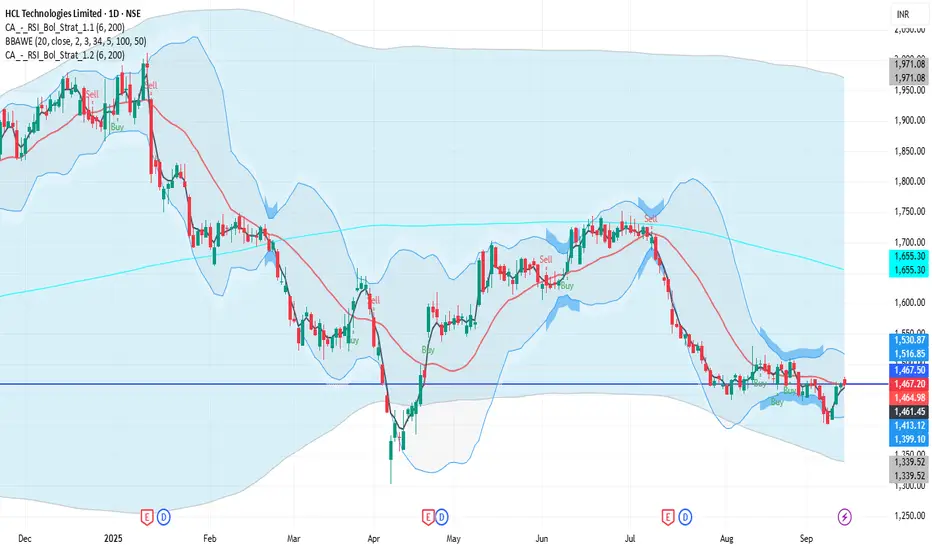
HCLTECH 1D Time frame📉 Current Market Snapshot
Current Price: ₹1,467
Previous Close: ₹1,467.20
Day’s Range: ₹1,463 – ₹1,480
📊 Key Support & Resistance Levels
Support Levels: ₹1,463, ₹1,450
Resistance Levels: ₹1,480, ₹1,500
LUPIN 1D Time frame📍 Current Price
₹2,043.40 (closing price)
Short-Term Outlook
Bullish Scenario: A sustained move above ₹2,070 could lead to a test of the 52-week high around ₹2,402.90.
Bearish Scenario: A drop below ₹2,000 may signal a potential pullback toward ₹1,950.

ASIANPAINT 1D Time frame📍 Current Price
₹2,546.30 (closing price)
Short-Term Outlook
Bullish Scenario: A sustained move above ₹2,587.40 could lead to a test of the 52-week high around ₹3,394.90.
Bearish Scenario: A drop below ₹2,505.00 may signal a potential pullback toward ₹2,400.
