ICICIBANK 1D Time frame📍 Current Price
₹1,417.70 (closing price)
Short-Term Outlook
Bullish Scenario: A sustained move above ₹1,430 could lead to a test of the 52-week high around ₹1,500.
Bearish Scenario: A drop below ₹1,390 may signal a potential pullback toward ₹1,350.
AXISBANK

HINDUNILVR 1D Time frame📍 Current Price
₹2,580.50 (down 1.58% from previous close)
Short-Term Outlook
Bullish Scenario: Sustained move above ₹2,650 could lead to a test of ₹2,700.
Bearish Scenario: Break below ₹2,553.70 may signal a deeper pullback toward ₹2,500.

NATURALGAS1! 1D Time frame📍 Current Price
₹261
🔑 Key Levels
Immediate Resistance: ₹268 → ₹272
Immediate Support: ₹257 → ₹253
52-Week High: ₹366
52-Week Low: ₹188
Short-Term Outlook
Bullish Scenario: Sustained above ₹272 → possible move toward ₹280–₹285
Bearish Scenario: Falls below ₹257 → may test ₹253–₹250

Smart Money Secrets in Trading1. What Is Smart Money?
The term “smart money” refers to capital controlled by investors with the most knowledge, resources, and influence in the market. Unlike retail traders who rely on news headlines, gut feelings, or basic technical indicators, smart money entities often have:
Advanced Research – Access to data analytics, machine learning models, and macroeconomic reports that retail traders can’t afford.
Liquidity Power – Ability to move billions of dollars into or out of markets.
Insider Insights – Not illegal insider trading, but a network of analysts, lobbyists, and industry connections that help them anticipate shifts earlier.
Sophisticated Tools – Proprietary algorithms, HFT (High-Frequency Trading) systems, and volume analysis.
When smart money flows into an asset, it often precedes strong trends. Conversely, when it exits, the trend weakens. Spotting these shifts is the cornerstone of trading like institutions.
2. Why Following Smart Money Matters
Most retail traders face three challenges:
They are late. By the time news is published, smart money has already acted.
They are emotional. Fear and greed drive poor decisions.
They are undercapitalized. Limited funds mean smaller risk tolerance and forced exits.
Smart money, on the other hand, has time, patience, and size on its side. They often accumulate positions when the market is quiet and distribute them when hype peaks. If retail traders learn to read footprints left by institutions, they can avoid being trapped and instead ride the waves created by these giants.
3. Smart Money Psychology
Before diving into strategies, it’s crucial to understand how smart money thinks differently:
Accumulation vs. Distribution: Institutions quietly build positions (accumulation) when prices are low and sentiment is negative. Later, they sell (distribution) when retail enthusiasm is high.
Liquidity Hunting: Big players need liquidity to enter and exit. They often push prices into zones where retail traders place stop-loss orders, triggering forced selling or buying, which provides liquidity for institutions.
Contrarian Nature: Smart money often takes positions opposite to the crowd. If everyone is bullish on a stock, institutions might be preparing to sell.
This mindset explains why retail traders often feel “the market is against them.” In reality, they are just on the wrong side of institutional strategies.
4. Smart Money Strategies in Action
a) Wyckoff Method
Richard Wyckoff’s market theory is one of the earliest frameworks for analyzing smart money moves. It breaks market cycles into accumulation, markup, distribution, and markdown.
Accumulation: Institutions quietly buy. Prices stay in a range.
Markup: Price breaks out as buying accelerates.
Distribution: Institutions sell to latecomers.
Markdown: Prices collapse as supply overwhelms demand.
Recognizing these phases helps traders align with institutional activity instead of being victims of it.
b) Volume Profile and Order Flow
Smart money activity often shows up in volume spikes at key price levels.
High Volume Nodes: Suggest accumulation/distribution zones.
Low Volume Nodes: Indicate areas where price moves quickly (little resistance).
Using tools like Volume Profile, Order Flow Charts, or Footprint Charts allows traders to identify where institutions are active.
c) Stop-Loss Hunting
Ever noticed your trade gets stopped out before the price reverses in your favor? That’s not coincidence. Institutions deliberately push prices into stop-loss zones to trigger retail exits, giving them the liquidity to enter positions. Recognizing liquidity pools (clusters of retail stops) helps traders anticipate these moves.
d) Options and Derivatives
Smart money often uses options to hedge or accumulate exposure without moving the underlying asset visibly. For example, unusual options activity (UOA) often precedes big stock moves. Tracking options volume and open interest provides clues about institutional expectations.
e) Dark Pools
Institutions often trade in “dark pools”—private exchanges where large orders are hidden from the public order book. While retail traders can’t see these trades in real time, monitoring dark pool data feeds can reveal where institutions are accumulating or unloading.
5. Indicators of Smart Money Activity
How can a retail trader detect smart money flow? Here are practical signals:
Unusual Volume – Sharp spikes in trading volume without corresponding news often signal institutional activity.
Price Action at Key Levels – Repeated defense of support/resistance zones often shows accumulation or distribution.
Commitment of Traders (COT) Reports – For commodities and forex, COT reports reveal institutional positions.
Options Activity – Large trades in far-dated contracts signal expectations of future moves.
Insider Buying/Selling – Public filings (like Form 4 in the US) show what company executives are doing with their shares.
Market Breadth Divergence – If a few large-cap stocks push indices higher while the majority lag, smart money may be distributing.
6. Smart Money Secrets Retail Traders Overlook
Secret 1: News Is Noise
By the time retail traders act on CNBC headlines, smart money has already positioned. Institutions often use news events to exit positions while retail crowds rush in.
Secret 2: Patience Pays
Smart money is not chasing quick profits—they wait weeks or months to build positions. Retail traders who overtrade often lose by being too impatient.
Secret 3: Fake Moves Before Real Moves
Markets often create false breakouts or sharp wicks to trick retail traders into the wrong direction. These are engineered by big players to grab liquidity.
Secret 4: Scaling In and Out
Institutions never place all their capital at once. They accumulate in layers to avoid moving the market. Retail traders often go “all in” and get wiped out.
Secret 5: Risk Management Is Non-Negotiable
The true secret of smart money isn’t just knowing where to trade—it’s knowing how much to risk. They survive losing streaks by controlling position size and leverage.
Conclusion
Smart money isn’t a mysterious cabal manipulating markets—it’s simply capital managed by those with deeper knowledge, bigger resources, and stronger discipline. Their secrets are not inaccessible; they’re patterns and behaviors visible to those who know where to look.
By understanding accumulation/distribution, liquidity hunting, volume footprints, options flow, and institutional psychology, retail traders can stop fighting the market and instead surf the waves created by the giants.
The real secret, however, is not in any single indicator—it’s in the mindset: patience, discipline, risk management, and the ability to think like an institution rather than a gambler. Once traders internalize this, they transition from being part of the crowd to moving in sync with the real power behind the markets.
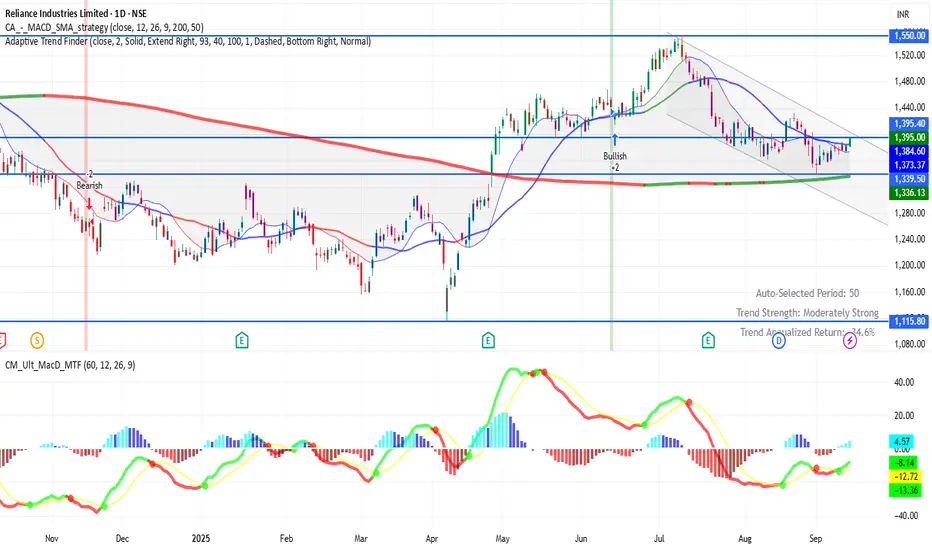
RELIANCE 1D Time frame Current Status
Price around ₹1395
Day range: ₹1380 – ₹1396
52-week range: ₹1115 – ₹1551
Key Levels
Support zones: ₹1380 → ₹1370 → ₹1350
Resistance zones: ₹1400 → ₹1410 → ₹1430
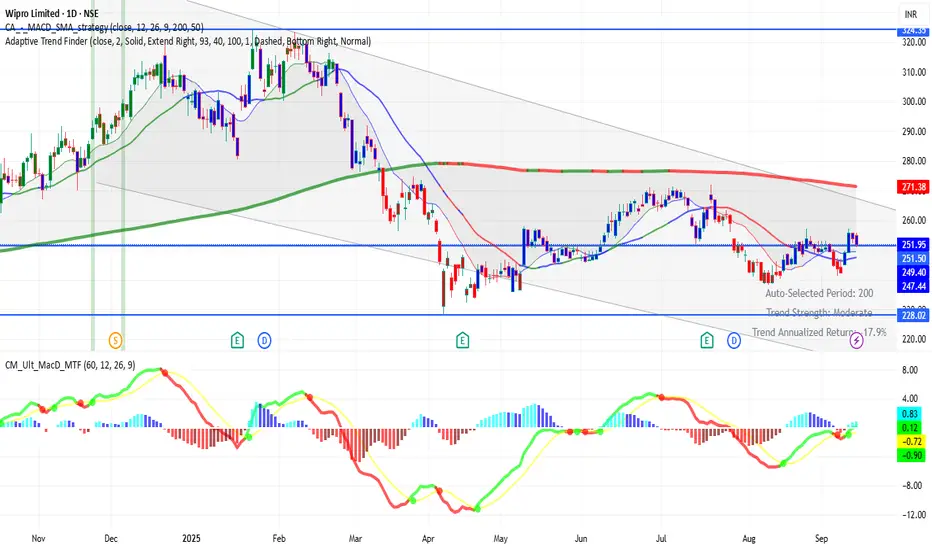
WIPRO 1D Time frame📊 Current Status
Price around ₹252–₹255
Showing recovery from recent support
🔑 Key Levels
Support: ₹242 → ₹240 → ₹230
Resistance: ₹255 → ₹260 → ₹265
✅ Outlook
If WIPRO sustains above ₹255–₹260, more upside is possible. Falling below ₹240 may push price back toward ₹230.
SENSEX 1D Time frame Current Status
Trading around 81,904 points
Showing steady upward move in recent se
Key Levels
Support: 81,600 → 81,400 → 81,000
Resistance: 82,000 → 82,400 → 83,000
Outlook
As long as Sensex holds above 81,400–81,600, trend remains positive. Break above 82,000–82,400 can lead toward higher levels, while falling below 81,000 may trigger correction.

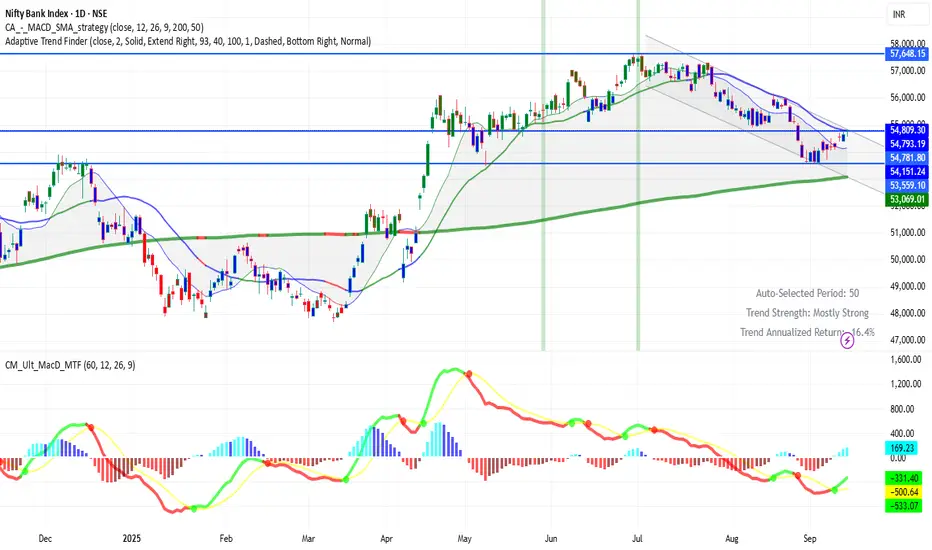
BANKNIFTY (1D timeframe)📍 Current Level
Trading around 54,809 points
🔑 Key Levels
Immediate Resistance: 55,000 → 55,200
Immediate Support: 54,400 → 54,500
Deeper Support: 53,800 → 53,500
✅ Outlook
If BankNifty breaks and holds above 55,000–55,200, more upside is possible.
If it falls below 54,400–54,500, weakness can take it down toward 53,800–53,500.
Part 8 Trading Master ClassIntroduction to Options
Financial markets provide several instruments to trade and invest. Among equities, futures, commodities, and currencies, options trading has gained significant popularity worldwide, including India. Options are not just speculative tools; they are also powerful instruments for hedging, income generation, and risk management.
An option is essentially a derivative contract—its value is derived from an underlying asset like a stock, index, commodity, or currency. Unlike direct stock ownership, an option gives the buyer rights but not obligations. This unique feature makes them versatile but also complex for beginners.
To truly master options, one must understand not only the basic definitions but also pricing, market psychology, and strategies.
Basic Terminology
Before diving deeper, let’s go through the essential terms:
Option Contract: Agreement between buyer and seller based on an underlying asset.
Underlying Asset: Stock, index, commodity, or currency.
Strike Price: Pre-decided price at which the option can be exercised.
Expiry Date: The last date on which the option can be exercised.
Premium: Price paid by the buyer to acquire the option.
Lot Size: Minimum quantity for which an option can be traded.
European vs. American Options: European can be exercised only on expiry; American anytime before expiry.
Call & Put Options Explained
At the heart of option trading are two instruments: Calls and Puts.
Call Option: Gives the buyer the right (not obligation) to buy the asset at the strike price.
Buyers expect prices to rise.
Sellers (writers) expect prices to stay flat or fall.
Put Option: Gives the buyer the right (not obligation) to sell the asset at the strike price.
Buyers expect prices to fall.
Sellers expect prices to stay flat or rise.
📌 Example:
If Reliance stock trades at ₹2500:
A ₹2600 call may cost ₹50 premium. If the stock rises to ₹2700, profit = (2700-2600-50) = ₹50 per share.
A ₹2400 put may cost ₹40. If stock falls to ₹2200, profit = (2400-2200-40) = ₹160 per share.

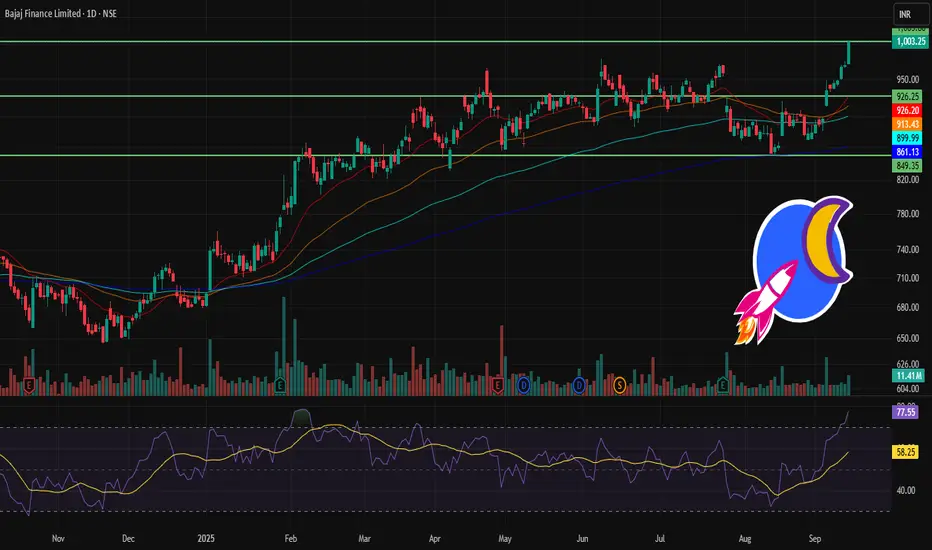
BAJFINANCE 1D Time frame🔢 Current Level
Trading near ₹1,003
🔑 Key Resistance & Support Levels
Resistance Zones:
~ ₹1,020 – ₹1,030 (immediate resistance)
~ ₹1,050 – ₹1,070 (stronger resistance above)
Support Zones:
~ ₹980 – ₹970 (first support)
~ ₹950 – ₹940 (secondary support)
~ ₹920 – ₹900 (deeper support if selling pressure builds)
📉 Outlook
Bullish Scenario: Sustaining above ₹1,000 may drive price toward ₹1,020 – ₹1,070.
Bearish Scenario: A break below ₹980 can drag it toward ₹950 or even ₹920.
Neutral / Range: Likely sideways between ₹980 – ₹1,030 until a breakout.
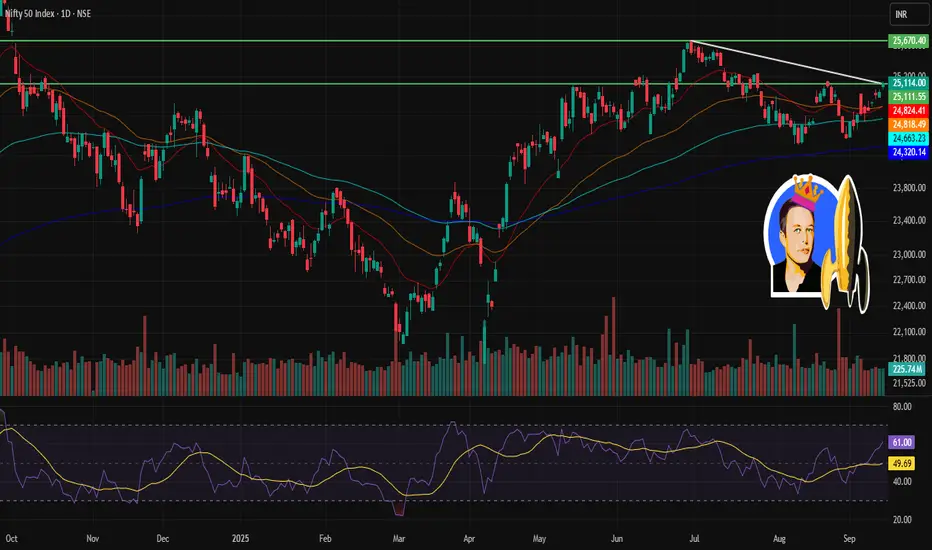
NIFTY 1D Time frame🔢 Current Level
NIFTY ~ 25,114
🔑 Key Resistance & Support Levels
Resistance Zones:
~ 25,200 – 25,250 (near-term resistance)
~ 25,400 – 25,500 (stronger resistance if it breaks above the first zone)
Support Zones:
~ 24,950 – 25,000 (immediate support)
~ 24,800 – 24,900 (short-term support)
~ 24,600 – 24,700 (deeper support, in case of downside move)
📉 Outlook
Bullish Scenario: If NIFTY holds above ~25,000 and clears ~25,250, it may head toward ~25,400-25,500.
Bearish Scenario: If it drops below ~24,950, then weakness may drag it toward ~24,800 or lower supports.
Neutral / Range: Between ~25,000 – 25,250 likely consolidation until a decisive move.
Part 7 Trading Master Class Why Traders Use Options
Hedging – Protect portfolio against price swings.
Speculation – Bet on future price movements with smaller capital.
Income Generation – Sell options and earn premiums.
Arbitrage – Exploit mispricing between spot and derivatives.
Options Pricing Models
Two main models:
Black-Scholes Model: Uses volatility, strike, expiry, and interest rates to price options.
Binomial Model: Breaks time into steps, considering probability of price moves.
Factors affecting option prices:
Spot price of underlying
Strike price
Time to expiry
Volatility
Interest rates
Dividends
Strategies in Option Trading
Options allow creation of custom payoff structures. Strategies are classified as:
A. Protective Strategies
Protective Put – Holding stock + buying put (like insurance).
Covered Call – Holding stock + selling call.
B. Income Strategies
Iron Condor – Selling OTM call & put, buying further OTM options.
Strangle/Straddle Selling – Profit from time decay when market is range-bound.
C. Speculative Strategies
Long Straddle – Buy ATM call + put, profit from big moves.
Bull Call Spread – Buy lower strike call, sell higher strike call.
Bear Put Spread – Buy higher strike put, sell lower strike put.
📊 Each strategy has its risk/reward profile. Professional traders combine them depending on market conditions.

Part 6 Learn Institutional Trading Call & Put Options Explained
At the heart of option trading are two instruments: Calls and Puts.
Call Option: Gives the buyer the right (not obligation) to buy the asset at the strike price.
Buyers expect prices to rise.
Sellers (writers) expect prices to stay flat or fall.
Put Option: Gives the buyer the right (not obligation) to sell the asset at the strike price.
Buyers expect prices to fall.
Sellers expect prices to stay flat or rise.
📌 Example:
If Reliance stock trades at ₹2500:
A ₹2600 call may cost ₹50 premium. If the stock rises to ₹2700, profit = (2700-2600-50) = ₹50 per share.
A ₹2400 put may cost ₹40. If stock falls to ₹2200, profit = (2400-2200-40) = ₹160 per share.
Key Concepts
Intrinsic Value: Real profit if exercised immediately.
Time Value: Premium paid for potential future movement.
In-the-Money (ITM): Option already profitable if exercised.
Out-of-the-Money (OTM): Option has no intrinsic value, only time value.
At-the-Money (ATM): Strike = current market price.

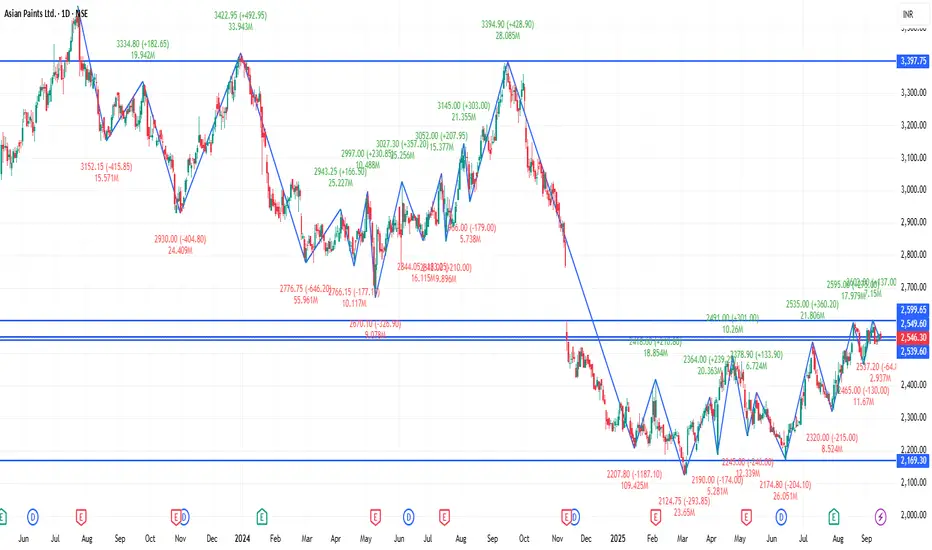
ASIANPAINT 1D Time frame🔢 Current Level
Trading around ₹2,546 – ₹2,560
🔑 Key Resistance & Support Levels
Resistance Zones:
₹2,559 – ₹2,560 (recent highs; breakout above this may lead to further upside)
₹2,580 – ₹2,600 (stronger resistance above)
Support Zones:
₹2,540 – ₹2,545 (immediate support; failure to hold above this may lead to a decline)
₹2,520 – ₹2,530 (short-term support; a break below this could indicate weakness)
₹2,500 – ₹2,510 (deeper support zone if price dips further)
📉 Outlook
Bullish Scenario: If Asian Paints holds above ₹2,545, upward momentum may continue. Break above ₹2,560 can open the way toward ₹2,580+.
Bearish Scenario: If it falls below ₹2,520, risk increases toward ₹2,500 – ₹2,510.
Neutral / Range: Between ₹2,545 – ₹2,560, Asian Paints may consolidate before a directional move.
SBIN 1D Time frame🔢 Current Level
Trading around ₹823.65
🔑 Key Resistance & Support Levels
Resistance Zones:
₹825.00 – ₹830.00 (recent highs; breakout above this may lead to further upside)
₹835.00 – ₹840.00 (stronger resistance above)
Support Zones:
₹815.00 – ₹820.00 (immediate support; failure to hold above this may lead to a decline)
₹810.00 – ₹815.00 (short-term support; a break below this could indicate weakness)
₹800.00 – ₹805.00 (deeper support zone if price dips further)
📉 Outlook
Bullish Scenario: If SBIN holds above ₹820.00, upward momentum may continue. Break above ₹830.00 can open the way toward ₹840.00+.
Bearish Scenario: If it falls below ₹800.00, risk increases toward ₹790.00 – ₹795.00.
Neutral / Range: Between ₹820.00 – ₹830.00, SBIN may consolidate before a directional move.

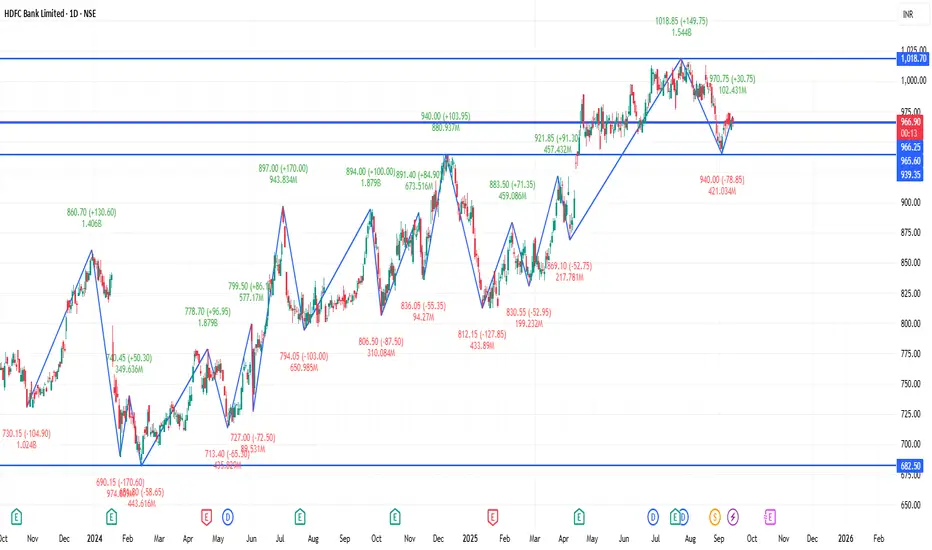
HDFCBANK 1D Time frame🔢 Current Level
Trading around ₹966 – ₹968
🔑 Key Support & Resistance Levels
Resistance Zones:
~ ₹973 – ₹975 (near-term resistance)
~ ₹980 – ₹985 (stronger resistance if price crosses above the earlier zone)
Support Zones:
~ ₹962 – ₹960 (immediate support)
~ ₹955 – ₹953 (lower support if downward pressure continues)
📉 Outlook
Bullish Scenario: Holding above ₹960-₹962 may push price toward ₹973-₹975, and a breakout above that can lead to ₹980-₹985.
Bearish Scenario: Falling below ₹955 may increase downside risk toward deeper supports.
Neutral / Range Zone: Between ₹960-₹975, likely sideways consolidation until a breakout happens.
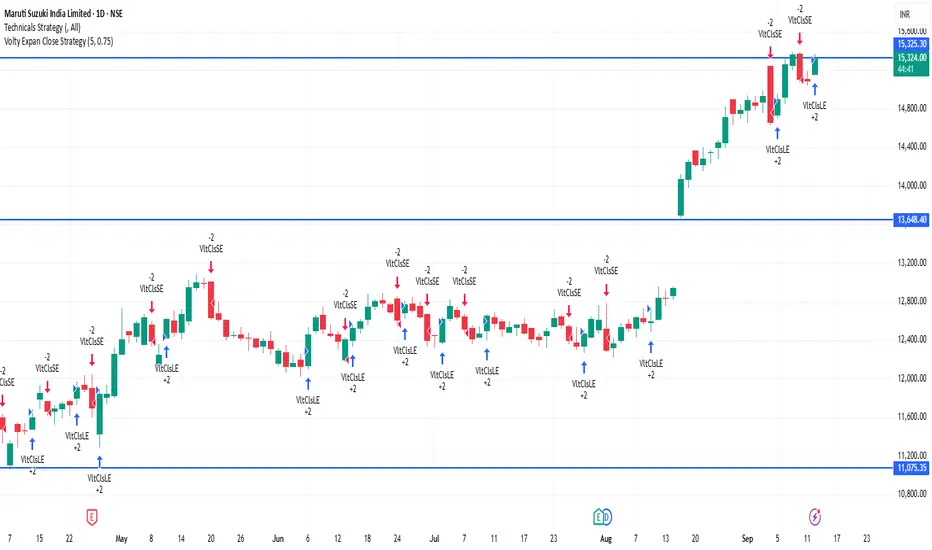
MARUTI 1D Time frame🔢 Current Level
Trading around ₹15,318 – ₹15,325
🔑 Key Resistance & Support Levels
Resistance Zones:
₹15,373 – ₹15,384 (recent highs; breakout above this may lead to further upside)
₹15,400 (psychological resistance)
₹15,500 (stronger resistance above)
Support Zones:
₹15,150 – ₹15,160 (immediate support; failure to hold above this may lead to a decline)
₹15,050 – ₹15,100 (short-term support; a break below this could indicate weakness)
₹14,800 – ₹14,900 (deeper support zone if price dips further)
📉 Outlook
Bullish Scenario: If Maruti Suzuki holds above ₹15,160, upward momentum may continue. Break above ₹15,384 can open the way toward ₹15,500+.
Bearish Scenario: If it falls below ₹15,050, risk increases toward ₹14,800 – ₹14,900.
Neutral / Range: Between ₹15,160 – ₹15,384, Maruti Suzuki may consolidate before a directional move.
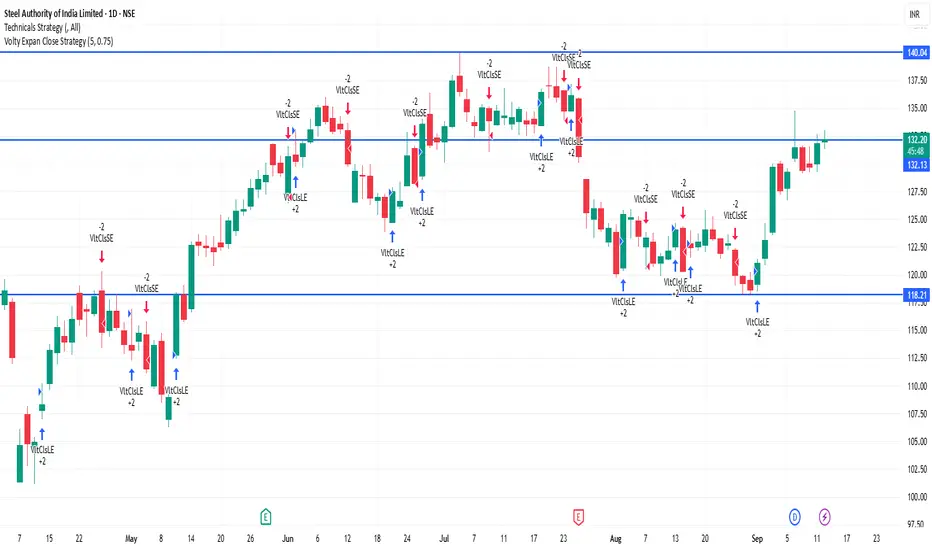
SAIL 1D Time frame🔢 Current Level
Trading around ₹132.28
🔑 Key Resistance & Support Levels
Resistance Zones:
₹133.00 – ₹134.00 (near-term resistance; breakout above this may lead to further upside)
₹135.00 – ₹136.00 (stronger resistance above)
Support Zones:
₹131.50 – ₹132.00 (immediate support; failure to hold above this may lead to a decline)
₹130.00 – ₹130.50 (short-term support; a break below this could indicate weakness)
₹128.00 – ₹129.00 (deeper support zone if price dips further)
📉 Outlook
Bullish Scenario: If SAIL holds above ₹132.00, upward momentum may continue. Break above ₹134.00 can open the way toward ₹135.00+.
Bearish Scenario: If it falls below ₹130.00, risk increases toward ₹128.00 – ₹129.00.
Neutral / Range: Between ₹132.00 – ₹134.00, SAIL may consolidate before a directional move.
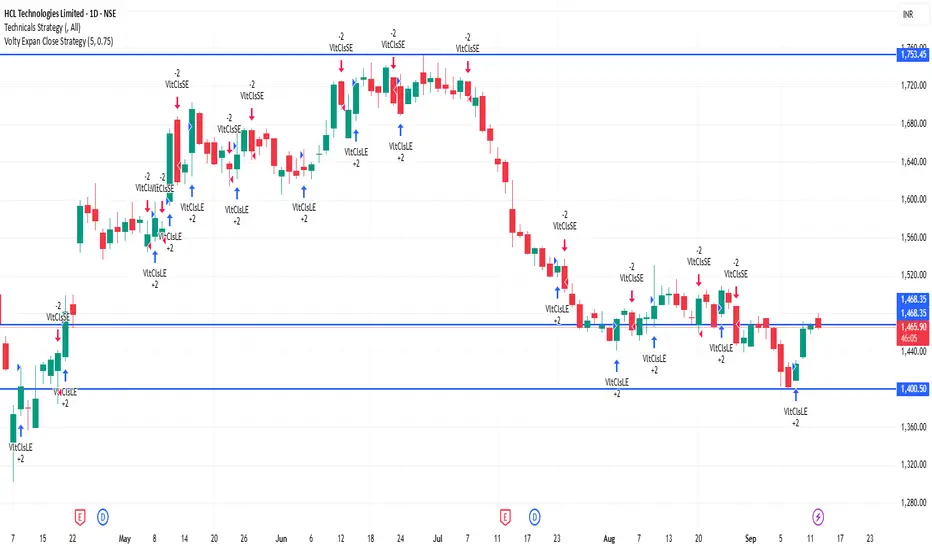
HCLTECH 1D Time frame🔢 Current Level
Trading around ₹1,465.80 - ₹1,467.80
🔑 Key Resistance & Support Levels
Resistance Zones:
₹1,472 – ₹1,475 (recent highs; breakout above this may lead to further upside)
₹1,485 – ₹1,490 (stronger resistance above)
Support Zones:
₹1,460 – ₹1,463 (immediate support; failure to hold above this may lead to a decline)
₹1,450 – ₹1,453 (short-term support; a break below this could indicate weakness)
₹1,440 – ₹1,445 (deeper support zone if price dips further)
📉 Outlook
Bullish Scenario: If HCL Technologies holds above ₹1,463, upward momentum may continue. Break above ₹1,475 can open the way toward ₹1,485+.
Bearish Scenario: If it falls below ₹1,440, risk increases toward ₹1,430 – ₹1,445.
Neutral / Range: Between ₹1,463 – ₹1,475, HCL Technologies may consolidate before a directional move.
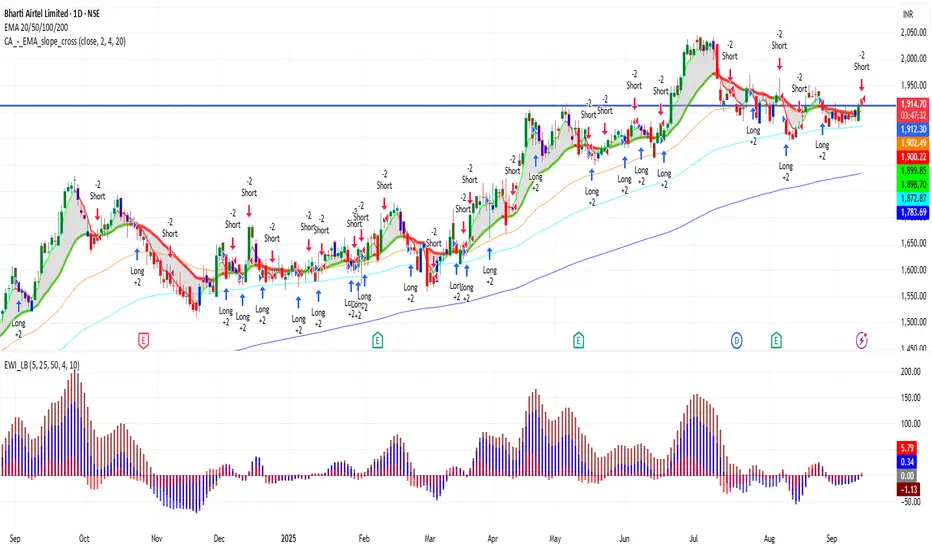
BHARTIARTL 1D Time frame🔢 Current Level
Trading around ₹1,912.00 - ₹1,914.30
🔑 Key Resistance & Support Levels
Resistance Zones:
₹1,925 – ₹1,930 (recent highs; breakout above this may lead to further upside)
₹1,950 (psychological resistance)
₹2,000 (stronger resistance above)
Support Zones:
₹1,900 – ₹1,905 (immediate support; failure to hold above this may lead to a decline)
₹1,880 (short-term support; a break below this could indicate weakness)
₹1,850 – ₹1,860 (deeper support zone if price dips further)
📉 Outlook
Bullish Scenario: If Bharti Airtel holds above ₹1,905, upward momentum may continue. Break above ₹1,930 can open the way toward ₹1,950+.
Bearish Scenario: If it falls below ₹1,880, risk increases toward ₹1,850 – ₹1,860.
Neutral / Range: Between ₹1,905 – ₹1,930, Bharti Airtel may consolidate before a directional move.
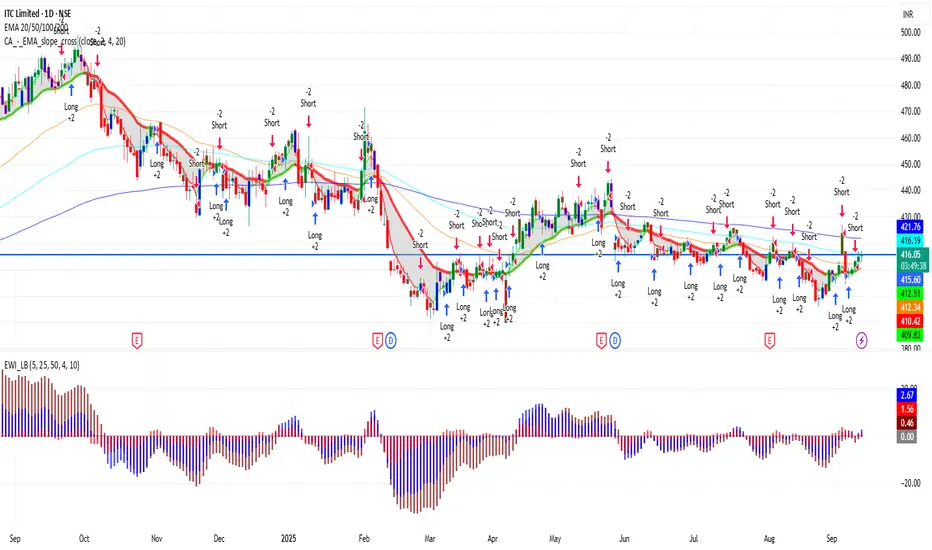
ITC 1D Time frame🔢 Current Level
ITC is trading around ₹413 – ₹416
🔑 Key Resistance & Support Levels
Resistance Zones:
₹416 – ₹421 (near-term resistance; breakout above this may lead to further upside)
₹420 (psychological resistance)
₹428 (stronger resistance above)
Support Zones:
₹412 – ₹413 (immediate support)
₹410 (short-term support; break below may indicate weakness)
₹398 – ₹400 (deeper support zone)
📉 Outlook
Bullish Scenario: If ITC holds above ₹412 – ₹413, upward momentum may continue. Break above ₹417 – ₹420 can open the way toward ₹428+.
Bearish Scenario: If it falls below ₹410, risk increases toward ₹398 – ₹400.
Neutral / Range: Between ₹412 – ₹417, ITC may consolidate before a directional move.
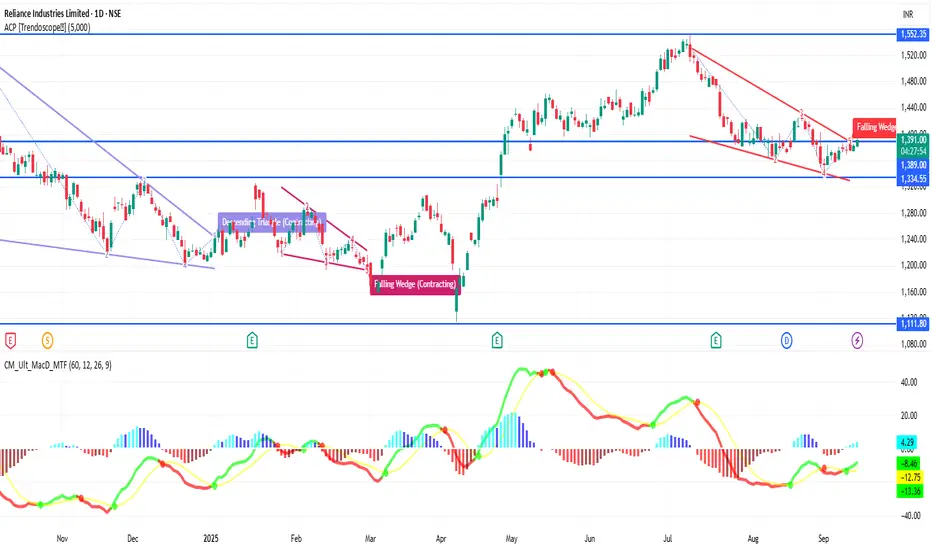
RELIANCE 1D Time frame🔢 Current Level
RELIANCE is trading around ₹1,391 – ₹1,392
🔑 Key Resistance & Support Levels
Resistance Zones:
₹1,392 – ₹1,396 (near-term resistance; breakout above this may lead to further upside)
₹1,400 (psychological resistance)
₹1,427 (stronger resistance above)
Support Zones:
₹1,380 – ₹1,385 (immediate support)
₹1,370 (short-term support; break below may indicate weakness)
₹1,350 (deeper support zone if selling pressure continues)
📉 Outlook
Bullish Scenario: If RELIANCE holds above ₹1,385, upward momentum may continue. Break above ₹1,396 can open the way toward ₹1,400+.
Bearish Scenario: If it falls below ₹1,370, risk increases toward ₹1,350.
Neutral / Range: Between ₹1,385 – ₹1,396, RELIANCE may consolidate before a directional move.
SENSEX 1D Time frame🔢 Current Level
Sensex is around ₹81,800 – ₹81,818
🔑 Key Resistance & Support Levels
Resistance Zones
~ ₹81,900 – ₹82,200 (recent highs / selling pressure zone)
~ ₹82,500 (stronger resistance above)
Support Zones
~ ₹81,300 – ₹81,400 (immediate support)
~ ₹81,100 (stronger support if price dips further)
~ ₹80,800 – ₹80,900 (deeper support zone)
📉 Outlook
If Sensex holds above ~ ₹81,400, bullish scenario remains alive.
Break above ~ ₹82,200 can open upside toward ~ ₹82,500+.
If it loses ~ ₹81,300, then downward risk increases, possibly toward ~ ₹81,100 or lower.
