Part 6 Learn Institutional Trading Deep Dive into Option Strategies
One of the biggest advantages of options is the ability to combine them into structured strategies. Let’s expand on some common and advanced ones:
A. Single-Leg Strategies
These involve buying or selling just one option.
Long Call: Buy a call option expecting prices to rise.
Low risk (limited to premium paid).
High reward if stock surges.
Long Put: Buy a put option expecting prices to fall.
Best for bearish outlook.
Acts as portfolio insurance.
Short Call (Naked Call): Sell a call without owning stock.
You receive premium.
Unlimited risk if stock rises sharply.
Short Put (Naked Put): Sell a put option.
You receive premium.
Big risk if stock collapses.
B. Multi-Leg Strategies (Spreads & Hedging)
Bull Call Spread: Buy a lower strike call & sell a higher strike call.
Profits if stock rises moderately.
Lower risk than naked call.
Bear Put Spread: Buy higher strike put & sell lower strike put.
Works in moderately bearish markets.
Covered Call: Own stock + sell call option.
Generates steady income.
Capped upside potential.
Protective Put: Own stock + buy put option.
Insurance against stock falling.
AXISBANK

Intraday vs Swing Trading1. Understanding Intraday Trading
Definition
Intraday trading means entering and exiting positions within the same trading day. A trader does not hold any position overnight to avoid overnight risks such as news announcements, earnings reports, or global market volatility.
Characteristics of Intraday Trading
Short Holding Period: Minutes to hours, always squared-off before market close.
High Frequency: Multiple trades per day depending on opportunities.
Focus on Liquidity: Traders choose highly liquid stocks or instruments.
Leverage Usage: Intraday traders often use margin to amplify profits.
Technical Analysis Driven: Relies heavily on charts, price action, and indicators.
Goals of Intraday Traders
Capture small price movements (scalping 0.5–2% moves).
Consistent daily profits rather than waiting for big gains.
Quick decision-making, discipline, and risk management.
2. Understanding Swing Trading
Definition
Swing trading refers to holding positions for a few days to weeks, aiming to capture medium-term price swings. Traders ride upward or downward trends without reacting to every tick.
Characteristics of Swing Trading
Longer Holding Period: From 2–3 days up to several weeks.
Lower Frequency: Fewer trades, but larger profit targets.
Combination of Technical & Fundamental Analysis: Uses chart patterns, moving averages, and sometimes earnings or macroeconomic events.
Tolerance for Overnight Risk: Accepts gaps due to news or global events.
Less Screen Time: Traders analyze at the end of the day and monitor broadly.
Goals of Swing Traders
Catch larger moves (5–20% swings).
Trade with the trend, not intraday noise.
Balance between active trading and long-term investing.
3. Key Differences Between Intraday and Swing Trading
Aspect Intraday Trading Swing Trading
Holding Period Minutes to hours, closed same day Days to weeks
Frequency Many trades daily Few trades monthly
Capital Requirement Lower due to leverage Higher, requires holding without leverage
Risk Level Very high (market noise, leverage) Moderate (overnight risk, but less noise)
Profit Target Small per trade (0.5–2%) Larger per trade (5–20%)
Tools Intraday charts (1-min, 5-min, 15-min) Daily/weekly charts
Time Commitment Full-time, glued to screen Part-time, end-of-day monitoring
Stress Level High, fast decisions needed Lower, patience-based
Best for Aggressive, disciplined traders Patient, trend-following traders
4. Tools & Techniques
Tools for Intraday Trading
Short-term Charts – 1-min, 5-min, 15-min candles.
Indicators – VWAP, RSI, MACD, Bollinger Bands.
Order Types – Market orders, stop-loss, bracket orders.
News Feeds – Corporate announcements, economic data.
Scanners – For identifying stocks with volume and volatility.
Tools for Swing Trading
Daily/Weekly Charts – Identify broader trends.
Indicators – Moving averages (50, 200), RSI, Fibonacci retracement.
Patterns – Head & shoulders, flags, double tops/bottoms.
Fundamentals – Earnings reports, sector trends.
Portfolio Management – Diversification across sectors.
5. Risk & Reward
Intraday Trading Risks
Sudden intraday volatility.
High leverage leading to amplified losses.
Emotional stress leading to overtrading.
Market manipulation in low-volume stocks.
Swing Trading Risks
Overnight gaps due to news or events.
Holding during earnings or geopolitical announcements.
Misjudging long-term trend direction.
Reward Potential
Intraday: Small but frequent gains.
Swing: Fewer but larger gains.
6. Psychology Behind Each Style
Intraday Trader Psychology
Must be quick, disciplined, unemotional.
Can’t afford hesitation; seconds matter.
Needs mental stamina for long hours.
Swing Trader Psychology
Requires patience and conviction in the analysis.
Should handle overnight anxiety calmly.
Avoids micromanaging every tick.
7. Which Style Suits You?
Intraday Trading Suits If:
You can dedicate 6–7 hours daily.
You thrive in fast decision-making.
You handle stress well.
You prefer quick profits.
Swing Trading Suits If:
You have a job or business, can’t sit full-time.
You are patient and prefer analyzing trends.
You’re comfortable holding overnight risk.
You seek balanced trading with less stress.
8. Real-World Example
Imagine Stock XYZ at ₹1000:
Intraday Trader: Buys at ₹1000, sells at ₹1010 same day, booking 1% profit. May repeat 5–10 trades.
Swing Trader: Buys at ₹1000, holds for a week till ₹1150, booking 15% profit. Only 1 trade, but larger reward.
9. Pros & Cons
Pros of Intraday Trading
Quick returns.
Leverage available.
Daily learning experience.
No overnight risk.
Cons of Intraday Trading
Extremely stressful.
High brokerage costs.
Demands full-time attention.
High failure rate for beginners.
Pros of Swing Trading
Less screen time.
Larger profits per trade.
Flexibility to combine with job.
Trend-friendly.
Cons of Swing Trading
Overnight risk.
Requires patience.
Slow capital turnover.
Emotional swings if market gaps down.
10. Conclusion
Intraday and swing trading are two distinct paths to profit from markets. Neither is inherently better — it depends on one’s personality, risk appetite, and lifestyle.
If you thrive in fast-paced environments, can manage stress, and want quick daily profits, intraday trading is suitable.
If you prefer patience, less stress, and bigger swings, and don’t want to monitor markets constantly, swing trading is more fitting.
Ultimately, the best traders often experiment with both, learn their strengths, and settle into the style that complements their psychology. Success depends not just on the strategy, but on discipline, money management, and continuous learning.
Risk Smart, Grow Fast in TradingIntroduction
Trading has always been seen as a path to quick money, fast success, and even financial freedom. But the truth is that trading is not a get-rich-quick game. For every successful trader who grows fast, there are hundreds who lose money because they ignore the most important foundation of trading: risk management.
“Risk Smart, Grow Fast” is not just a catchy phrase. It’s a principle, a mindset, and a strategy. It means that if you manage your risks wisely, protect your capital, and make decisions with discipline, you can grow faster and more sustainably than if you blindly chase high returns. In fact, smart risk management is the engine that powers growth in trading.
This essay explores the philosophy, strategies, tools, and psychology behind trading with a “Risk Smart, Grow Fast” approach.
Part 1: Why Risk Management Is More Important Than Profit
Most new traders focus on one question: “How much can I make?” The right question, however, is: “How much can I lose if I’m wrong?”
In trading, risk always comes before reward. Here’s why:
Capital Preservation – Without capital, there’s no trading. Losing 50% of your account requires a 100% gain to break even. Protecting your downside ensures you stay in the game.
Compounding Effect – Smaller drawdowns allow compounding to work more efficiently. Even modest profits can grow exponentially when losses are controlled.
Emotional Stability – Large losses trigger fear, stress, and revenge trading. Smart risk control keeps emotions in check, enabling rational decision-making.
Sustainable Growth – Fast growth through reckless risk-taking often ends in collapse. True fast growth comes from controlled risk that compounds over time.
Key Idea: You cannot grow fast unless you manage risk smartly.
Part 2: What Does “Risk Smart” Really Mean?
Being risk smart doesn’t mean avoiding risk altogether. Trading is risk by nature; without risk, there is no reward. Instead, it means taking calculated risks that are aligned with your trading strategy, capital, and goals.
Core principles of being Risk Smart:
Position Sizing – Risking only a small percentage of your capital on each trade (usually 1–2%).
Stop Loss Discipline – Always knowing where you will exit if the trade goes wrong.
Diversification – Not putting all capital into one stock, sector, or instrument.
Risk/Reward Ratio – Ensuring potential reward is at least 2–3 times the risk.
Capital Allocation – Spreading money between short-term trades, long-term investments, and safe reserves.
Think of being risk smart like wearing a seatbelt while driving fast. You may enjoy the thrill of speed, but the seatbelt ensures survival if things go wrong.
Part 3: The Growth Mindset in Trading
While being risk smart focuses on protection, “grow fast” focuses on maximizing opportunities. Growth in trading is not just about profits, but also about knowledge, experience, and adaptability.
Components of the Growth Mindset:
Learning from Losses – Every loss is tuition. Smart traders don’t fear losses; they analyze them to refine strategies.
Adapting to Market Conditions – Markets change; strategies must evolve. What works in a trending market may fail in a choppy one.
Scaling Up Gradually – Growing fast doesn’t mean doubling your risk overnight. It means compounding small consistent gains until you can trade larger with confidence.
Leveraging Technology – Using charting tools, algo trading, backtesting, and data analytics to grow faster than traditional traders.
Mind and Body Discipline – Growth requires sharp focus, emotional control, and physical health. Trading is mental warfare; stamina matters.
Part 4: Balancing Risk and Growth
The challenge is balancing risk smart and grow fast. Too much focus on risk may lead to over-caution, missing opportunities. Too much focus on growth may cause reckless risk-taking.
Here’s how to strike the balance:
Risk Small, Scale Big – Start by risking 1–2% per trade. As your capital grows, absolute profits grow faster.
Compound Gains – Reinvest profits strategically instead of withdrawing all earnings.
Optimize Position Sizing – Adjust size based on volatility, conviction, and account size.
Use Asymmetric Setups – Look for trades where upside is significantly greater than downside.
Review Weekly, Act Daily – Analyze risk exposure weekly while executing growth trades daily.
Part 5: Practical Risk Smart Techniques
The 1% Rule – Never risk more than 1% of account value on a single trade.
Example: With $10,000 capital, maximum risk per trade = $100.
The 2:1 or 3:1 Rule – For every $1 risked, aim to make $2–$3.
Stop Loss & Trailing Stops – Set stop losses for protection and use trailing stops to lock profits as the trade moves in your favor.
Risk Diversification –
Across asset classes (stocks, forex, commodities, crypto).
Across sectors (IT, pharma, banking).
Across time horizons (scalping, swing, long-term).
Hedging with Options – Using protective puts or covered calls to cap downside risk.
Volatility Awareness – Adjusting position size based on market volatility (e.g., smaller trades during high VIX).
Part 6: Strategies to Grow Fast
Trend Following – Capturing large moves in trending markets. “The trend is your friend” until it bends.
Breakout Trading – Entering when price breaks major support/resistance levels with volume confirmation.
Swing Trading – Exploiting short- to medium-term price swings for consistent growth.
Position Trading – Holding positions for weeks/months based on macro or sectoral trends.
Leverage Smartly – Using moderate leverage to accelerate growth, but only when risk is tightly controlled.
Scaling In and Out – Adding to winning trades (pyramiding) and reducing exposure on uncertainty.
Part 7: Psychology of Risk Smart Growth
Trading success is 20% strategy and 80% psychology. To “risk smart, grow fast,” a trader must master their mind.
Discipline Over Impulse – Following the plan, not emotions.
Patience to Wait – Avoiding overtrading. Opportunities will always come.
Resilience to Losses – Viewing losses as part of the game, not personal failure.
Confidence Without Arrogance – Trusting your system but staying humble before markets.
Growth Mindset – Believing that skills improve with practice, not fixed by talent.
Part 8: Case Studies
Case 1: The Reckless Trader
Rahul had ₹5 lakhs and doubled it in 3 months by taking huge leveraged bets on penny stocks. But one wrong move wiped out 80% of his capital. His fast growth collapsed because he was not risk smart.
Case 2: The Risk Smart Trader
Anita had ₹5 lakhs too. She risked only 1% per trade, focused on high R/R setups, and compounded profits. In one year, she grew her account to ₹7.5 lakhs steadily. She didn’t double it overnight, but her growth was sustainable and replicable.
Lesson: Fast reckless growth often leads to collapse. Risk smart growth compounds wealth.
Part 9: Tools for Risk Smart Growth
Trading Journal – Records trades, mistakes, emotions, and improvements.
Risk Calculators – To determine position size before placing a trade.
Charting Platforms – TradingView, MetaTrader, NinjaTrader.
Backtesting Software – To validate strategies before applying real capital.
News & Data Feeds – For staying ahead of market-moving events.
AI & Algo Tools – Automating discipline and minimizing emotional decisions.
Part 10: The Roadmap to “Risk Smart, Grow Fast”
Foundation – Learn basics, risk management, and trading psychology.
System Development – Build and backtest your own trading strategy.
Capital Protection – Apply strict stop losses and position sizing.
Small Scale Trading – Start with small capital or paper trading.
Gradual Scaling – Increase trade size as consistency improves.
Compounding Phase – Reinvest profits to accelerate growth.
Mastery & Automation – Use technology and delegation for efficiency.
Conclusion
“Risk Smart, Grow Fast” is not just a slogan—it’s the essence of long-term trading success. The markets will always remain uncertain, volatile, and risky. But if you respect risk, embrace discipline, and use smart strategies, you can not only survive but thrive.
Fast growth in trading doesn’t come from reckless gambling—it comes from the slow magic of compounding, powered by smart risk management.
In the end, trading is like sailing. The winds of the market are unpredictable, but if you set your sails wisely, control your risks, and ride the waves with patience, you can reach your destination faster than you ever imagined.
Inflation Nightmare1. Introduction: Understanding Inflation
Inflation is one of the most powerful forces shaping economies, markets, and daily life. It refers to the general increase in prices of goods and services over time, reducing the purchasing power of money. While moderate inflation is normal in growing economies, an inflation nightmare occurs when prices spiral out of control, destabilizing societies and threatening livelihoods.
To visualize:
If a loaf of bread cost ₹50 last year but now costs ₹100, people feel the direct pinch.
If wages don’t rise as fast as prices, living standards fall.
If inflation expectations rise, people rush to buy today rather than tomorrow, fueling more inflation.
An inflation nightmare is not just about economics; it is also about psychology, politics, and survival.
2. Normal Inflation vs. Inflation Nightmare
Mild/healthy inflation (2–4% per year): Supports growth, encourages spending and investment.
High inflation (6–10% per year): Hurts savings, reduces confidence, and strains households.
Hyperinflation (50%+ per month): Total collapse of currency value, leading to social unrest and chaos.
An inflation nightmare lies in the last two categories—when price rises become unbearable and unpredictable.
3. Causes of Inflation Nightmare
(a) Demand-Pull Inflation
“Too much money chasing too few goods.” When demand surges faster than supply, prices rise. Example: booming economies after wars.
(b) Cost-Push Inflation
When production costs (wages, raw materials, oil, transport) rise, businesses pass costs to consumers. Example: Oil price shocks in the 1970s.
(c) Monetary Expansion
Excessive printing of money by central banks dilutes value. Example: Zimbabwe (2008), Venezuela (2010s).
(d) Supply Chain Disruptions
Pandemic lockdowns, trade wars, and shipping crises push prices higher. Example: Global supply crunch during COVID-19.
(e) Geopolitical Conflicts
Wars and sanctions disrupt trade flows, raising energy and food costs. Example: Russia-Ukraine war impacting wheat, oil, and gas prices globally.
(f) Inflation Expectations
If people believe inflation will rise, they demand higher wages, buy goods early, and businesses raise prices preemptively—creating a self-fulfilling spiral.
4. The Anatomy of an Inflation Nightmare
An inflation nightmare often unfolds in three stages:
Warning Signs – Rising food, rent, and fuel prices, currency weakening, fiscal deficits.
Acceleration Phase – Prices rise monthly, people lose trust in currency, hoarding begins.
Crisis & Collapse – Hyperinflation, barter trade, dollarization, social unrest, political change.
5. Global Case Studies of Inflation Nightmares
(a) Weimar Germany (1920s)
Reparations after WWI and money printing caused hyperinflation.
At peak, prices doubled every 3 days.
Workers were paid twice daily, rushing to buy bread before prices rose.
(b) Zimbabwe (2008)
Government printed excessive money.
Inflation reached 79.6 billion % in one month.
100 trillion Zimbabwean dollar notes became worthless.
(c) Venezuela (2013–2019)
Oil crash + political instability.
Inflation crossed 1,000,000%.
Shortages of medicine, food, and essentials.
(d) Turkey (2021–2023)
Currency crisis and unorthodox monetary policy.
Inflation surged above 80%.
People shifted savings to dollars and gold.
(e) Argentina (Recurring crises)
Chronic fiscal deficits and weak currency.
Inflation near 100% in 2022–2023.
Savings eroded, economy dollarized unofficially.
These examples show how inflation nightmares devastate middle-class savings, destroy business confidence, and topple governments.
6. Impact of Inflation Nightmare
(a) On Households
Shrinking purchasing power.
Rising food, rent, and utility costs.
Erosion of savings and pensions.
Decline in living standards.
(b) On Businesses
Rising input costs.
Uncertainty in planning and investment.
Pressure to increase prices, risking demand collapse.
(c) On Investors
Bonds and fixed deposits lose value.
Stock markets volatile.
Safe havens like gold and real estate gain.
(d) On Governments
Pressure to increase subsidies and social spending.
Difficulty in borrowing as bond yields rise.
Risk of political instability and protests.
(e) On Global Trade
Exchange rate volatility.
Higher import bills for energy and food.
Capital flight to stable economies.
7. Why Inflation Nightmares are Dangerous
Uncertainty: People don’t know future prices, making planning impossible.
Wealth Destruction: Savings, pensions, and salaries evaporate in real terms.
Inequality: Rich hedge via assets, poor suffer most.
Loss of Trust: Citizens lose faith in government and currency.
Social Chaos: Strikes, protests, and riots often follow.
8. Inflation Nightmare in the 2020s Context
COVID-19 pandemic: Stimulus packages + supply bottlenecks fueled inflation.
Russia-Ukraine War: Spikes in oil, gas, and food prices globally.
Climate Change: Crop failures push food inflation higher.
De-dollarization debates: Weakening confidence in traditional reserve currencies.
Countries like Sri Lanka (2022) faced an inflation nightmare with shortages of fuel, medicine, and food—leading to political collapse.
9. Coping Mechanisms during an Inflation Nightmare
(a) Individual Level
Shift savings to inflation-protected assets (gold, real estate, equities).
Cut discretionary spending.
Focus on skills that secure wage growth.
(b) Business Level
Hedge raw material costs.
Diversify suppliers.
Innovate with technology to reduce costs.
(c) Government Level
Tight monetary policy (raise interest rates).
Fiscal discipline (reduce deficit spending).
Strengthen currency reserves.
Subsidies for essentials to protect poor households.
10. Lessons from History
Prevention is better than cure: Once hyperinflation starts, it is hard to stop.
Trust is key: Currency depends on people’s confidence.
Independent central banks are vital for credibility.
Diversification of economy prevents over-dependence (like Venezuela on oil).
Conclusion
An inflation nightmare is more than rising prices—it is the collapse of trust in money itself. History shows how devastating it can be, destroying middle-class security, collapsing businesses, and reshaping politics.
While moderate inflation is a sign of growth, uncontrolled inflation can become a nightmare—haunting economies for decades. The key lies in responsible policies, diversified economies, and resilient households.
Just like nightmares disturb our sleep, inflation nightmares disturb the dream of economic stability.
Divergence SecretsIntroduction to Options Trading (Educational Foundation)
Options are one of the most important financial instruments available in modern markets. For a beginner, understanding them may feel overwhelming at first, but with the right approach, they can become a powerful tool for investment, speculation, and risk management.
An option is a financial contract that gives its holder the right (but not the obligation) to buy or sell an asset, such as a stock, at a predetermined price, within a fixed time frame.
There are two major types of options:
Call Option – Provides the right to buy the underlying asset at a fixed price (called the strike price).
Put Option – Provides the right to sell the underlying asset at a fixed price.
For example:
Imagine you believe Infosys stock, currently at ₹1600, will rise soon. Instead of buying the stock directly, you can buy a call option with strike ₹1650. If Infosys rises to ₹1700, your option increases in value, and you earn profit without investing the full cost of shares.
This flexibility is what makes options attractive—but also dangerous if used without proper strategies.
Why Beginners Need Strategies Instead of Random Trades
Options can generate huge profits, but they can also cause significant losses. Many beginners are tempted to “buy cheap options” hoping for quick riches. Unfortunately, statistics show that most lose money in the long run.
The reasons are:
Options lose value with time decay (Theta).
Market moves are unpredictable; random bets rarely succeed.
Beginners underestimate risk exposure.
That’s why structured strategies are necessary. A strategy gives:
Clarity – A defined plan for entry and exit.
Risk management – Limited losses instead of unlimited risk.
Flexibility – Ability to profit in different market conditions (bullish, bearish, sideways, or volatile).
In education terms: A strategy is like a map. Just as students need a study plan to pass exams, traders need strategies to succeed in markets.

Option Trading Bull Call Spread (Controlled Bullish Strategy)
Best for: Beginners expecting moderate rise in stock.
Market Outlook: Moderately bullish.
How it works:
Buy a lower strike call.
Sell a higher strike call.
Example:
Nifty at 22,000.
Buy 22,000 call at ₹150.
Sell 22,200 call at ₹80.
Net cost = ₹70.
If Nifty rises to 22,200, max profit = ₹130 (₹200 – ₹70).
Max loss = ₹70 (if Nifty stays below 22,000).
✅ Pros: Limited risk, limited reward.
❌ Cons: Not suitable if stock rises sharply.
Bear Put Spread (Controlled Bearish Strategy)
Best for: Beginners expecting moderate fall in stock.
Market Outlook: Moderately bearish.
How it works:
Buy a higher strike put.
Sell a lower strike put.
Example:
Nifty at 22,000.
Buy 22,000 put at ₹160.
Sell 21,800 put at ₹90.
Net cost = ₹70.
If Nifty falls to 21,800, max profit = ₹130.
Max loss = ₹70.
✅ Pros: Controlled loss, cheaper than naked put.
❌ Cons: Profit capped.

Part 1 Master Candlestick PatternRisk Management for Beginners
Risk management is the most important subject in options education. Even the best strategy fails without discipline.
Rules for beginners:
Never invest all capital in options (limit to 10–20%).
Always use stop-loss orders.
Trade in liquid contracts (like Nifty, Bank Nifty, large-cap stocks).
Understand Greeks (Delta = direction, Theta = time decay, Vega = volatility).
Avoid selling naked options (unlimited risk).
Common Mistakes Beginners Make
Buying cheap out-of-the-money options – They look attractive but often expire worthless.
Ignoring time decay – Options lose value daily.
Overtrading – Too many trades cause losses.
No exit plan – Holding losing positions too long.
Chasing quick profits – Leads to gambling behavior.
Educational Tips for Success
Start with paper trading to learn without risk.
Focus on 1–2 simple strategies first (covered call, spreads).
Keep a trading journal to track mistakes.
Read about market psychology.
Remember: protecting capital is more important than chasing profits.

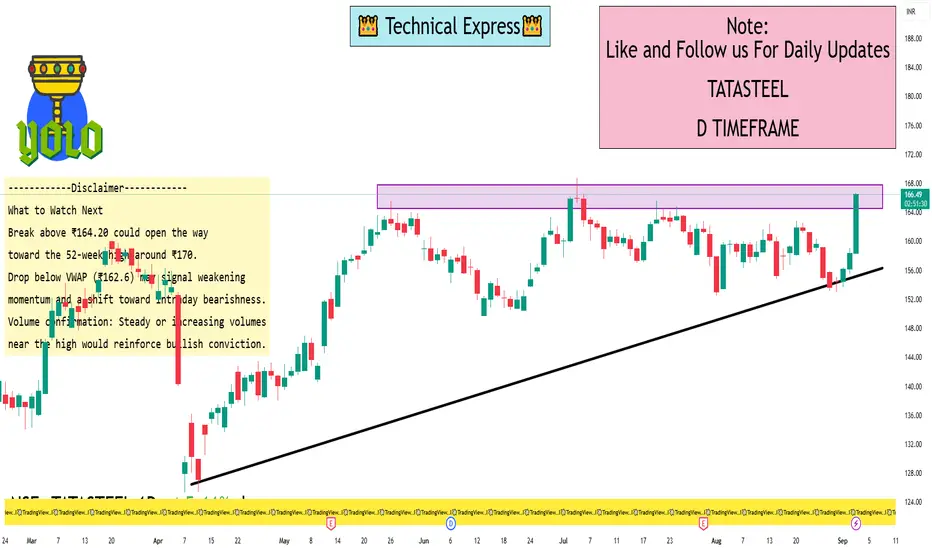
Tata Steel Ltd. 1 Day ViewKey Intraday Metrics (Sep 3, 2025 – by mid-day)
Previous Close: ₹158.39
Today’s Trading Range: ₹158.40 (Low) to ₹164.20 (High)
Latest Price: Around ₹164.42, marking a gain of approximately +3.8% for the day
VWAP (Volume-Weighted Average Price): ₹162.61
Interpretation: One-Day Price Levels
Support Level: Around ₹158.40 — this represents the daily low, serving as a key intraday support.
Resistance Level: Around ₹164.20, just below the intraday high, acting as key intraday resistance.
VWAP (~₹162.6): This level is significant—price above VWAP indicates bullish pressure; below suggests bearish sentiment.
The stock is trading above both VWAP and the previous close, which is a sign of short-term bullishness.
Additional Context & Perspective
Short-Term Trend: According to TradingView’s technical indicators, the 1-day view shows a “strong buy”, and the 1-week view remains a “buy”
Momentum & Breadth: The 50-day and 20-day moving average crossovers suggest potential follow-through, with historical averages showing gains of ~5.6% within 30 days and ~3.7% within 7 days of such signals
52-Week Range: ₹122.62 (low) to ₹170.18 (high) — today’s high sits well within this broader context
Sambhv Steel Tubes Ltd. 1 Day View Intraday Snapshot (1-Day Time Frame)
Latest Price & Movement
Price is hovering around ₹124–₹127 as of today, September 3, 2025. For instance:
Angel One reports ₹124.67 on both NSE and BSE
Economic Times cites a price of ₹126.79, reflecting a ~2.55% rise from the previous close
Intraday Range
Moneycontrol and Investing show the day’s trading range between ₹122.97 and ₹126.90
Market depth confirms bids around ₹125.90 and asks near ₹126.20, underlining a tight trading bandwidth
Support & Resistance
A technical model identifies ₹123.06 as a key support level. The stock is said to maintain its uptrend as long as it stays above this level
Quick Summary Table
Parameter Value
Price Range (Today) ₹122.97 – ₹126.90
Support Level ₹123.06
Recent Trend Uptrend supported above ₹123.06
Volume Moderate, typical for small-cap names
Technical Indicators Not specifically available for 1-day, but you can reference RSI, MACD, VWAP on chart platforms

Technical Analysis and Fundamental AnalysisIntroduction
In the world of financial markets—whether equities, commodities, currencies, or bonds—two primary schools of thought dominate the decision-making process of traders and investors: technical analysis (TA) and fundamental analysis (FA). Both are distinct in methodology and philosophy, yet they share a common goal: to forecast future price movements and identify profitable opportunities.
Technical analysis focuses on price action, charts, patterns, and market psychology, whereas fundamental analysis centers on intrinsic value, economic indicators, company performance, and long-term outlooks. Traders and investors often debate which approach is superior, but in practice, many combine elements of both to create a more holistic strategy.
This essay provides an in-depth exploration of technical and fundamental analysis, covering their history, principles, tools, strengths, weaknesses, and practical applications.
Part 1: Technical Analysis
1.1 What is Technical Analysis?
Technical analysis is the study of historical price data and volume to forecast future market movements. Unlike fundamental analysis, it does not concern itself with “why” the price moves, but rather “how” it moves. The basic premise is that market action discounts everything, meaning all known information—economic, political, psychological—is already reflected in the price.
Traders using technical analysis believe that patterns repeat over time due to human behavior and market psychology. By analyzing charts, they aim to identify trends and capitalize on them.
1.2 History of Technical Analysis
The roots of TA trace back to Charles Dow, co-founder of the Wall Street Journal and the Dow Jones Industrial Average. His writings in the late 19th century evolved into what we now know as Dow Theory.
Japanese rice traders developed candlestick charting in the 1700s, which still plays a major role in modern trading.
Over time, charting techniques evolved into a sophisticated discipline supported by algorithms and computers.
1.3 Core Principles of Technical Analysis
Market Discounts Everything
All available information is already reflected in the price.
Price Moves in Trends
Markets follow trends—uptrend, downtrend, or sideways—and these trends are more likely to continue than reverse.
History Repeats Itself
Patterns of market behavior tend to repeat because human psychology does not change.
1.4 Tools of Technical Analysis
(a) Charts
Line Charts – simple, connect closing prices.
Bar Charts – show open, high, low, close (OHLC).
Candlestick Charts – visually appealing, show the same OHLC but easier to interpret.
(b) Price Patterns
Continuation Patterns: Flags, Pennants, Triangles.
Reversal Patterns: Head and Shoulders, Double Top/Bottom, Cup and Handle.
(c) Indicators and Oscillators
Trend Indicators: Moving Averages (SMA, EMA), MACD.
Momentum Oscillators: RSI, Stochastic Oscillator.
Volatility Indicators: Bollinger Bands, ATR.
Volume Indicators: On-Balance Volume (OBV), Volume Profile.
(d) Support and Resistance
Support: a level where demand outweighs supply, preventing further decline.
Resistance: a level where supply outweighs demand, preventing further rise.
(e) Advanced Tools
Fibonacci Retracement and Extensions.
Elliott Wave Theory.
Ichimoku Cloud.
Volume Profile Analysis.
1.5 Advantages of Technical Analysis
Provides clear entry and exit signals.
Works well for short-term and medium-term trading.
Easy to visualize with charts.
Reflects collective psychology and herd behavior.
1.6 Limitations of Technical Analysis
Subjective interpretation: two analysts may read the same chart differently.
Works best in trending markets, less effective in choppy markets.
False signals can lead to losses.
Relies on past data, which may not always predict future movements.
Part 2: Fundamental Analysis
2.1 What is Fundamental Analysis?
Fundamental analysis evaluates a security’s intrinsic value by examining economic, financial, and qualitative factors. It seeks to answer: Is this stock (or asset) undervalued or overvalued compared to its true worth?
Investors use FA to make long-term decisions, focusing on earnings, growth potential, competitive advantages, management quality, and macroeconomic conditions.
2.2 Core Principles of Fundamental Analysis
Intrinsic Value vs. Market Price
If the intrinsic value is greater than market price → Buy (undervalued).
If the intrinsic value is less than market price → Sell (overvalued).
Economic and Business Cycles Matter
Markets are influenced by GDP growth, inflation, interest rates, and other macroeconomic variables.
Long-Term Focus
Fundamental analysis is best suited for long-term investors, not short-term traders.
2.3 Types of Fundamental Analysis
(a) Top-Down Approach
Starts with the global economy, then narrows to sectors, and finally selects individual companies.
(b) Bottom-Up Approach
Focuses on company-specific factors first, regardless of broader economy or sector.
2.4 Tools of Fundamental Analysis
(a) Economic Indicators
GDP growth, unemployment rates, inflation, interest rates, currency fluctuations.
(b) Industry and Sector Analysis
Porter’s Five Forces model.
Sector growth potential.
(c) Company Analysis
Quantitative Factors (Financial Statements)
Income Statement (revenue, profit, margins).
Balance Sheet (assets, liabilities, equity).
Cash Flow Statement.
Financial Ratios: P/E, P/B, ROE, ROA, Debt-to-Equity, etc.
Qualitative Factors
Management quality.
Competitive advantage (moat).
Brand value, innovation, customer loyalty.
(d) Valuation Models
Discounted Cash Flow (DCF).
Dividend Discount Model.
Price-to-Earnings and other multiples.
2.5 Advantages of Fundamental Analysis
Provides deep insights into intrinsic value.
Helps long-term investors make informed decisions.
Identifies undervalued and overvalued opportunities.
Considers broader economic and company-specific realities.
2.6 Limitations of Fundamental Analysis
Time-consuming and requires access to reliable data.
Assumptions in valuation models can be subjective.
Does not provide short-term entry/exit signals.
Markets can remain irrational longer than expected.
Part 3: Technical vs. Fundamental Analysis
Feature Technical Analysis Fundamental Analysis
Focus Price action, charts, patterns Intrinsic value, financial health
Time Horizon Short-term to medium-term Long-term
Tools Used Indicators, oscillators, chart patterns Financial statements, ratios, DCF
Philosophy “Price discounts everything” “Price may diverge from true value”
Strengths Timing trades, market psychology Identifying strong companies/assets
Weaknesses Subjective, false signals Time-consuming, subjective assumptions
Part 4: Practical Applications
4.1 Traders Using Technical Analysis
Day traders, scalpers, and swing traders rely heavily on technicals.
Example: A trader identifies bullish divergence in RSI and enters a long position.
4.2 Investors Using Fundamental Analysis
Long-term investors like Warren Buffett use FA to buy undervalued companies.
Example: Buying a company with consistent free cash flow, strong moat, and low debt.
4.3 Combining Both Approaches (Techno-Fundamental)
Many professionals combine both methods:
Use fundamental analysis to select strong companies.
Use technical analysis to time entry and exit points.
Part 5: Case Studies
Case Study 1: Reliance Industries (India)
FA View: Strong business diversification, consistent earnings growth, high market share in telecom and retail.
TA View: Technical breakout from a consolidation zone often triggers big moves.
Outcome: FA supports long-term investment, TA helps with timing.
Case Study 2: Tesla (US)
FA View: High valuation multiples, but strong growth prospects in EV industry.
TA View: Volatile price patterns with frequent trend reversals.
Outcome: Investors may hold long-term based on fundamentals but traders rely on charts to manage risk.
Part 6: Criticism and Debate
Critics of TA argue that past price cannot reliably predict future performance.
Critics of FA argue that intrinsic value is subjective, and markets often misprice assets for extended periods.
In reality, both methods reflect different perspectives: TA focuses on “when” to trade, FA focuses on “what” to trade.
Conclusion
Technical analysis and fundamental analysis are two complementary pillars of market research. While TA is driven by patterns, psychology, and momentum, FA is grounded in data, earnings, and long-term value.
For traders, technical analysis is often the weapon of choice due to its short-term applicability. For investors, fundamental analysis provides the framework for wealth creation over time. However, the most successful market participants often blend the two—using fundamentals to identify what to buy and technicals to determine when to buy or sell.
In the ever-evolving financial markets, neither approach guarantees success. Markets are influenced by countless variables—economic, geopolitical, and psychological. But by understanding both technical and fundamental analysis deeply, one can develop a balanced perspective and navigate uncertainty with greater confidence.
Quantitative Trading1. Introduction to Quantitative Trading
Quantitative trading, often called “quant trading”, refers to the use of mathematical models, statistical techniques, and computer algorithms to identify and execute trading opportunities in financial markets. Unlike traditional trading, where decisions may rely heavily on human intuition or fundamental analysis (such as studying company balance sheets or industry trends), quant trading uses data-driven models to make objective, systematic, and automated decisions.
At its core, quantitative trading answers a simple question:
Can we use numbers, patterns, and algorithms to predict price movements and make profitable trades?
Over the past few decades, quant trading has transformed financial markets. Large hedge funds, investment banks, and proprietary trading firms heavily rely on it to generate profits. In fact, some of the world’s most successful funds—such as Renaissance Technologies’ Medallion Fund—are almost entirely quant-driven.
2. The Evolution of Quantitative Trading
2.1 Early Beginnings
Quant trading is not entirely new. Even in the 1970s and 1980s, traders began using computers to run backtests and automate parts of their strategies. The Black-Scholes model (1973), which priced options mathematically, is often considered the birth of modern quant finance.
2.2 Rise of Computers and Data
In the 1990s, as computing power grew and financial markets digitized, quant trading became more widespread. Firms started processing huge amounts of tick-by-tick data to uncover hidden patterns.
2.3 High-Frequency Trading (HFT)
By the 2000s, high-frequency trading exploded. These strategies used ultra-fast algorithms to execute thousands of trades per second, capitalizing on micro-price movements.
2.4 Today’s Era
Now, quant trading has matured into multiple branches—statistical arbitrage, algorithmic execution, machine learning-driven strategies, and hybrid approaches. Artificial Intelligence (AI) and Big Data have added new layers, allowing traders to incorporate alternative data (like social media sentiment, satellite images, or shipping data) into their models.
3. Core Principles of Quantitative Trading
To understand quant trading, we need to break down its building blocks:
3.1 Data
The lifeblood of quant trading is data. Types of data include:
Market Data: Prices, volumes, bid-ask spreads, order books.
Fundamental Data: Earnings reports, balance sheets, macroeconomic indicators.
Alternative Data: Social media sentiment, credit card spending, satellite images, Google search trends.
3.2 Hypothesis and Strategy
Every quant strategy starts with a hypothesis. For example:
Stocks that fall sharply in one day tend to bounce back the next day (mean reversion).
Momentum stocks (those rising consistently) may keep rising for some time.
Statistical relationships exist between two correlated assets, like crude oil and airline stocks.
3.3 Mathematical Models
These hypotheses are turned into models using:
Statistics: Regression analysis, correlation, co-integration.
Probability: Predicting the likelihood of price changes.
Optimization: Determining the best allocation of capital across trades.
Machine Learning: Using algorithms like random forests, neural networks, or reinforcement learning to identify patterns.
3.4 Backtesting
Before risking real money, strategies are tested on historical data. The process checks:
Did the strategy work in the past?
Was it profitable after accounting for transaction costs?
How risky was it? (volatility, drawdowns, maximum loss)
3.5 Execution
Execution is the process of turning a signal into an actual trade. Execution itself can be algorithmic—using smart order routing, VWAP (Volume-Weighted Average Price) algorithms, or iceberg orders (which hide large trades).
3.6 Risk Management
Risk control is central to quant trading. Strategies are designed with limits:
Position Sizing: How much capital to allocate per trade.
Stop-Loss: Automatically cutting losses when prices move against you.
Diversification: Spreading across multiple assets, sectors, or markets.
4. Types of Quantitative Trading Strategies
Quant trading covers a wide spectrum of strategies:
4.1 Statistical Arbitrage
Exploiting price inefficiencies between related securities. Example:
If two historically correlated stocks diverge in price, a quant may short the overperformer and buy the underperformer, expecting reversion.
4.2 Trend Following
Strategies that bet on continuation of price momentum. Example:
Buy when the 50-day moving average crosses above the 200-day moving average.
4.3 Mean Reversion
Based on the belief that prices revert to their average. Example:
If a stock deviates 2 standard deviations from its mean, short it (if above) or buy it (if below).
4.4 High-Frequency Trading (HFT)
Ultra-fast algorithms that trade in microseconds. Types include:
Market Making: Posting continuous buy and sell quotes to profit from bid-ask spreads.
Latency Arbitrage: Exploiting delays in data transmission.
Event-Driven Trading: Reacting instantly to news releases or earnings announcements.
4.5 Machine Learning & AI-Driven
Using algorithms like neural networks or reinforcement learning to detect complex, non-linear relationships in data. Example:
Predicting intraday stock price direction using Twitter sentiment and order book dynamics.
4.6 Quant Macro
Models that trade currencies, bonds, and commodities based on global economic indicators like interest rates, inflation, or GDP growth.
4.7 Options & Derivatives Trading
Quant strategies often involve options due to their complexity. For instance:
Volatility Arbitrage: Exploiting differences between implied and realized volatility.
5. Tools and Technologies in Quant Trading
Quantitative trading is powered by technology. Some common tools include:
Programming Languages: Python, R, C++, Java, MATLAB.
Data Platforms: Bloomberg, Refinitiv, Quandl, Tick Data providers.
Trading Platforms: Interactive Brokers, MetaTrader, FIX protocol systems.
Libraries & Frameworks:
Python: Pandas, NumPy, Scikit-learn, PyTorch, TensorFlow.
R: Quantmod, xts, caret.
Databases: SQL, MongoDB, time-series databases.
Execution Infrastructure: Low-latency connections, co-located servers near exchanges.
6. Advantages of Quantitative Trading
Objectivity: Decisions are based on models, not emotions.
Speed: Algorithms execute trades far faster than humans.
Scalability: One model can trade across hundreds of securities simultaneously.
Backtesting: Strategies can be validated before deployment.
Diversification: Easier to spread across multiple asset classes.
7. Challenges and Risks of Quantitative Trading
Overfitting: A model may look great on past data but fail in real markets.
Market Changes: Patterns may stop working as markets evolve.
Data Quality Issues: Inaccurate or incomplete data leads to wrong signals.
High Competition: Many firms run similar models, reducing profitability.
Execution Costs: Transaction costs, slippage, and latency can eat profits.
Black-Box Risk: Complex models (especially AI) may make trades that are hard to interpret.
8. Risk Management in Quantitative Trading
Risk management is non-negotiable. Techniques include:
Value at Risk (VaR): Measuring the maximum expected loss at a given confidence level.
Stress Testing: Simulating extreme market conditions.
Stop-Losses and Circuit Breakers: Automatic exit rules to prevent catastrophic losses.
Capital Allocation Rules: Ensuring no single trade wipes out the portfolio.
9. Real-World Examples
9.1 Renaissance Technologies
Perhaps the most famous quant firm. Its Medallion Fund reportedly generates over 30–40% annual returns, net of fees, by using secretive statistical models.
9.2 Two Sigma
Another large quant fund that integrates AI, big data, and distributed computing to identify global trading opportunities.
9.3 Citadel Securities
A market-making giant using advanced quantitative models for execution and liquidity provision.
10. Ethical and Regulatory Aspects
Quant trading has sparked debates:
Fairness: Is HFT giving large firms an unfair edge?
Market Stability: Algorithms may trigger flash crashes (e.g., May 2010 Flash Crash).
Transparency: Regulators worry about opaque AI-driven “black-box” strategies.
Regulations: Different countries regulate algorithmic trading differently (e.g., SEBI in India, SEC in the U.S.).
Conclusion
Quantitative trading represents the intersection of finance, mathematics, statistics, and computer science. It replaces gut-feeling decisions with systematic, data-driven approaches, creating a more efficient and liquid marketplace.
However, quant trading is not risk-free. Over-reliance on models, data biases, or sudden market regime shifts can lead to large losses. Successful quant traders balance mathematical rigor with risk management, adaptability, and technological innovation.
As markets evolve, quantitative trading will continue to expand—shaped by AI, machine learning, alternative data, and possibly even quantum computing. The future belongs to those who can combine creativity with computation, turning raw numbers into actionable strategies.
FII and DII: The Backbone of Indian Capital Markets1. Introduction
The Indian stock market is one of the most dynamic and closely watched financial markets in the world. Every day, billions of rupees are traded, with share prices moving up and down in response to domestic and international events. Behind these movements lie the activities of two important groups of investors: Foreign Institutional Investors (FII) and Domestic Institutional Investors (DII).
While retail investors, high-net-worth individuals (HNIs), and proprietary traders also play an important role, FIIs and DIIs often act as the market movers. Their investment decisions not only influence short-term market trends but also shape the long-term growth of the financial ecosystem.
In this write-up, we will cover the concepts of FII and DII, their differences, importance, regulatory framework, market impact, historical trends, pros and cons, and their role in shaping India’s economic future.
2. Understanding FII (Foreign Institutional Investors)
2.1 Definition
Foreign Institutional Investors (FIIs) are investment institutions or entities registered outside India that invest in Indian financial markets. These include:
Pension funds
Hedge funds
Sovereign wealth funds
Insurance companies
Mutual funds
Investment banks
FIIs enter Indian markets with the objective of generating returns, benefiting from India’s growth story, and diversifying their global portfolio.
2.2 Role in the Market
They bring foreign capital into the country.
Improve liquidity by trading in large volumes.
Provide global perspective in terms of valuation and growth potential.
Help Indian markets integrate with the global financial system.
2.3 Types of FIIs
Foreign Portfolio Investors (FPIs): Invest mainly in stocks, bonds, and derivatives without having controlling stakes.
Foreign Direct Investors (FDI entities): Unlike FPIs, they invest for ownership and long-term control (factories, joint ventures, etc.).
Sovereign Wealth Funds (SWFs): Government-owned investment vehicles.
Hedge Funds & Private Equity Funds: High-risk, high-return players.
3. Understanding DII (Domestic Institutional Investors)
3.1 Definition
Domestic Institutional Investors (DIIs) are investment institutions incorporated within India that invest in Indian markets. Examples include:
Indian mutual funds
Insurance companies (LIC, ICICI Prudential, HDFC Life, etc.)
Banks
Pension funds (EPFO, NPS)
Indian financial institutions
3.2 Role in the Market
Provide stability to the market during volatile phases.
Act as a counterbalance to FIIs.
Channelize domestic savings into productive assets.
Support government disinvestment programs (for example, DIIs buying stakes in PSUs).
3.3 Sources of Funds for DIIs
Household savings through SIPs and insurance premiums.
Contributions to provident funds and pension schemes.
Long-term institutional reserves.
4. Difference Between FII and DII
Aspect FII (Foreign Institutional Investors) DII (Domestic Institutional Investors)
Origin Outside India Within India
Nature of Capital Foreign inflows Domestic savings
Impact Short-term market movers, high volatility Provide long-term stability
Currency Risk Subject to forex fluctuations No currency risk
Motivation Purely profit-driven Mix of profit motive & national economic interest
Regulation SEBI + RBI + FEMA regulations SEBI + Indian financial regulators
Market Behavior Highly sensitive to global cues (US Fed policy, crude oil prices, dollar index, etc.) More sensitive to domestic economy (inflation, fiscal policies, RBI policy, etc.)
5. Regulatory Framework
5.1 Regulation of FIIs
Securities and Exchange Board of India (SEBI): Registration and compliance.
Reserve Bank of India (RBI): Foreign exchange rules under FEMA.
Limits on investment: Sectoral caps (e.g., banks, defense, telecom).
5.2 Regulation of DIIs
SEBI: Oversees mutual funds, insurance companies, and pension funds.
IRDAI: Regulates insurance companies.
PFRDA: Governs pension funds.
RBI: Regulates banking institutions.
6. Importance of FIIs in India
Liquidity Provider: FIIs inject huge volumes of foreign capital.
Valuation Benchmarking: Their global comparison of valuation metrics helps align Indian markets with international standards.
Rupee Strength: FII inflows support India’s forex reserves and currency.
Economic Growth: Funds raised by companies through markets are fueled by FIIs.
However, FIIs can also exit quickly, causing sharp falls.
7. Importance of DIIs in India
Counterbalance to FIIs: When FIIs sell, DIIs often buy, preventing market crashes.
Utilization of Household Savings: Converts Indian savings into stock market capital.
Long-term Focus: Unlike FIIs, DIIs are not quick to exit.
Support in Government Policies: DIIs participate in PSU disinvestment.
8. Historical Trends: FII vs DII in Indian Markets
2003–2008: FIIs were dominant, driving the bull run before the global financial crisis.
2008–09 Crisis: FIIs pulled out massively, leading to a crash. DIIs helped stabilize.
2013: "Taper tantrum" – FIIs exited due to US Fed tightening.
2016 Demonetization & GST era: FIIs cautious, DIIs (via mutual fund SIP boom) became strong.
2020 COVID Crash: FIIs sold aggressively, but DIIs bought the dip.
2021–22 Bull Run: Both FIIs and DIIs invested heavily.
2022 Russia-Ukraine War & US Fed hikes: FIIs sold; DIIs supported the market.
9. Market Impact of FIIs and DIIs
Short-term trends: Often dictated by FII activity.
Long-term growth: Driven by DII investments.
Volatility: Sharp swings occur when FII flows are large.
Index levels: FIIs have a heavy influence on NIFTY, Sensex due to large-cap focus.
10. Pros and Cons of FII and DII
Pros of FIIs
Bring foreign capital.
Enhance market efficiency.
Create global visibility for Indian companies.
Cons of FIIs
Can cause volatility.
Sensitive to global events.
Currency depreciation risks.
Pros of DIIs
Provide stability.
Channelize domestic wealth.
Long-term focus.
Cons of DIIs
Limited fund pool compared to FIIs.
Sometimes influenced by government policies.
Conclusion
The interplay between Foreign Institutional Investors (FIIs) and Domestic Institutional Investors (DIIs) is the heartbeat of India’s capital markets. While FIIs provide the oxygen of foreign capital and liquidity, DIIs act as the backbone of resilience and stability. Together, they create a balanced ecosystem where volatility is managed, growth is fueled, and investor confidence is nurtured.
For retail investors, closely tracking FII and DII activity can provide deep insights into market direction. For policymakers, balancing both sources of funds ensures that India’s financial markets remain globally competitive yet domestically stable.
In the future, as India’s economy grows and becomes more integrated with the global financial system, the partnership of FIIs and DIIs will play a decisive role in shaping India’s financial destiny.

Volume Profile & Market Structure AnalysisIntroduction
In modern financial markets, traders and investors rely on both price and volume to make informed decisions. While traditional technical analysis focuses heavily on price charts, patterns, and indicators, volume profile analysis introduces a powerful dimension: it shows not just where price has moved, but also where the most significant trading activity has occurred.
Markets are not simply a story of price fluctuations — they are a narrative of participation, commitment, and liquidity. By studying how much volume has traded at each price level, traders gain insights into which levels matter most to participants. This is where the volume profile becomes a key tool.
Coupled with market structure analysis — which identifies trends, ranges, supply-demand zones, and institutional footprints — traders can develop a deeper understanding of the underlying mechanics that drive market movement.
This guide explores the concepts of volume profile and market structure in detail, blending theory with practical application.
1. Understanding Volume in Trading
Volume represents the number of contracts, shares, or lots traded during a specific period.
High volume = Strong participation, more conviction.
Low volume = Weak participation, possible indecision.
Price movement alone can be deceptive. A rally with low volume may simply be speculative or driven by a few participants. Conversely, a rally with high volume suggests genuine market consensus and institutional interest.
Thus, when price is studied together with volume, we see where money is flowing in and out of the market.
2. What is Volume Profile?
Volume Profile is a charting tool that displays trading activity over a chosen time period at specified price levels. Unlike the typical volume indicator shown below price bars (which measures activity over time), volume profile shows how much volume was transacted at each price level.
It usually appears on the side of the chart as a histogram.
Key elements:
Point of Control (POC):
The price level with the highest traded volume. It’s often seen as the market’s “fair value.”
Value Area (VA):
The range where around 70% of trading activity occurred.
Value Area High (VAH): Top of the value range.
Value Area Low (VAL): Bottom of the value range.
High Volume Nodes (HVN):
Price zones where large amounts of trading took place — representing strong support/resistance.
Low Volume Nodes (LVN):
Price levels with little trading — often act as rejection zones where price moves quickly through.
In essence, volume profile reveals where participants are most interested in trading.
3. Why Volume Profile Matters
Identifies strong support/resistance: Prices with high volume tend to act as magnets.
Reveals institutional activity: Large players accumulate or distribute around high-volume zones.
Helps detect breakouts/fakeouts: If price moves away from a value area with volume, it’s often more sustainable.
Guides risk management: Stop-loss and target levels can be aligned with volume nodes.
For example, if the POC is at 15,000 in Nifty futures, traders know this is a strong pivot point. If price is above POC, bias is bullish; if below, bearish.
4. Building Blocks of Market Structure
While volume profile explains where participants are most active, market structure explains how the market moves.
Market structure refers to the repetitive patterns of price behavior, shaped by supply and demand imbalances.
a) Phases of Market Structure
Accumulation: Institutions build positions after a downtrend. Volume increases slowly.
Markup: Price trends upward, breaking resistance levels.
Distribution: Institutions unload holdings to late buyers at higher prices.
Markdown: Market declines as selling pressure outweighs demand.
b) Market Structure Basics
Higher Highs (HH) & Higher Lows (HL): Uptrend.
Lower Highs (LH) & Lower Lows (LL): Downtrend.
Equal Highs/Lows: Range or consolidation.
Traders map these swings to understand whether the market is bullish, bearish, or neutral.
5. Integrating Volume Profile with Market Structure
When combined, these two frameworks become powerful:
Trend confirmation: In an uptrend, high-volume nodes forming higher also confirm strong institutional support.
Range identification: A wide value area often signals consolidation.
Breakout validation: If price breaks above value area with high volume, chances of continuation are strong.
Liquidity hunts: Price may dip into low-volume nodes to trap traders before reversing.
Example: If Bank Nifty is making higher highs but each move is supported by rising POC levels, it confirms strength in the trend.
6. Practical Applications for Traders
a) Day Trading with Volume Profile
Identify intraday POC and VAH/VAL.
Trade rejections from value extremes (fade strategy).
Trade breakouts above VAH or below VAL with volume confirmation.
b) Swing Trading
Use weekly/monthly volume profiles.
Enter near HVNs (support zones) and exit near opposing HVNs.
Align swing trades with broader market structure (trend direction).
c) Position Trading
Focus on long-term volume profiles (quarterly/yearly).
Look for accumulation/distribution footprints of institutions.
Hold positions around POC shifts (where market’s fair value is migrating).
7. Volume Profile Strategies
Strategy 1: Value Area Rejection
If price moves above VAH but volume doesn’t confirm, expect a return back inside the value area.
Works best in range-bound markets.
Strategy 2: Value Area Breakout
If price breaks VAH/VAL with strong volume, trade in the breakout direction.
Works best in trending markets.
Strategy 3: POC Reversal
When price revisits the POC after a strong move, watch for reversal or continuation signals.
Strategy 4: Low-Volume Node Play
Price tends to move quickly across LVNs since there’s little resistance there.
8. Market Structure Strategies
Strategy 1: BOS (Break of Structure)
When price breaks a previous swing high in an uptrend → confirms continuation.
Strategy 2: CHoCH (Change of Character)
When price shifts from making HH/HL to LH/LL → signals reversal.
Strategy 3: Liquidity Grab
Market often sweeps previous highs/lows to trigger stop-losses before moving in the real direction.
Strategy 4: Supply/Demand Zones
Identify areas of sharp moves with high volume → strong institutional orders likely exist there.
9. Case Study Example (Nifty Futures)
Imagine Nifty is trading around 19,800.
Daily volume profile shows POC at 19,750.
VAH = 19,820, VAL = 19,700.
Scenario:
Price breaks above VAH with strong volume → continuation likely.
If it rejects above 19,820 and comes back inside → fade trade down to POC.
Market structure shows HH/HL → aligns with breakout trades.
Thus, both tools together offer context + execution clarity.
10. Psychological Edge of Volume Profile & Market Structure
Traders feel more confident when trades are backed by objective volume data rather than just subjective chart patterns.
Understanding market structure helps avoid emotional decisions by providing a map of price behavior.
Together, they reduce overtrading and improve patience by waiting for high-probability zones.
Conclusion
Volume Profile and Market Structure are two complementary tools that transform how traders view the market.
Volume Profile shows the hidden story of participation, liquidity, and fair value.
Market Structure provides the roadmap of how price evolves over time.
Together, they:
Identify high-probability trading zones.
Reveal institutional footprints.
Help traders avoid emotional decisions.
However, success lies not in the tools alone but in how consistently and patiently traders apply them with risk management. Over time, these methods can provide a decisive edge in understanding and navigating financial markets.
Zero-Day Option Trading – A Complete GuideIntroduction
In the ever-evolving world of financial markets, few innovations have captured as much attention in recent years as Zero-Day-to-Expiration (0DTE) options, often called zero-day options. These are options contracts that expire on the same day they are traded. While options have existed for decades, the rise of same-day expirations has changed the dynamics of short-term trading, introducing new opportunities as well as new risks.
For traders seeking quick profits, hedging opportunities, or exposure to rapid intraday movements, zero-day options have become a favored tool. But they also come with significant dangers, often magnified compared to traditional options. Understanding how they work, why they have become so popular, and what strategies traders use is essential for anyone interested in modern derivatives trading.
This article explores zero-day option trading in detail, covering their mechanics, advantages, risks, strategies, psychology, and impact on markets.
1. What Are Zero-Day Options?
Options are derivative contracts that give the buyer the right, but not the obligation, to buy (call option) or sell (put option) an underlying asset at a predetermined price (strike price) before or on expiration. Traditionally, options had expiration cycles that were weekly or monthly.
Zero-Day Options (0DTE): These are options that expire on the same day they are traded. If you buy or sell such an option at 9:30 AM when the market opens, it will expire by the market close that same day.
Origins: Initially, exchanges like the Chicago Board Options Exchange (CBOE) offered weekly options on popular indices like the S&P 500 (SPX). Over time, demand for shorter expirations grew, leading to daily expirations. Today, in major U.S. indices, traders can find options expiring every trading day.
Key Example: The most liquid zero-day options are SPX 0DTE options, which allow traders to speculate or hedge intraday moves of the S&P 500.
In essence, 0DTE options compress what used to be a weeks-long or months-long trade into just a few hours.
2. Why Have Zero-Day Options Become Popular?
Several factors have fueled the explosion of interest in zero-day trading:
Rise of Retail Traders: Platforms like Robinhood and Zerodha have democratized access, allowing small traders to speculate intraday with relatively low capital.
Volatility Opportunities: Daily market fluctuations create many chances for fast profits.
Low Premiums: Because these contracts have almost no time value, their premiums are much cheaper than longer-term options, making them attractive to small traders.
Hedging Flexibility: Institutional players use 0DTE options to hedge positions in real-time without holding long-dated contracts.
Algorithmic Trading: Quant funds and high-frequency traders (HFTs) use 0DTE contracts to profit from micro-movements.
In short, they offer speed, flexibility, and leverage—three qualities traders love.
3. Characteristics of Zero-Day Options
Zero-day options differ from regular options in several ways:
Time Decay (Theta): Extremely rapid. An option may lose 50% of its value within an hour.
Implied Volatility (IV): Priced based on near-term expectations; sudden spikes can dramatically move premiums.
Gamma Risk: Very high. Small moves in the underlying asset lead to disproportionately large changes in option prices.
Liquidity: Typically very high in indices like SPX and Nifty Bank in India, enabling easy entry and exit.
Settlement: Most are cash-settled in indices, reducing delivery risk.
These properties make them both powerful trading tools and dangerous traps.
4. Advantages of Zero-Day Option Trading
High Leverage: Small premium outlay, large exposure.
Quick Turnaround: Ideal for intraday traders who want same-day settlement.
Hedging Capability: Institutions hedge unexpected intraday risks.
Lower Capital Requirement: No need to lock money for weeks.
Multiple Expiration Choices: Ability to tailor trades to exact days of market events (Fed meeting, earnings, etc.).
5. Risks of Zero-Day Option Trading
Despite the allure, 0DTE options are not for the faint-hearted:
Near-Total Premium Loss: Out-of-the-money contracts can expire worthless within hours.
Emotional Stress: Requires rapid decision-making; mistakes are common.
Gamma Squeeze Risk: Sudden moves cause exponential losses for sellers.
Limited Recovery Time: Unlike longer options, there’s no time to wait for reversal.
Overtrading: Easy access and cheap premiums tempt traders into gambling.
This is why professional traders often warn beginners against 0DTE trading unless they fully understand the risks.
6. Strategies in Zero-Day Option Trading
6.1 For Buyers
Directional Bets: Buy calls if bullish, puts if bearish. Best suited when expecting large intraday moves.
Lottery Tickets: Out-of-the-money calls/puts bought cheaply in hope of a big payoff.
6.2 For Sellers
Iron Condors / Spreads: Collect premiums by selling options with defined risk. Effective in low-volatility environments.
Straddles / Strangles: Sell both calls and puts to benefit from time decay, but risky if the market moves sharply.
Scalping with Credit Spreads: Institutions often sell 0DTE spreads to collect small but consistent income.
6.3 Advanced
Gamma Scalping: Adjusting delta exposure dynamically as prices move.
Event Plays: Trading around economic announcements (Fed rate decisions, jobs data, RBI policy in India).
7. Psychology of Zero-Day Trading
Trading 0DTE options is as much about psychology as strategy:
Discipline: Entering and exiting trades quickly.
Risk Control: Position sizing is critical since losses can escalate rapidly.
Avoiding Addiction: The lottery-like thrill can lead to compulsive trading.
Emotional Balance: Traders must accept frequent small losses and avoid revenge trading.
8. Institutional vs. Retail Participation
Retail Traders: Generally buyers, attracted to low-cost “lottery” trades.
Institutions: Primarily sellers or hedgers, using spreads and systematic strategies. They often exploit retail demand.
This asymmetry explains why retail often loses money while institutions profit consistently.
9. Zero-Day Options in India
In India, the NSE (National Stock Exchange) has introduced same-day weekly options expiries for Nifty and Bank Nifty. Every day now has an expiry, mirroring the U.S. trend.
Retail participation has surged due to low premiums.
Brokers have reported record turnover in Bank Nifty 0DTE contracts.
Regulators are closely monitoring systemic risks.
This trend is reshaping intraday derivatives trading in India.
10. Criticism and Concerns
Market Stability Risks: Some analysts argue that widespread 0DTE trading increases volatility.
Retail Losses: Evidence suggests most small traders lose money due to poor risk management.
Speculative Nature: Critics compare it to gambling, given how quickly money can be lost.
Despite these concerns, exchanges continue to expand offerings due to high demand.
Conclusion
Zero-day option trading is one of the most exciting yet dangerous developments in modern financial markets. It has transformed options into ultra-short-term instruments, blending elements of speculation, hedging, and high-frequency trading. For disciplined traders who understand risk, 0DTE options offer powerful opportunities. For undisciplined traders, they can be financial landmines.
In summary:
They offer speed, leverage, and flexibility.
They come with extreme risks, especially for retail traders.
Their rise is reshaping both U.S. and Indian derivatives markets.
Ultimately, success in zero-day options lies in combining knowledge, strategy, and psychology—while never forgetting the golden rule of trading: preserve capital first, seek profits second.
Part 9 Trading Masterclass With ExpertsIntroduction to Options
An option is a type of derivative contract. A derivative derives its value from an underlying asset, which could be a stock, index, commodity, currency, or bond. When you buy or sell an option, you don’t directly own the asset but instead own the right to buy or sell it at a pre-agreed price within a specific period.
At its core, an option is a contract between two parties:
The buyer (holder) of the option, who pays a premium for rights.
The seller (writer) of the option, who receives the premium and carries obligations.
Unlike shares, where ownership is straightforward, options deal with probabilities, rights, and conditions. This makes them flexible but also more complex.
Key Features of Options
Before diving deeper, let’s simplify the main features:
Underlying Asset – The financial instrument on which the option is based (e.g., Reliance Industries stock, Nifty50 index).
Strike Price (Exercise Price) – The price at which the underlying asset can be bought or sold.
Expiration Date (Maturity) – The last date the option can be exercised.
Option Premium – The cost of buying the option, paid upfront by the buyer to the seller.
Right but Not Obligation – The buyer can choose to exercise the option but is not compelled to.

Part 7 Trading Masterclass With ExpertsOptions Greeks and Their Role
Every strategy depends heavily on the Greeks:
Delta: Sensitivity to price changes.
Gamma: Rate of change of delta.
Theta: Time decay of option value.
Vega: Sensitivity to volatility.
Rho: Sensitivity to interest rate changes.
Traders use Greeks to fine-tune strategies and manage risk exposure.
Risk Management in Options
Risk control is crucial. Key principles:
Never risk more than you can afford to lose.
Use spreads instead of naked options.
Monitor Greeks daily.
Diversify across strikes and expiries.
Set stop-loss and exit plans.

Part 6 Institutional Trading Advanced & Professional Strategies
(a) Butterfly Spread
Combination of 3 strike prices (buy 1 low strike call, sell 2 middle strike calls, buy 1 high strike call).
Profits from minimal price movement.
(b) Calendar Spread
Sell near-term option and buy long-term option at the same strike.
Profits from time decay difference.
(c) Ratio Spread
Buy 1 option, sell 2 options at different strikes.
Increases reward potential but adds risk.
(d) Box Spread
Arbitrage-like strategy combining bull and bear spreads.
Used by professionals for risk-free returns (if pricing inefficiency exists).

Part 4 Institutional Trading Intermediate Strategies
(a) Bull Call Spread
Buy a call at lower strike and sell a call at higher strike.
Reduces cost but caps profit.
Good for moderately bullish markets.
(b) Bear Put Spread
Buy a put at higher strike, sell a put at lower strike.
Used in moderately bearish markets.
(c) Straddle
Buy one call and one put at the same strike and expiry.
Profits if stock makes a big move in either direction.
Expensive, requires high volatility.
(d) Strangle
Buy OTM call + OTM put.
Cheaper than straddle but needs a larger price move.
(e) Iron Condor
Combination of bull put spread + bear call spread.
Profits when price stays in a range.
Great for low-volatility environments.

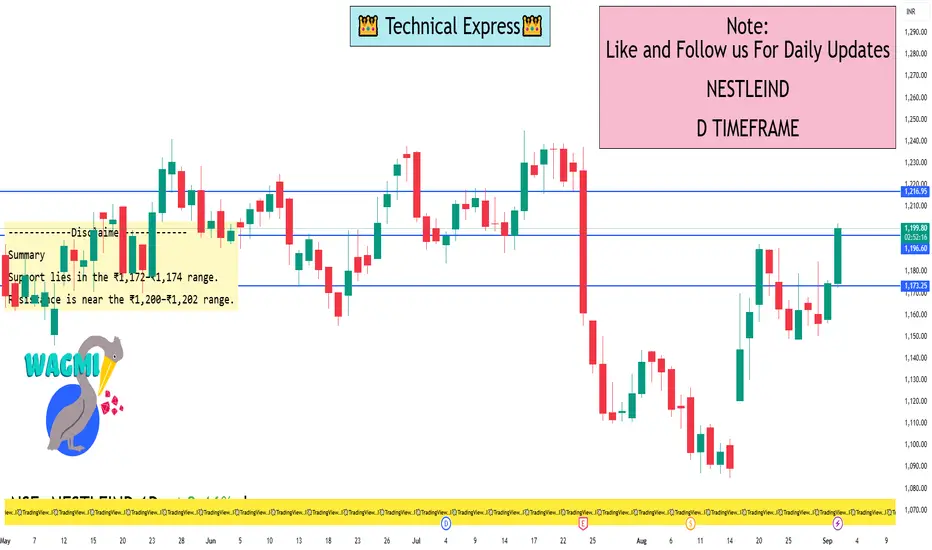
Nestlé India Ltd. 1 Day ViewCurrent Intraday Range & Price Highlights
Today's price movements show Nestlé India trading within a range of approximately ₹1,172 to ₹1,202, with the most recent prices hovering around ₹1,198.
As of September 1, 2025 (Monday), the stock closed at ₹1,174.20, marking a 1.61% gain, outperforming the Sensex, which was up by 0.70%.
1-Day Technical Levels
Level Type Price (Approx.)
Support (Intraday Low) ₹1,172–₹1,174
Resistance (Intraday High) ₹1,202
Previous Close ₹1,174.20
VWAP (Indicative) ₹1,188–₹1,189
These levels represent key intraday zones traders often monitor for entry, exit, or trend confirmation.
Summary
Support lies in the ₹1,172–₹1,174 range.
Resistance is near the ₹1,200–₹1,202 range.
VWAP (~₹1,189) suggests the average traded price today, offering insight into overall sentiment.
The previous day’s strong close (₹1,174.20) can act as both support and a momentum benchmark.
Pidilite Industries Ltd. 4 Hour View While most platforms don’t explicitly publish 4-hour support/resistance levels, we can gather actionable insights from intraday pivot data and community analysis reflecting this timeframe.
Intraday Pivot & Intra-Day Levels
Intraday support levels: ₹3,028.27 and ₹3,006.23
Intraday resistance levels: ₹3,071.17 and ₹3,092.03
Important short-term S/R: Support around ₹3,026.92–₹3,010.53, Resistance at ₹3,073.68–₹3,132.97
These constitute solid reference points for trades over multi-hour windows.
Price Action & Chart Patterns
A trading idea on TradingView highlights a Head & Shoulders formation on the 4-hour chart, with the ₹3,000 round level acting as a potential support (neckline). The suggestion: watch for a breakdown below the neckline followed by a candle-close and retest before considering long trades. If the price rejects again from ₹3,000, that could be a bullish setup.
Quick Summary for 4-Hour Trading
Feature Details
Support Zone ₹3,006–₹3,028 (intraday anchors) and psychological ₹3,000 level
Resistance Zone ₹3,071–₹3,092 and broader zone up to ₹3,130
Pattern Insight 4-hour Head & Shoulders suggests bearish risk if breakdown occurs
Suggested Approach
Watch ₹3,000 closely.
If it holds and price rejects downward moves, look for long setups.
If it breaks decisively with confirmation (e.g., candle close), it may signal further decline—be cautious.
Use intraday pivot levels to anticipate moves.
Support near ₹3,006–₹3,028 can provide entry opportunities for rebounds.
Resistance near ₹3,071–₹3,092 acts as supply zones to monitor for pullbacks or breakout attempts.
Combine with other indicators such as volume, RSI, MACD, or trend filters for stronger signal confirmation.
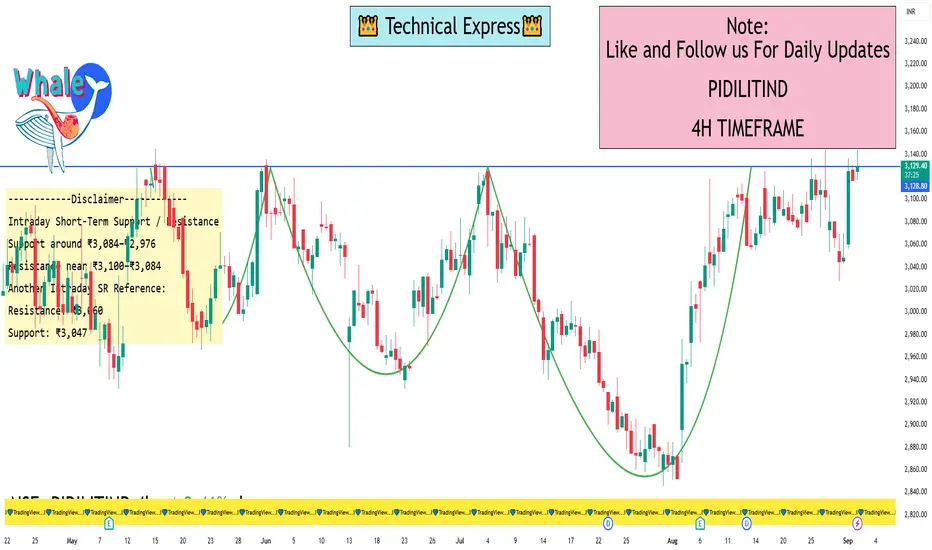
Part 2 Master Candlestick PatternOptions in Global Markets
US Market: Options on stocks like Apple, Tesla, S&P500.
Europe: Eurex exchange trades DAX options.
India: NSE is Asia’s largest derivatives market.
Global options markets allow hedging and speculation across geographies.
The Psychology of Options Trading
Fear and greed dominate decisions.
Beginners often chase quick profits.
Professionals focus on probabilities, not predictions.
Patience and discipline are key.
Future of Options Trading
Increasing retail participation in India.
Weekly expiries, more instruments expected.
AI & Algo trading to dominate.
More global integration with India’s markets.

PCR Trading Strategy Options Strategies (Beginner to Advanced)
Options allow many strategies:
Beginner:
Buying Calls & Puts – Simple directional trades.
Intermediate:
Covered Call – Sell call against owned stock.
Protective Put – Buy put to protect long positions.
Advanced:
Straddle – Buy call + put (expect volatility).
Strangle – Similar, but with different strikes.
Iron Condor – Profits from sideways markets.
Butterfly Spread – Low-risk range-bound strategy.
Options in the Indian Market
Traded mainly on NSE (National Stock Exchange).
Popular instruments: Nifty, Bank Nifty, FinNifty, and top stocks.
Expiry cycles: Weekly (Thursday) and Monthly.
Lot sizes fixed by SEBI (e.g., Nifty lot = 25).
India is one of the world’s largest options markets today.

Part 2 Support and ResistanceKey Terms in Options Trading
Before diving deeper, let’s understand some key terms:
Strike Price: The fixed price at which you can buy/sell the asset.
Premium: The price paid to buy the option.
Expiry Date: The date on which the option contract expires.
Lot Size: Options are traded in lots (e.g., 25 shares per lot for Nifty options).
In-the-Money (ITM): When exercising the option is profitable.
Out-of-the-Money (OTM): When exercising would cause a loss.
At-the-Money (ATM): When the strike price = current market price.
Option Buyer: Pays premium, has limited risk but unlimited profit potential.
Option Seller (Writer): Receives premium, has limited profit but unlimited risk.
Types of Options – Calls and Puts
Call Option (CE)
Buyer has the right to buy.
Profits when the price goes up.
Put Option (PE)
Buyer has the right to sell.
Profits when the price goes down.
Example with Reliance stock (₹2500):
Call Option @ 2600: Profitable if Reliance goes above ₹2600.
Put Option @ 2400: Profitable if Reliance goes below ₹2400.
