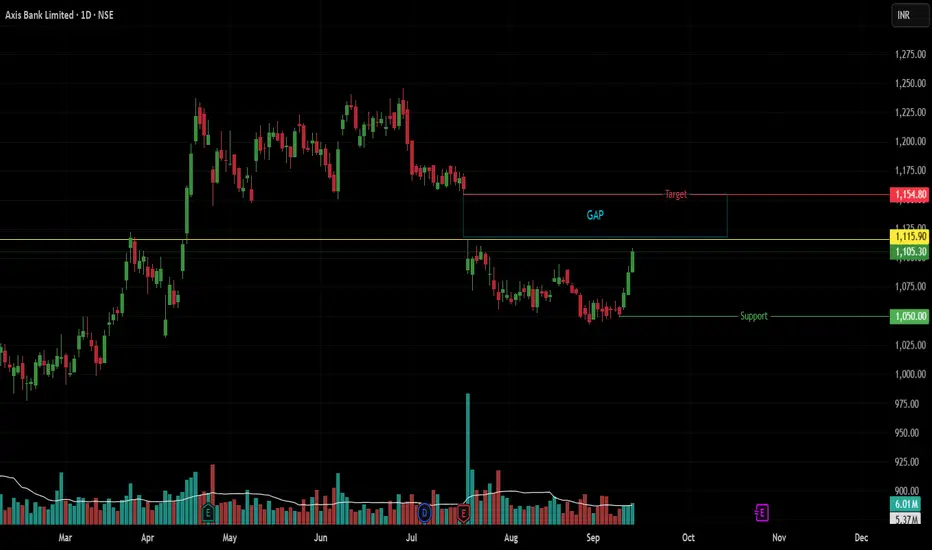
AXISBANK at ₹1115: Breakout or Rejection?Scrip: Axis Bank | Exchange: NSE | Timeframe: Daily
Summary:
Price is approaching a significant resistance level at ₹1115, which was the high of the July 18th gap-down session. A high-volume breakout above this level could trigger a move to fill the gap up to ₹1154. Conversely, a rejection at this resistance could lead to a decline.
Price Action Analysis:
Key Resistance: ₹1115 (The high of the massive gap-down day on July 18). This is the key level to watch.
Gap Analysis: The gap exists between the July 17 low (₹1154) and the July 18 open (₹1090). The first major hurdle to filling it is overcoming the ₹1115 high from that same day.
Key Support: ₹1050 (Recent Swing Low).
Scenario 1: Bullish Breakout (Gap Fill Play)
This scenario requires a true breakout, confirmed by a strong volume surge.
Trigger: A daily candle closing decisively above ₹1115.
Volume Confirmation: The breakout must be supported by significantly higher-than-average volume. This is essential for a "true" breakout and confirms real buying pressure.
Entry: High of the breakout candle (on closing basis).
Stop Loss: Low of the breakout candle.
Target: ₹1154 (To fill the July gap).
Scenario 2: Bearish Rejection (Resistance Hold)
This scenario plays out if the ₹1115 level holds as strong resistance.
Trigger: A clear bearish reversal candlestick at the ₹1115 resistance (e.g., a Shooting Star or Bearish Engulfing pattern on the daily timeframe).
Entry: Low of the reversal candle.
Stop Loss: High of the reversal candle.
Target: ₹1050.
Disclaimer: This is a technical analysis idea and not financial advice. Trading carries a risk of loss. Past performance is not indicative of future results. Always conduct your own research and manage your risk appropriately.
Axisbankview
Volume Profile & Market Structure1. Introduction
If you have ever looked at a stock or index chart, you’ll notice prices move up, down, or sometimes just sideways. Traders are always trying to answer one simple question:
👉 Where is the market likely to go next?
To answer that, two powerful tools come into play:
Market Structure → tells us the story of price movement by showing how highs, lows, and trends form.
Volume Profile → shows us where the biggest battles between buyers and sellers happened by plotting traded volumes at different price levels.
Think of Market Structure as the “skeleton” of price movement, and Volume Profile as the “blood flow” that shows which areas have real strength and participation. When combined, these tools help traders understand who controls the market (buyers or sellers) and where important levels are for making decisions.
In this guide, we’ll break down these concepts step by step in simple language so you can use them in real-world trading.
2. Understanding Market Structure
Market structure simply means the framework of how price moves over time. It helps traders identify the trend, key levels, and potential reversals.
2.1 What is Market Structure?
At its core, market structure is about recognizing patterns in price:
When the market is making higher highs (HH) and higher lows (HL) → it’s in an uptrend.
When the market is making lower highs (LH) and lower lows (LL) → it’s in a downtrend.
When the market is not making new highs or lows, just bouncing within levels → it’s in a range.
📌 Example:
If Nifty goes from 19,000 → 19,200 → 19,100 → 19,400 → 19,250, we can see it’s making higher highs and higher lows, which means buyers are stronger.
2.2 Why Market Structure Matters
It shows the direction of the market.
Helps identify good entry and exit points.
Builds discipline (you trade with the trend, not against it).
2.3 Phases of Market Structure
Markets move in cycles. These are usually broken into four phases:
Accumulation Phase
Big players (institutions) quietly buy at low prices.
Price moves sideways.
Volume is steady but not explosive.
Uptrend/Advancing Phase
Price starts breaking resistance levels.
Higher highs and higher lows form.
Retail traders notice and start buying.
Distribution Phase
Big players slowly sell to latecomers.
Market looks like it’s topping out.
Price often moves sideways again.
Downtrend/Decline Phase
Price starts making lower highs and lower lows.
Panic selling happens.
Eventually, smart money will start accumulating again → cycle repeats.
2.4 Break of Structure (BOS) & Change of Character (ChoCh)
Two important concepts:
Break of Structure (BOS): when price breaks the previous high/low, signaling continuation of trend.
Change of Character (ChoCh): when price shifts from uptrend to downtrend (or vice versa). This often signals a reversal.
📌 Example:
If Bank Nifty keeps making higher highs but suddenly makes a lower low, that’s a ChoCh – trend may reverse.
2.5 Market Structure Across Timeframes
On higher timeframes (daily/weekly) → structure shows the big trend.
On lower timeframes (5-min, 15-min) → structure shows intraday opportunities.
Smart traders align both (called multi-timeframe analysis).
3. Understanding Volume Profile
Now that we understand how price moves, let’s look at the Volume Profile – the tool that shows where traders are most active.
3.1 What is Volume Profile?
Unlike the normal volume indicator (bars at the bottom of the chart showing volume per time), Volume Profile plots volume at each price level.
So instead of asking: “How much was traded at 10:30 AM?”
We ask: “How much was traded at ₹19,200, ₹19,300, ₹19,400?”
This gives a much clearer picture of where buyers and sellers are fighting hardest.
3.2 Key Elements of Volume Profile
POC (Point of Control):
The price level where the highest volume was traded.
Acts like a magnet – price often returns to this level.
Value Area (VA):
The range of prices where around 70% of the volume occurred.
Consists of:
VAH (Value Area High): top of this range.
VAL (Value Area Low): bottom of this range.
High Volume Nodes (HVN):
Price zones with heavy volume.
Represent areas of acceptance (market agrees fair value is here).
Low Volume Nodes (LVN):
Price zones with very little volume.
Represent areas of rejection (market quickly moved away).
📌 Simple Analogy:
Imagine an auction. Where people bid the most (POC), that’s the “fair price.” Places where few bids happen (LVN) are “unwanted” areas.
3.3 Why Volume Profile Matters
Shows real support & resistance (not just lines on charts).
Helps spot false breakouts (price goes above resistance but fails if volume is low).
Identifies where big players (institutions) are active.
3.4 Difference Between Volume Profile & Normal Volume
Normal Volume: tells when activity happened.
Volume Profile: tells where activity happened.
4. Combining Market Structure with Volume Profile
This is where magic happens.
Market structure tells us direction, and volume profile tells us important levels. Together, they give high-probability setups.
4.1 Example Setup: Trend Confirmation
If market is in uptrend (HH, HL structure) →
Look at POC/VAH. If price holds above these, trend is strong.
4.2 Example Setup: Reversal Spotting
If price breaks structure (ChoCh) AND rejects at an LVN, it signals strong reversal.
4.3 Example Setup: Liquidity Zones
Many traders put stop losses above resistance/below support.
Volume Profile helps spot whether these breakouts are real (with volume) or fake (low volume).
5. Trading Strategies Using Market Structure + Volume Profile
Let’s go through practical trading approaches.
5.1 Trend Trading Strategy
Identify trend with market structure (HH/HL for uptrend, LH/LL for downtrend).
Use POC/VAH/VAL as entry levels.
Enter with trend direction, place stop below VAL (for long) or above VAH (for short).
5.2 Range Trading Strategy
If market is sideways → watch Value Area.
Buy near VAL, sell near VAH.
Exit near POC.
5.3 Breakout Strategy
If market breaks resistance with high volume (confirmed by VP), enter breakout.
If breakout happens at LVN, it usually moves fast.
5.4 Reversal Strategy
Look for ChoCh in market structure.
Confirm with rejection at HVN/LVN.
Enter opposite direction.
5.5 Scalping (Intraday)
Use lower timeframes (5-min, 15-min).
Enter at POC retests.
Target small moves (20–30 points in Nifty).
5.6 Swing Trading (Positional)
Use higher timeframe VP (daily/weekly).
Identify major HVN (support) & LVN (breakout zones).
Ride bigger moves.
6. Risk Management & Psychology
Even with the best tools, without risk management you can lose money.
Stop Loss: always place stops beyond HVN/LVN levels.
Position Sizing: never risk more than 1–2% of capital per trade.
Patience: wait for price to confirm at volume profile levels, don’t jump early.
Discipline: follow your system, don’t let emotions rule.
7. Common Mistakes Traders Make
Ignoring Higher Timeframe Levels → focusing only on 5-min charts without seeing big picture.
Chasing Breakouts Without Volume Confirmation → leads to false breakout traps.
Overloading Chart with Indicators → volume profile + market structure are enough.
No Risk Management → one bad trade wipes profits.
8. Conclusion & Key Takeaways
Market Structure = Direction (trend, BOS, ChoCh, HH/HL, LH/LL).
Volume Profile = Importance (POC, VAH, VAL, HVN, LVN).
Combined → they show who controls the market and where to enter/exit safely.
📌 Golden Rule:
Trade with the structure and around the volume zones → your accuracy improves dramatically.
By using both tools together, you stop trading blindly and start trading with the footsteps of institutions.
Technical Analysis Concepts1. Introduction to Technical Analysis
Technical Analysis (TA) is the study of market price action—primarily through charts—to forecast future price movements.
It’s built on the idea that “Price discounts everything”, meaning that all known information—economic data, company performance, market sentiment—is already reflected in the price.
In simpler words:
If you want to know what’s happening in a market, don’t just listen to the news—look at the chart.
Key Principles of Technical Analysis
There are three main pillars:
Price Discounts Everything
Every fundamental factor—earnings, interest rates, political events—is already reflected in price.
Traders believe price moves because of demand and supply changes that show up on charts before news does.
Price Moves in Trends
Markets rarely move in random zig-zags—they tend to trend:
Uptrend: Higher highs and higher lows
Downtrend: Lower highs and lower lows
Sideways: No clear direction
History Tends to Repeat Itself
Human psychology—fear, greed, hope—hasn’t changed over centuries. Chart patterns that worked 50 years ago often still work today.
2. Types of Technical Analysis
Broadly, TA can be split into:
A. Chart Analysis (Price Action)
Patterns, trendlines, support, resistance
Focuses purely on price movements
B. Indicator-Based Analysis
Uses mathematical formulas applied to price/volume
Examples: RSI, MACD, Moving Averages
C. Volume Analysis
Studies how much activity supports a price move
Strong moves with high volume = higher reliability
D. Market Structure Analysis
Understanding swing highs/lows, liquidity zones, and institutional footprints
3. Charts and Timeframes
Technical analysis starts with a chart. There are different chart types:
Line Chart – Simplest, connects closing prices. Good for a big-picture view.
Bar Chart – Shows open, high, low, close (OHLC).
Candlestick Chart – The most popular, visually intuitive for traders.
Timeframes
Choosing the right timeframe depends on your trading style:
Scalpers: 1-min to 5-min charts
Intraday Traders: 5-min to 15-min
Swing Traders: 1-hour to daily
Position Traders/Investors: Weekly to monthly
Rule of thumb:
Higher timeframes = stronger signals, but slower trades.
Lower timeframes = faster signals, but more noise.
4. Trends and Trendlines
A trend is simply the market’s general direction.
Types of Trends
Uptrend → Higher highs, higher lows
Downtrend → Lower highs, lower lows
Sideways (Range-bound) → Price moves within a horizontal band
Trendlines
A trendline is drawn by connecting at least two significant highs or lows.
In an uptrend: Connect swing lows
In a downtrend: Connect swing highs
They act as dynamic support or resistance.
5. Support and Resistance
Support: A price level where buying pressure is strong enough to halt a downtrend.
Resistance: A price level where selling pressure stops an uptrend.
How They Work
Support → Demand > Supply → Price bounces
Resistance → Supply > Demand → Price drops
Pro Tip: Once broken, support often becomes resistance and vice versa—this is called role reversal.
6. Chart Patterns
Chart patterns are visual formations on a chart that indicate potential market moves.
A. Continuation Patterns (Trend likely to continue)
Flags – Short pauses after sharp moves
Pennants – Small symmetrical triangles
Rectangles – Price consolidates between parallel support/resistance
B. Reversal Patterns (Trend likely to change)
Head and Shoulders – Signals a bearish reversal
Double Top/Bottom – Two failed attempts to break a high/low
Triple Top/Bottom – Similar to double but with three attempts
C. Bilateral Patterns (Either direction possible)
Triangles – Symmetrical, ascending, descending
7. Candlestick Patterns
Candlestick patterns are short-term signals of buying or selling pressure.
Bullish Patterns
Hammer – Long lower shadow, small body
Bullish Engulfing – Large bullish candle covers previous bearish candle
Morning Star – Three-candle reversal pattern
Bearish Patterns
Shooting Star – Long upper shadow
Bearish Engulfing – Large bearish candle covers prior bullish candle
Evening Star – Three-candle bearish reversal
8. Technical Indicators
Indicators help confirm price action or generate signals.
A. Trend Indicators
Moving Averages (SMA, EMA)
MACD – Measures momentum and trend changes
Parabolic SAR – Trailing stop tool
B. Momentum Indicators
RSI – Overbought (>70) / Oversold (<30) conditions
Stochastic Oscillator – Compares closing price to price range
CCI – Commodity Channel Index for momentum shifts
C. Volatility Indicators
Bollinger Bands – Show price deviation from average
ATR (Average True Range) – Measures volatility strength
D. Volume Indicators
OBV (On-Balance Volume) – Volume flow analysis
VWAP – Volume-weighted average price, used by institutions
9. Volume Profile and Market Structure
Volume Profile shows how much trading occurred at each price level, not just over time.
It highlights:
High Volume Nodes (HVN) → Strong price acceptance
Low Volume Nodes (LVN) → Price rejection zones
Market Structure is about identifying:
Higher highs / higher lows (uptrend)
Lower highs / lower lows (downtrend)
Liquidity pools (where stops are likely)
10. Dow Theory
Dow Theory is the grandfather of trend analysis.
Its principles:
Market discounts everything.
Market has three trends: Primary, secondary, minor.
Trends have three phases: Accumulation, public participation, distribution.
A trend is valid until a clear reversal occurs.
Conclusion
Technical analysis is not about predicting the future with 100% accuracy—it’s about improving probabilities.
A good TA trader:
Understands trends and patterns
Combines multiple tools for confirmation
Manages risk and keeps emotions in check
Remember:
TA gives you the edge, risk management keeps you in the game.

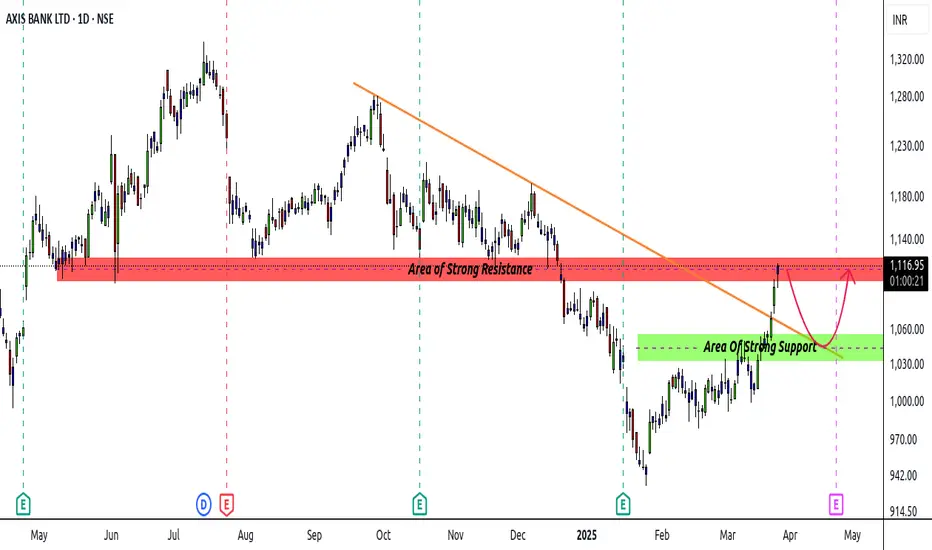
Axis Bank - Possible ResistanceStock in sideways to uptrend past few weeks
Right now reaching a DBD area + Flip zone
Combine resistance area from 1115 - 1125
Stock may go sideways and if possible try to move downwards upto 1040 - 50 levels
Upside Sl can be kept above 1030 (CLBS)
Whole market is in minor uptrend so be cautious before taking a counter trade
Take confirmation from LTF
Axis Bank - Tough times aheadRecently stock managed to breach the yearly low of around 994 and went downhill upto 933
We saw some buying from the same areas as it had monthly n weekly demand zones
With that stock managed to pull itself back to 1k+ levels
But it seems struggling days are not yet over for axis
As we can clearly see, stock has got multiple and strong resistance point on daily time frame
1st starts immediately as a gap resistance zone between 1015 to 1030
2nd area at 1035 to 45
3rd at 1050 to 60
4th at 1085 to 95
5th from 1105 to 1120
Stock may or will try to reverse from these points in coming days
Alerts can be set accordingly
Lower TF confirmation is a must before entering
R:R on each level is excellent
Trade accordingly and cautiously

Axis Bank : Swing Trade Pick#axisbank #swingtrade #momentumtrade #trendingstock
Axis Bank : Swing Trade
>> Low PE Stock
>> Banking Sector Theme, most likely to perform
>> Trending stock
>> Low Risk Trade
Swing Traders can lock profit at 10% and keep Trailing
Please Boost, comment and follow us for more Learnings.
Note : Markets are still Tricky and can go either ways so don't be over aggressive while choosing & planning your Trades, Calculate your Position sizing as per the Risk Reward you se and most importantly don't go all in
Disc : Charts shared are for learning purpose only, not a Trade recommendation. Do your own research and consult your financial advisor before taking any position.

Axis Bank breakout buy above the breakout onlyAxis Bank breakout buy above the breakout only, Axis has been hammered due to results, it can bounce, levels on the chart
R:R very good .1:3.2
B uy only if level triggers above 994, Future
If you want to hedge sell 1000 Call or not

AXIS BANK LEVELSSupport Level of AXIS BANK
Buy axis bank on these levels 987 when in hourly oversold region on intraday basis
823 is for positional buyers.
Don't short Axis bank on positional basis as it has not given enough return on 5 yearly basis
Fresh long trades now are not avaialble as market is weak
Consult your financial advisor before trading

Axis Bank Simple Trend Analysis!!AB can bounce from 1169 to 1189 in coming days and Ab has broken daily & weekily resistance trendline and also retested at the end on the day.
May a bounce can come if open above weekly trendline (1170) or gap up. if not another buying oppurtunity is will be at 1144 where both daily n weekly are intersecting.

Axis Bank - Possibly BearishStock after good uptrend seems to be in a corrective mode
Created Multiple supply zones in various TFs
Last few minor supports left to be broken
Now strong resistance at 1265-70 can be used as SL
Can be sold on rise with proper RR

AXIS BANK Swing Long Update - Axis Bank is currently trading at 1232
- Axis Bank swing long was posted a week back and now all my expected targets have been purged
- If you are holding Axis try locking in a major chunk of your gains
- I am anticipating that Axis Bank can soon start retracing now
- Watch out if you are holding aggressive longs

AXISBANK complete domination by bulls this week AXISBANK looks to resume the uptrend to new highs as this week was overwhelmed by strong buying by forming an engulfing candle on weekly . Looks good buying opportunity with SL with this week's low
Cheers

Axis Bank Long Setup - Axis Bank is currently trading at 1175
- BNF is carrying a bullish structure and at the same time Axis Bank is trying to form a base
- Axis Bank looks for a swing long around 1155-1164
- Watch out for the invalidation before looking for longs
- The structure looks intact and it will soon expand towards the upside as long the index doesn't collide.

Axis Bank - Pull Back TradeStrong demand zone area 1115-1135
Wait till stock reaches the area
May consolidate a while before making an upmove
Breach of 1100 will make the stock fall further, which right now dosent seems possible
Risk to rewards looks promising

Axis Bank Good Long BetAXIS BANK looks good long opportunity to buy at dips, with bank nifty looking strong.Axis Bank looks good buy at current market price as price looks to take support at breakout point , trendline and weekly EMA.
Good opportunity as long as price stays above 1,100
Cheers

Axis Bank Wave Analysis: SIP, Levels, 1800+ in coming years! July 2, 2024: AXIS Bank Market Analysis
Current Market Price: 1261.90
General Trend:
After the COVID crash of 2020, Axis Bank hit a high of 865 on October 21st , 2021, completing Wave 1 and entered Wave 3 after completion of wave 2 on June 16th 2022.
The stock is currently in a bullish mode and it's in extension, having completed subwaves 1 and 2 of Wave 3 and it has broken out of a consolidation zone and is looking to surge ahead with subwave 3 of Wave 3.
Ichimoku Cloud:
Applying the Ichimoku cloud to the chart shows that prices are trading above the Monthly, Weekly, and Daily clouds. Hence, there is a high possibility of the stock entering Wave 3.3.3 after small dip near 1150-1170 that will be our 3.3.2 subwave.
Entry and Exit Points:
Long-Term Perspective: The demand zone was a good area to buy the stock; however, we expect a retest of this zone, which can be a good opportunity for those who missed buying Axis Bank earlier.
> SIP Mode is best for long term.
Expected Target:
Once Axis Bank gives a breakout above the recent high, it is expected to hit the first target of Rs. 1529 .
The next target could be Rs.1859 and even 2000+ possible in couple of years. These targets are derived based on the application of the Fibonacci extension and channels.
Disclaimer: We are not SEBI registered. The content presented here is based on personal opinions. Conduct your own research and consult with a qualified financial advisor before making any investment decisions.

AXIS BANK: Breakout CandidateAfter a long consolidation and a complex corrective structure concluded at Apr'24 low of INR 995.7, stock prices have given very sharp up move. This suggests that stock is likely to give a breakout very soon and extend the gains towards INR 1250 in the coming days and week.

Axis bank looking bearish on higher time frame.
Axis bank has been trading around the higher level and is forming a base near 1030 zone. Both side movement can be there in the stock and confirmation is need for the entry to trigger.
But the stock on the weekly chart is showing some bearish RSI divergence and the dropping strength can be the initial signal of a bearish move.
On the daily charts, it is around the 200 ema. Either it will breach the levels or take support from the same. Watch for the levels and price action.
If the stock starts trading below the 1028 level and even close below it, next month expiry derivatives can be traded for the bearish momentum in the stock.
Major bearish target levels :- 980, 950.
Entry :- Close below 1028 levels.
Positional/ swing trade can be initiated in the stock for the next month expiry and trailing SL must be kept to limit the lose and capture the move.
Wait for the price action near the level before entering the trade.

Axisbank Support Level ExplainedAxisbank had given a breakout around 1100 level and made a high of close to 1130 and higher.. its resistance can now be well backed by a good support at 1100, On monday we can expect axisbank to open lower and fall even lower only to take support around 1100 and from there on we can expect further upside for axisbank.
Entry level 1100
Stop Loss 1080
Target 1145
Happy Trading,
Yamini Prabu
NSE,NISM Certified TA,
Independent Trader and Trainer

SELL AXIS BANK @ 1125 - 1130 FOR 100+ POINTS TARGETAxis Bank is forming lower highs and lower lows pattern and looking a good sell candidate around 1125 - 1130 for the targets of 1045 and below marked levels on the chart.
To motivate us, Please like the idea If you agree with the analysis.
Happy Trading!

SELL AXIS BANK FOR 100+ POINTS TARGET | RR 1:2AxisBank has formed the bearish pattern at ATH and if breaks 1108 on the downside, we expect to see 1045 and 1000 in upcoming trading sessions.
To motivate us, Please like the idea If you agree with the analysis.
Happy Trading!


Axis Bank : Cup&HandleTrading Strategy : Stock has given a breakout of the formation of cup and handle . One should buy the stock near the current level i.e. 980 and keeping a stop loss of 927 , look for the target of 1100-1120 in the coming weeks.
Buy: CMP i.e. 980
Stop loss : 927
Tgt: 1100
Theory:
The Cup with Handle is a bullish continuation pattern that marks a consolidation period followed by a breakout. It was developed by William O'Neil and introduced in his 1988 book, How to Make Money in Stocks.
As its name implies, there are two parts to the pattern: the cup and the handle. The cup forms after an advance and looks like a bowl or rounding bottom. As the cup is completed, a trading range develops on the right-hand side and the handle is formed. A subsequent breakout from the handle's trading range signals a continuation of the prior advance.
Trend: To qualify as a continuation pattern, a prior trend should exist. Ideally, the trend should be a few months old and not too mature. The more mature the trend, the less chance that the pattern marks a continuation or the less upside potential.
Cup: The cup should be “U” shaped and resemble a bowl or rounding bottom. A “V” shaped bottom would be considered too sharp of a reversal to qualify. The softer “U” shape ensures that the cup is a consolidation pattern with valid support at the bottom of the “U”. The perfect pattern would have equal highs on both sides of the cup, but this is not always the case.
Cup Depth: Ideally, the depth of the cup should retrace 1/3 or less of the previous advance. However, with volatile markets and over-reactions, the retracement could range from 1/3 to 1/2. In extreme situations, the maximum retracement could be 2/3, which conforms with Dow Theory.
Handle: After the high forms on the right side of the cup, there is a pullback that forms the handle. Sometimes this handle resembles a flag or pennant that slopes downward, other times it is just a short pullback. The handle represents the final consolidation/pullback before the big breakout and can retrace up to 1/3 of the cup's advance, but usually not more. The smaller the retracement, the more bullish the formation and significant the breakout. Sometimes it is prudent to wait for a break above the resistance line established by the highs of the cup.
Volume: There should be a substantial increase in volume on the breakout above the handle's resistance.
Target: The projected advance after breakout can be estimated by measuring the distance from the right peak of the cup to the bottom of the cup.
