SENSEX 1D Time frame📉 Current Market Snapshot
Closing Price: ₹81,904.70
Day's Range: ₹81,641.38 – ₹81,992.85
52-Week High: ₹85,978.25
52-Week Low: ₹71,425.01
Previous Close: ₹81,548.73
Market Cap: ₹1,63,02,221 crore
P/E Ratio: 22.7
Dividend Yield: 1.18%
Price-to-Book Ratio: 4.35
1-Year Return: +0.47%
5-Year Return: +16.1%
10-Year Return: +12.2%
All-Time High: ₹85,978.25 (Sep 2024)
VWAP: ₹81,758.95
Volume: 12,856,963 shares
ATR (14): ₹5.72
Bajajauto

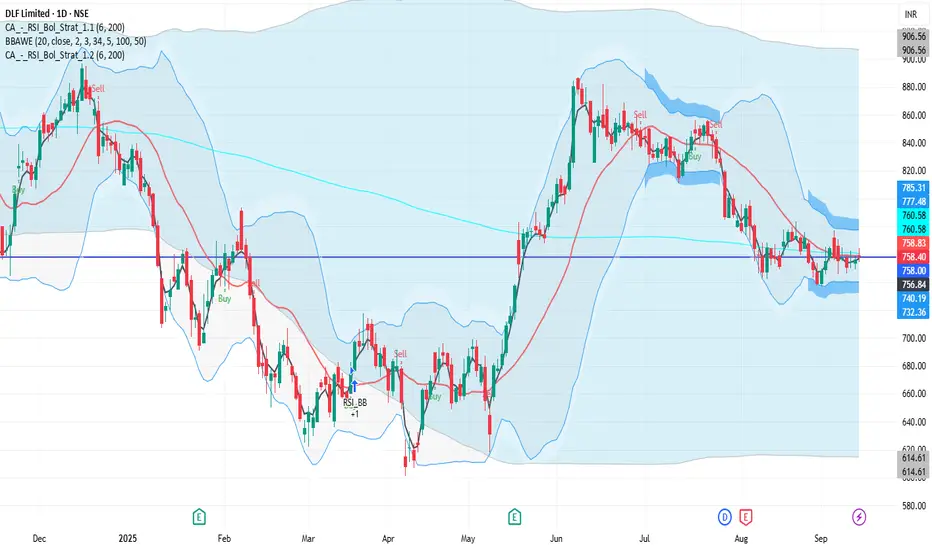
DLF 1D Time frame📉 Current Market Snapshot
Current Price: ₹758.40
Previous Close: ₹756.35
Day's Range: ₹754.20 – ₹764.40
52-Week High: ₹929.00
52-Week Low: ₹601.20
Market Cap: ₹1.87 lakh crore
P/E Ratio: 41.85
Dividend Yield: 0.79%
ROE: 10.76%
Debt-to-Equity Ratio: 0.10
Beta: 1.78
EPS (TTM): ₹18.12
Book Value: ₹172.51
Face Value: ₹2.00
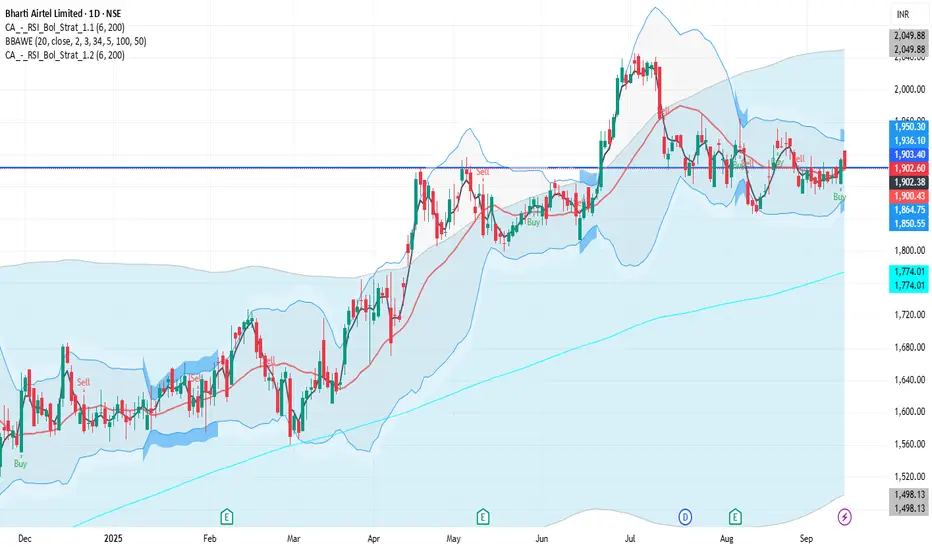
BHARTIARTL 1D Time frame📉 Current Market Snapshot
Previous Close: ₹1,902.00
Day's Range: ₹1,901.60 – ₹1,925.00
52-Week High: ₹2,045.80
52-Week Low: ₹1,511.00
Market Cap: ₹11.03 lakh crore
P/E Ratio: 30.72
Dividend Yield: ~0.81%
ROE: 23.80%
Debt-to-Equity Ratio: 1.88
Beta: 0.94
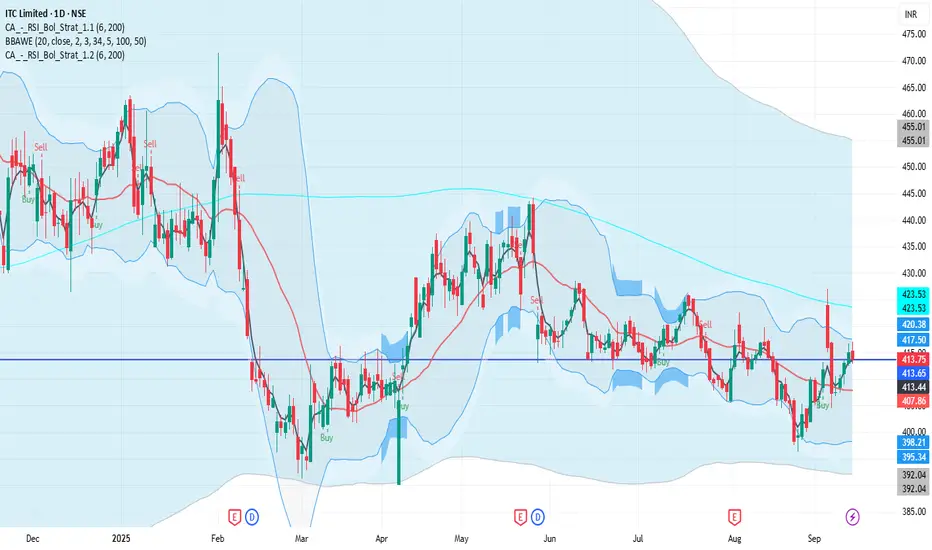
ITC 1D Time frame📉 Current Market Snapshot
Previous Close: ₹413.05
Day's Range: ₹412.85 – ₹417.05
52-Week High: ₹528.50
52-Week Low: ₹390.15
Market Cap: ₹5.18 lakh crore
Dividend Yield: ~3.47%
P/E Ratio: 25.9
ROE: 27.3%
ROCE: 36.8%
Debt-to-Equity Ratio: 0.00
ASIANPAINT 1D Time frame📍 Current Price
₹2,546.30 (closing price)
Short-Term Outlook
Bullish Scenario: A sustained move above ₹2,587.40 could lead to a test of the 52-week high around ₹3,394.90.
Bearish Scenario: A drop below ₹2,505.00 may signal a potential pullback toward ₹2,400.

AXISBANK 1D Time frame📍 Current Price
₹1,105.30 (up 1.64% from previous close)
Short-Term Outlook
Bullish Scenario: A sustained move above ₹1,115 could lead to a test of the 52-week high around ₹1,281.65.
Bearish Scenario: A drop below ₹1,080 may signal a potential pullback toward the ₹1,050 level.

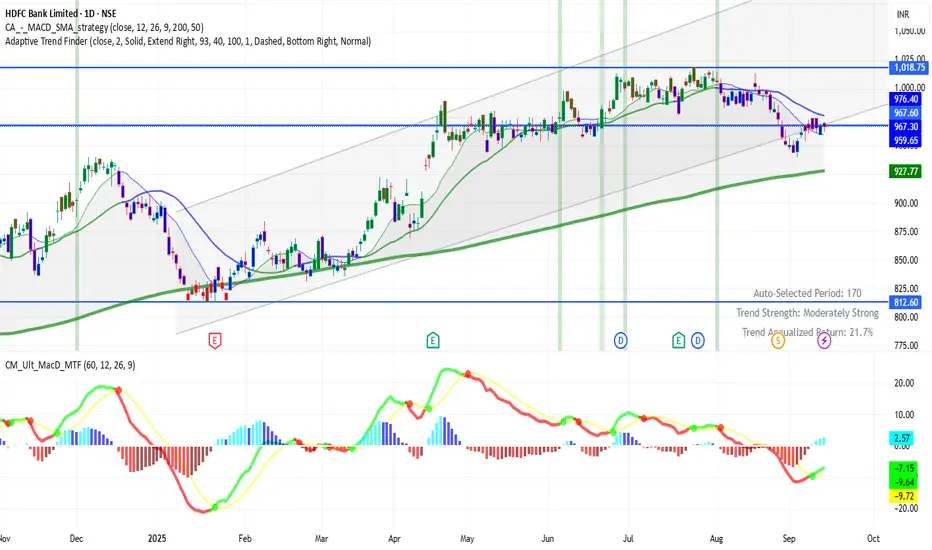
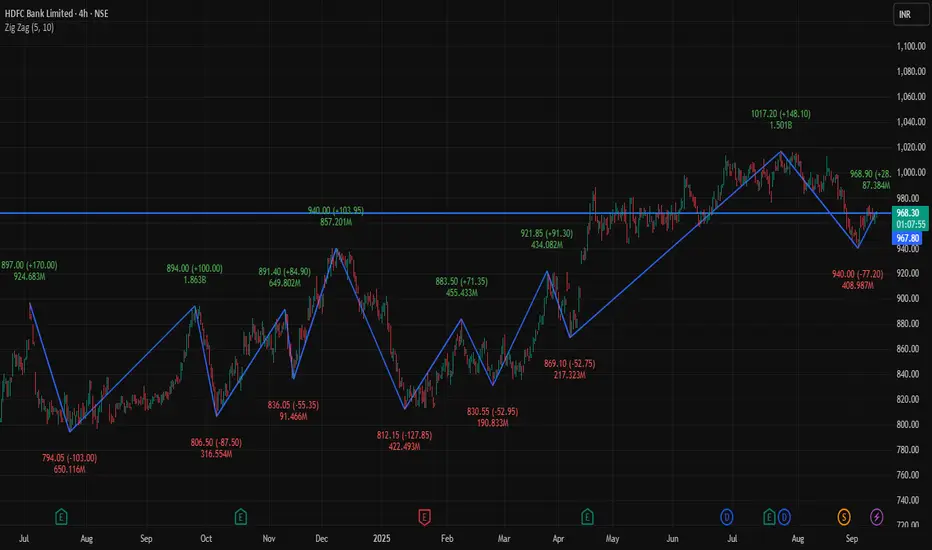
HDFCBANK 1D Time frame📊 Current Status
Price around ₹967
Trading near resistance zone
🔑 Key Levels
Support: ₹960 → ₹950
Resistance: ₹970 → ₹975
✅ Outlook
If price sustains above ₹975, further upside possible. Falling below ₹950 may bring weakness or sideways movement.
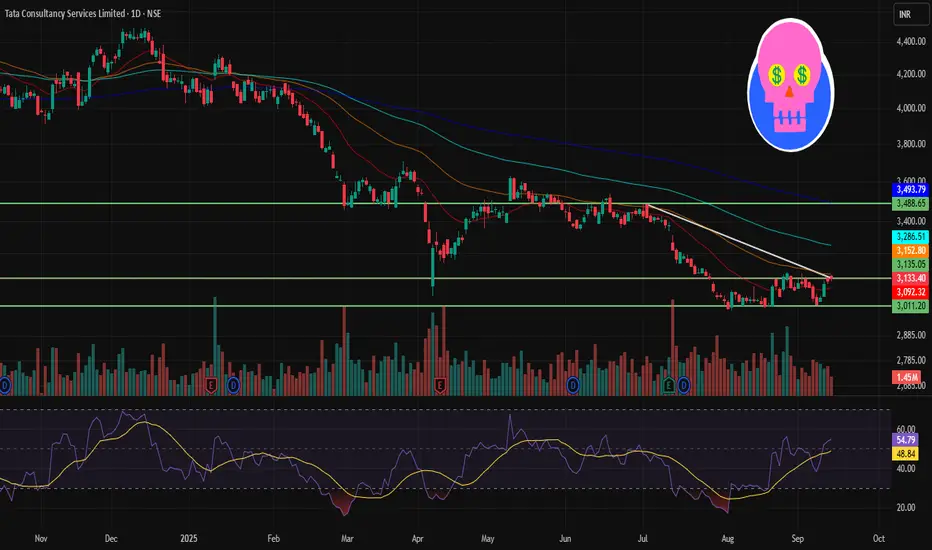
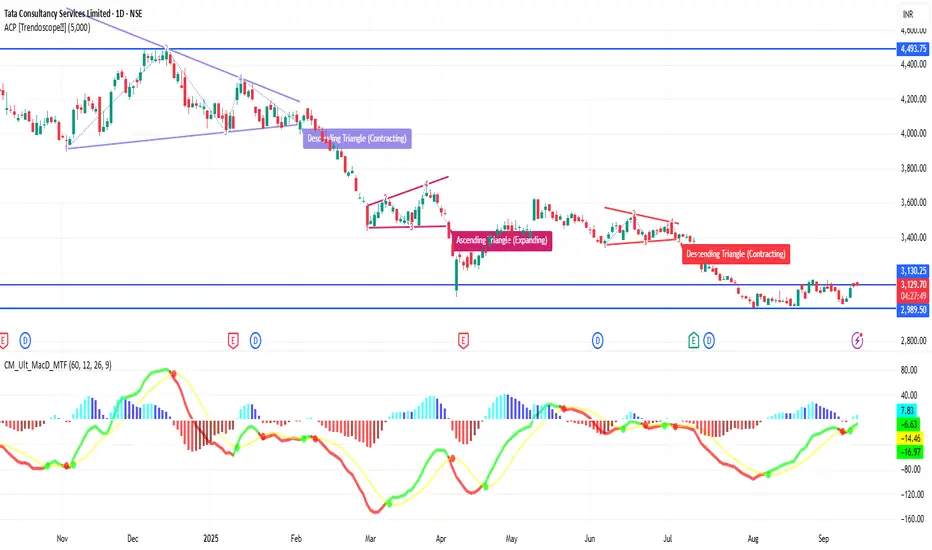
TCS 1D Time frame🔢 Current Level
~ ₹3,131
🔑 Key Resistance & Support Levels
Resistance Zones:
~ ₹3,160 – ₹3,180 (near-term resistance)
~ ₹3,200 – ₹3,220 (stronger resistance above)
Support Zones:
~ ₹3,120 – ₹3,100 (immediate support)
~ ₹3,050 – ₹3,000 (secondary support)
~ ₹2,900 (deeper support if weakness intensifies)
📉 Outlook
Bullish Scenario: If TCS holds above ~ ₹3,120 and manages to break past ~ ₹3,180 – ₹3,200, there is potential to move toward ~ ₹3,220+
Bearish Scenario: A drop below ~ ₹3,100 could lead to a slide toward ~ ₹3,050 or lower
Neutral / Range: Between ~ ₹3,100 – ₹3,180, TCS may consolidate until a clearer breakout or breakdown
SENSEX 1D Time frame🔢 Current Level
Trading near ₹81,905
🔑 Key Resistance & Support Levels
Resistance Zones:
~ ₹82,150 – ₹82,400 (immediate resistance)
~ ₹82,800 – ₹83,000 (higher resistance above)
Support Zones:
~ ₹81,600 – ₹81,500 (first support)
~ ₹81,200 – ₹81,300 (secondary support)
~ ₹80,800 – ₹80,900 (deeper support if selling continues)
📉 Outlook
Bullish Scenario: Sustaining above ₹81,600 and breaking ₹82,150+ may fuel an up-move toward ₹82,800+.
Bearish Scenario: A break below ₹81,300 may invite weakness toward ₹80,900 or lower.
Neutral / Range: Likely to consolidate between ₹81,500 – ₹82,400 until a decisive move.

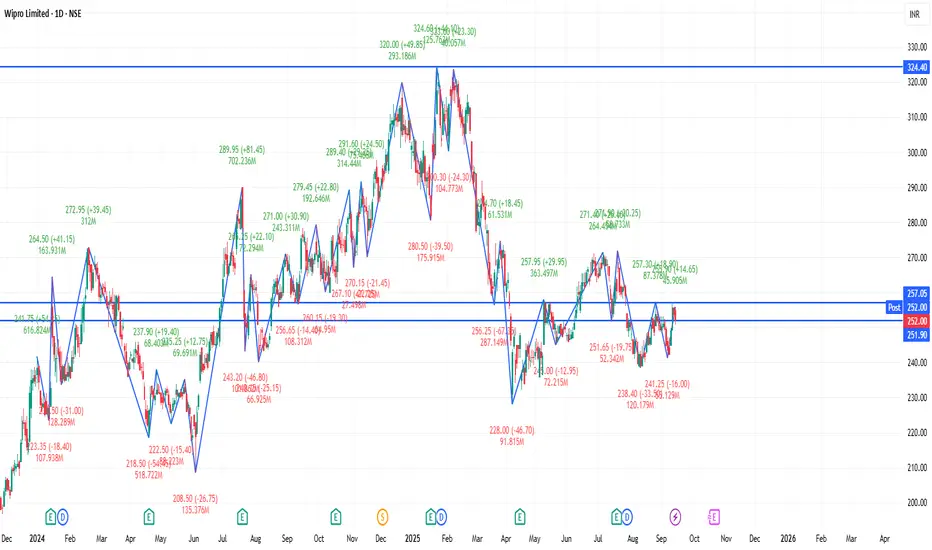
WIPRO 1D Time frame🔢 Current Level
Trading around ₹252.91
🔑 Key Resistance & Support Levels
Resistance Zones:
₹254.00 – ₹255.00 (recent highs; breakout above this may lead to further upside)
₹260.00 – ₹262.00 (stronger resistance above)
Support Zones:
₹250.00 – ₹251.00 (immediate support; failure to hold above this may lead to a decline)
₹245.00 – ₹246.00 (short-term support; a break below this could indicate weakness)
₹240.00 – ₹242.00 (deeper support zone if price dips further)
📉 Outlook
Bullish Scenario: If Wipro holds above ₹251.00, upward momentum may continue. Break above ₹255.00 can open the way toward ₹260.00+.
Bearish Scenario: If it falls below ₹245.00, risk increases toward ₹240.00 – ₹242.00.
Neutral / Range: Between ₹251.00 – ₹255.00, Wipro may consolidate before a directional move.
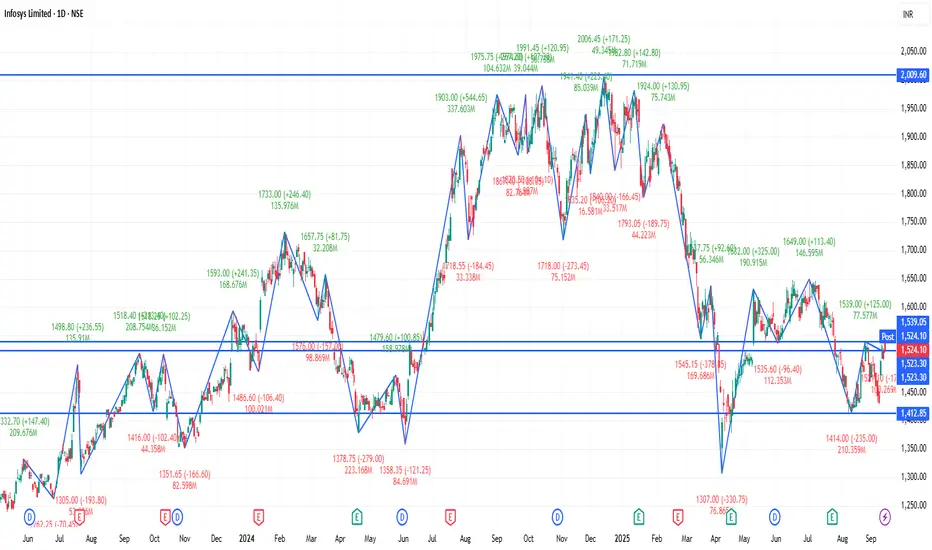
INFY 1D Time frame🔢 Current Level
Trading around ₹1,523.50 - ₹1,528.50
🔑 Key Resistance & Support Levels
Resistance Zones:
₹1,540 – ₹1,550 (recent highs; breakout above this may lead to further upside)
₹1,570 – ₹1,580 (stronger resistance above)
Support Zones:
₹1,510 – ₹1,520 (immediate support; failure to hold above this may lead to a decline)
₹1,490 – ₹1,500 (short-term support; a break below this could indicate weakness)
₹1,460 – ₹1,470 (deeper support zone if price dips further)
📉 Outlook
Bullish Scenario: If Infosys holds above ₹1,520, upward momentum may continue. Break above ₹1,550 can open the way toward ₹1,570+.
Bearish Scenario: If it falls below ₹1,490, risk increases toward ₹1,460 – ₹1,470.
Neutral / Range: Between ₹1,520 – ₹1,550, Infosys may consolidate before a directional move.
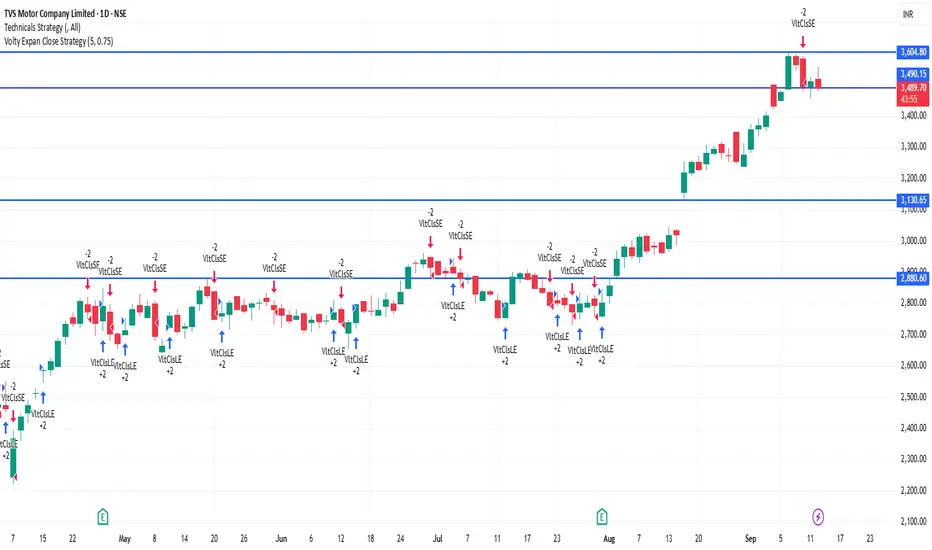
TVSMOTOR 1D Time frame🔢 Current Level
Trading around ₹3,490 – ₹3,526
🔑 Key Resistance & Support Levels
Resistance Zones:
₹3,550 – ₹3,556 (near-term resistance; breakout above this may lead to further upside)
₹3,600 (psychological resistance)
₹3,650 (stronger resistance above)
Support Zones:
₹3,510 – ₹3,520 (immediate support; failure to hold above this may lead to a decline)
₹3,480 – ₹3,490 (short-term support; a break below this could indicate weakness)
₹3,400 – ₹3,450 (deeper support zone if price dips further)
📉 Outlook
Bullish Scenario: If TVS Motor holds above ₹3,520, upward momentum may continue. Break above ₹3,556 can open the way toward ₹3,600+.
Bearish Scenario: If it falls below ₹3,480, risk increases toward ₹3,400 – ₹3,450.
Neutral / Range: Between ₹3,520 – ₹3,556, TVS Motor may consolidate before a directional move.
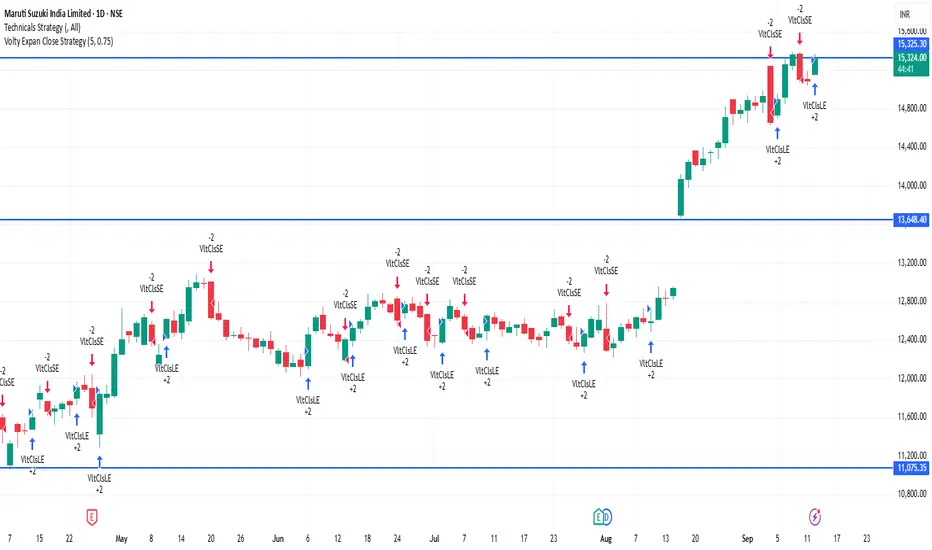
MARUTI 1D Time frame🔢 Current Level
Trading around ₹15,318 – ₹15,325
🔑 Key Resistance & Support Levels
Resistance Zones:
₹15,373 – ₹15,384 (recent highs; breakout above this may lead to further upside)
₹15,400 (psychological resistance)
₹15,500 (stronger resistance above)
Support Zones:
₹15,150 – ₹15,160 (immediate support; failure to hold above this may lead to a decline)
₹15,050 – ₹15,100 (short-term support; a break below this could indicate weakness)
₹14,800 – ₹14,900 (deeper support zone if price dips further)
📉 Outlook
Bullish Scenario: If Maruti Suzuki holds above ₹15,160, upward momentum may continue. Break above ₹15,384 can open the way toward ₹15,500+.
Bearish Scenario: If it falls below ₹15,050, risk increases toward ₹14,800 – ₹14,900.
Neutral / Range: Between ₹15,160 – ₹15,384, Maruti Suzuki may consolidate before a directional move.
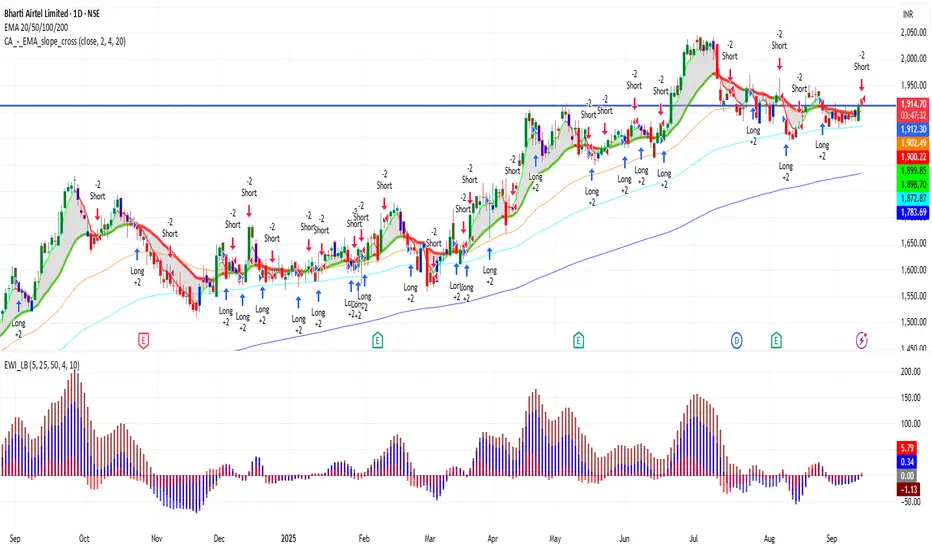
BHARTIARTL 1D Time frame🔢 Current Level
Trading around ₹1,912.00 - ₹1,914.30
🔑 Key Resistance & Support Levels
Resistance Zones:
₹1,925 – ₹1,930 (recent highs; breakout above this may lead to further upside)
₹1,950 (psychological resistance)
₹2,000 (stronger resistance above)
Support Zones:
₹1,900 – ₹1,905 (immediate support; failure to hold above this may lead to a decline)
₹1,880 (short-term support; a break below this could indicate weakness)
₹1,850 – ₹1,860 (deeper support zone if price dips further)
📉 Outlook
Bullish Scenario: If Bharti Airtel holds above ₹1,905, upward momentum may continue. Break above ₹1,930 can open the way toward ₹1,950+.
Bearish Scenario: If it falls below ₹1,880, risk increases toward ₹1,850 – ₹1,860.
Neutral / Range: Between ₹1,905 – ₹1,930, Bharti Airtel may consolidate before a directional move.
SBIN 1D Time frame🔢 Current Level
Trading around ₹823.65 - ₹825.00
🔑 Key Resistance & Support Levels
Resistance Zones:
₹824 – ₹826 (recent highs; breakout above this may lead to further upside)
₹830 (psychological resistance)
₹840 – ₹850 (stronger resistance above)
Support Zones:
₹820 – ₹822 (immediate support; failure to hold above this may lead to a decline)
₹810 (short-term support; a break below this could indicate weakness)
₹800 – ₹805 (deeper support zone if price dips further)
📉 Outlook
Bullish Scenario: If SBIN holds above ₹822, upward momentum may continue. Break above ₹826 can open the way toward ₹830+.
Bearish Scenario: If it falls below ₹810, risk increases toward ₹800 – ₹805.
Neutral / Range: Between ₹822 – ₹826, SBIN may consolidate before a directional move.

TVSMOTOR 1D Time frame🔢 Current Level
Trading around ₹3,525 – ₹3,530
🔑 Key Resistance & Support Levels
Resistance Zones:
₹3,550 – ₹3,560: Near-term resistance; breakout above this may lead to further upside.
₹3,600: Stronger resistance above.
Support Zones:
₹3,500 – ₹3,510: Immediate support; failure to hold above this may lead to a decline.
₹3,450: Short-term support; a break below this could indicate weakness.
₹3,400: Deeper support zone if price dips further.
📉 Outlook
Bullish Scenario: If TVS Motor holds above ₹3,510, upward momentum may continue. Break above ₹3,560 can open the way toward ₹3,600+.
Bearish Scenario: A drop below ₹3,450 may signal further downside potential.
Neutral Zone: Between ₹3,510 and ₹3,560, TVS Motor may consolidate before a directional move.

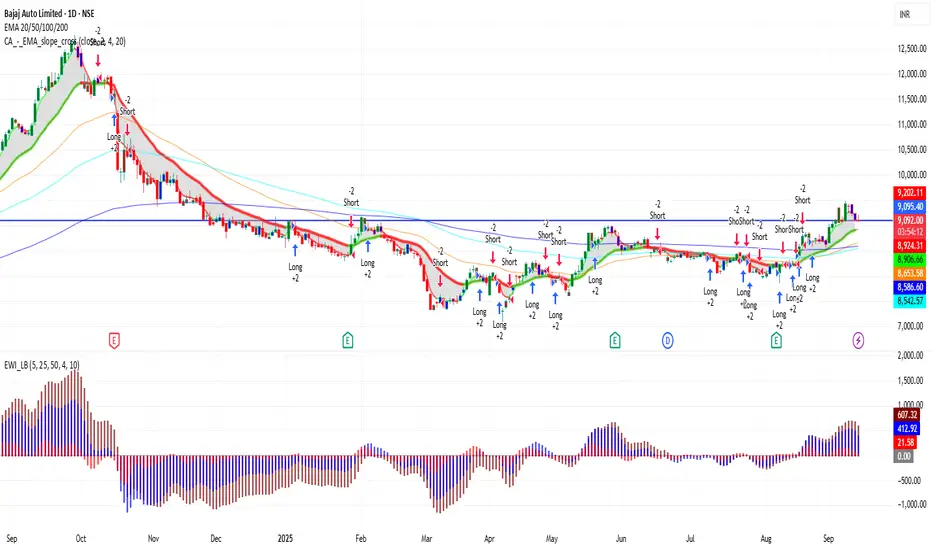
BAJAJ_AUTO 1D Time frame🔢 Current Level
Trading around ₹9,092 – ₹9,110
🔑 Key Resistance & Support Levels
Resistance Zones:
₹9,150 – ₹9,200 (near-term resistance; breakout above this may lead to further upside)
₹9,300 (stronger resistance above)
Support Zones:
₹9,070 – ₹9,090 (immediate support)
₹8,900 (stronger support if price dips further)
₹8,800 (deeper support zone)
📉 Outlook
Bullish Scenario: If Bajaj Auto holds above ₹9,090, upward momentum may continue. Break above ₹9,200 can open the way toward ₹9,300+.
Bearish Scenario: If it falls below ₹8,900, risk increases toward ₹8,800.
Neutral / Range: Between ₹9,090 – ₹9,200, Bajaj Auto may consolidate before a directional move.
TCS 1D Time frame🔢 Current Level
Trading around ₹3,125 – ₹3,135
🔑 Key Resistance & Support Levels
Resistance Zones:
₹3,138 – ₹3,153 (near-term resistance; breakout above this may lead to further upside)
₹3,167 (stronger resistance above)
Support Zones:
₹3,095 – ₹3,110 (immediate support)
₹3,080 (stronger support if price dips further)
₹3,050 – ₹3,060 (deeper support zone)
📉 Outlook
Bullish Scenario: If TCS holds above ₹3,110, upward momentum may continue. Break above ₹3,153 can open the way toward ₹3,167+.
Bearish Scenario: If it falls below ₹3,080, risk increases toward ₹3,050.
Neutral / Range: Between ₹3,110 – ₹3,153, TCS may consolidate before a directional move.
INFY 1D Time frame📍 Current Price Action
Current Price: ~₹1,509
Day Change: about –1.5%
Daily Range: ₹1,500 – ₹1,515
⚙ Technical Indicators
RSI (14): ~57–60 → neutral to mildly bullish momentum
MACD: Positive → signals upward bias
Stochastic Oscillator: Near oversold zone → indicates possible bounce
ADX (14): ~26 → moderate trend strength
Money Flow Index (MFI): Mid-range → no extreme buying/selling pressure
📊 Moving Averages
Short-term (5, 10-day): Price trading slightly below → short-term weakness
Medium to Long-term (50, 100, 200-day): Price still above → long-term structure supportive
📉 Support & Resistance
Immediate Support: ~₹1,500
Next Support: ~₹1,480 – ₹1,470
Immediate Resistance: ~₹1,512 – ₹1,515
Breakout Target (if above resistance): ~₹1,530 – ₹1,540
🧠 Summary
INFY is neutral to mildly bullish on the daily chart. Support at ₹1,500 is crucial — holding above it keeps momentum intact. If the stock breaks above ₹1,515, it can push toward ₹1,530–1,540. On the downside, breaking below ₹1,500 may invite weakness toward ₹1,480–1,470.

BANKNIFTY 1D Time frame📍 Current Price Action
Level: ~54,670
Day’s Range: 54,402 – 54,757
52-Week Range: 47,703 – 57,628
⚙ Technical Indicators
RSI (14): ~60 → bullish momentum, not overbought yet
MACD: Positive → supports uptrend
Moving Averages:
Short-term (5, 10, 20-day): Bullish signals
Medium-term (50, 100-day): Supportive of trend
Long-term (200-day): Slight resistance near current level
Stochastic Oscillator: In overbought zone → strong momentum but risk of pullback
📊 Support & Resistance
Immediate Support: ~54,400
Immediate Resistance: ~54,750 – 55,000
Pivot Point: ~54,550
🧠 Summary
Bank Nifty is in a bullish short-term trend. Holding above 54,400 keeps momentum positive, while a breakout above 55,000 could open room for more upside. If resistance holds, the index may consolidate or retest lower supports.

NIFTY_MID_SELECT 1D Time frameCurrent Level: 13,022.90
Daily Range: 12,967.10 – 13,087.35
52-Week Range: 10,382.55 – 13,537.80
Technical Indicators:
RSI (14): 56.75 – positive momentum
MACD: 9.37 – upward trend
Stochastic Oscillator: 75.03 – strong bullish momentum
Rate of Change (ROC): 2.59 – confirming positive movement
Trend & Levels:
Trading above Supertrend: 13,065.50 – bullish trend
Support: ~13,000 (next support ~12,900)
Resistance: ~13,100 (next target 13,200–13,300)
Summary:
The Nifty Midcap Select Index is showing a bullish trend with strong momentum and potential for further gains if current momentum continues.

HDFCBANK 4Hour Time frame 📊 Current Snapshot
Current Price: ₹967.95
Day’s Range: ₹959.90 – ₹968.90
Previous Close: ₹965.90
Opening Price (4H): ₹960.30
Volume: Approximately 7.2 million shares
📈 Trend & Indicators
Trend: Neutral to mildly bullish; trading near short-term resistance.
RSI (14): Neutral zone.
MACD: Positive → indicating mild bullish momentum.
Moving Averages: Short-term averages indicate neutral to slightly bullish outlook.
🔮 Outlook
Bullish Scenario: Break above ₹968.90 with strong volume could target ₹975.00.
Bearish Scenario: Drop below ₹960.00 may lead to further decline toward ₹950.00.
Neutral Scenario: Consolidation between ₹960.00 – ₹968.90; breakout needed for directional move.
📌 Key Factors to Watch
Economic Indicators: Interest rates, inflation, and RBI policy updates.
Sector Performance: Trends in the banking sector.
Global Cues: Global market trends, US indices, crude oil, and currency movements.
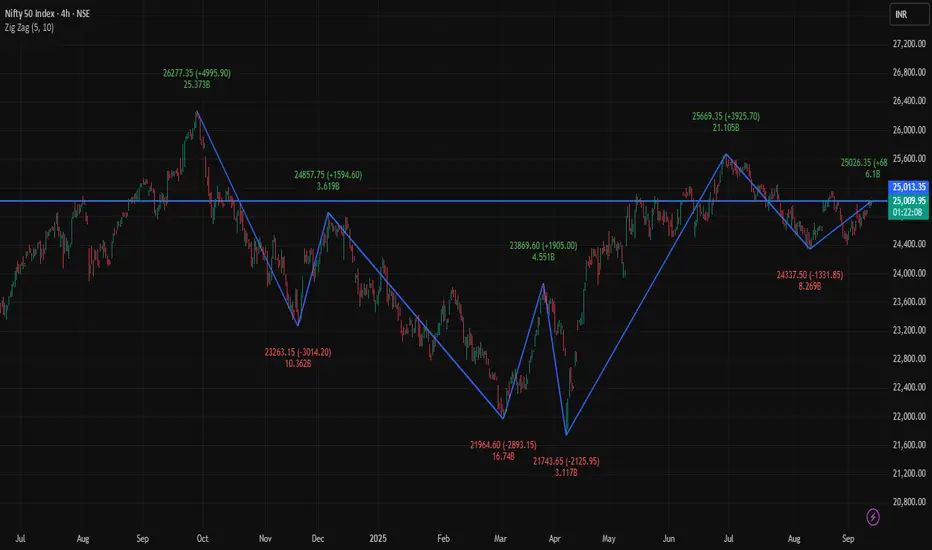
NIFTY 4H Time frame📊 Current Snapshot
Current Price: ₹25,010.95
Day’s Range: ₹24,940.15 – ₹25,008.95
Previous Close: ₹24,977.95
Opening Price (4H): ₹24,940.15
Volume: Approximately 6.16 million shares
📈 Trend & Indicators
Trend: Neutral to mildly bullish; trading near 50-hour and 200-hour moving averages.
RSI (14): Neutral zone.
MACD: Positive → indicating mild bullish momentum.
Moving Averages: Short-term averages indicate neutral to slightly bullish outlook.
🔮 Outlook
Bullish Scenario: Break above ₹25,008.95 with strong volume could target ₹25,186.00.
Bearish Scenario: Drop below ₹24,940.00 may lead to further decline toward ₹24,871.10.
Neutral Scenario: Consolidation between ₹24,940.00 – ₹25,008.95; breakout needed for directional move.
📌 Key Factors to Watch
Economic Indicators: Interest rates, inflation, and RBI policy updates.
Sector Performance: Trends in the IT and financial sectors.
Global Cues: Global market trends, US indices, crude oil, and currency movements.