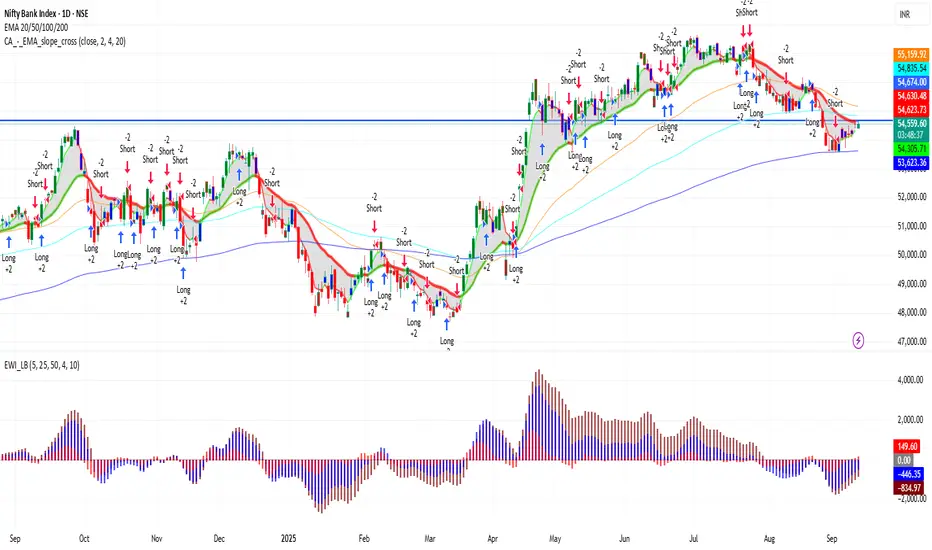
BANKNIFTY 1D Time frame📊 Current Snapshot
Current Price: ₹54,536.00
Day’s Range: ₹54,400 – ₹54,705
52-Week Range: ₹47,702.90 – ₹57,628.40
Previous Close: ₹54,216.10
Opening Price: ₹54,554.75
Market Cap: Approx. ₹3.78 lakh crore
Volume: ~77,647 contracts
📈 Trend & Indicators
Trend: Neutral to mildly bullish; trading near 50-day and 200-day moving averages.
RSI (14): 60 – Neutral; no immediate overbought or oversold conditions.
MACD: Positive → indicates bullish momentum.
Moving Averages: Short-term moving averages suggest neutral to slightly bullish outlook.
🔮 Outlook
Bullish Scenario: Break above ₹54,705 with strong volume could target ₹55,000.
Bearish Scenario: Drop below ₹54,400 may lead to further decline toward ₹54,000.
Neutral Scenario: Consolidation between ₹54,400 – ₹54,705; breakout needed for directional move.
📌 Key Factors to Watch
Banking Sector Performance: As BANKNIFTY comprises major banking stocks, sector-specific developments can influence index movement.
Economic Indicators: Changes in interest rates or inflation can impact index performance.
Global Cues: Developments in global markets can affect investor sentiment.
Bajajauto
TVSMOTOR 1D Time frameCurrent Snapshot
Last Traded Price: ₹3,495.30
Day’s Range: ₹3,455.50 – ₹3,502.40
52-Week Range: ₹2,171.40 – ₹3,602.70
Market Cap: ₹1.64 lakh crore
Volume: 159,624 shares
VWAP: ₹3,474.60
📈 Trend & Indicators
Trend: Neutral to mildly bullish; trading above 20-day and 50-day EMAs.
RSI (14): Around 68 – approaching overbought territory.
MACD: Positive → indicates bullish momentum.
Moving Averages: Short-term MAs suggest neutral to slightly bullish outlook.
🔮 Outlook
Bullish Scenario: Break above ₹3,502 with strong volume could target ₹3,550.
Bearish Scenario: Drop below ₹3,455 may lead to further decline toward ₹3,400.
Neutral Scenario: Consolidation between ₹3,455 – ₹3,502; breakout needed for directional move.
📌 Key Factors to Watch
Market Sentiment: Broader market moves can impact TVS Motor.
Economic Indicators: Interest rates, fuel prices, and inflation affect automotive stocks.
Company News: Any financial results or strategic announcements can influence price.

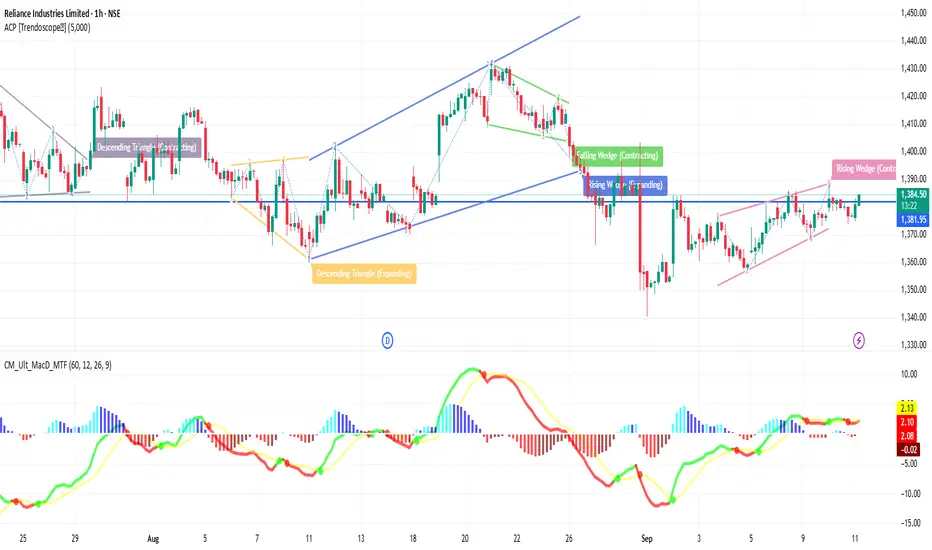
RELIANCE 1H Time framePrice Movement (1H Candles)
Reliance is trading around ₹1,381 – ₹1,383.
On the 1-hour chart, candles are showing sideways consolidation between ₹1,375 (support) and ₹1,385 (resistance).
This tells us that buyers and sellers are in balance, waiting for a breakout.
2️⃣ Support & Resistance Zones
Immediate Support: ~₹1,375 → If this breaks, price may slip toward ₹1,360.
Stronger Support: ~₹1,345 – ₹1,340 → A key zone where buyers may return strongly.
Immediate Resistance: ~₹1,385 → A breakout above can open the way to ₹1,395 – ₹1,400.
Major Resistance: ~₹1,415 – ₹1,420 → If crossed, trend becomes strongly bullish.
3️⃣ Indicators (1H View)
20 EMA: Very close to current price, showing consolidation.
50 EMA: Just below current levels, acting as dynamic support.
200 EMA: Much lower, confirming long-term uptrend is intact.
RSI: Neutral (around 50) → market is not overbought, not oversold.
MACD: Flat → no clear momentum yet, waiting for direction.
4️⃣ Trend Explanation
Right now, the 1-hour trend is neutral to mildly bullish.
If Reliance holds above ₹1,375 – ₹1,360, bulls remain in control.
A move above ₹1,385 with volume can trigger a rally toward ₹1,400+.
But if Reliance breaks below ₹1,360, weakness may appear, and the next fall could be toward ₹1,340.
5️⃣ Conclusion (1H Time Frame)
Sideways Phase: Reliance is consolidating in a narrow band.
Bullish Signal: Above ₹1,385 with good buying volume.
Bearish Signal: Below ₹1,375, deeper support around ₹1,360.
Traders should wait for a breakout or breakdown before taking big positions.
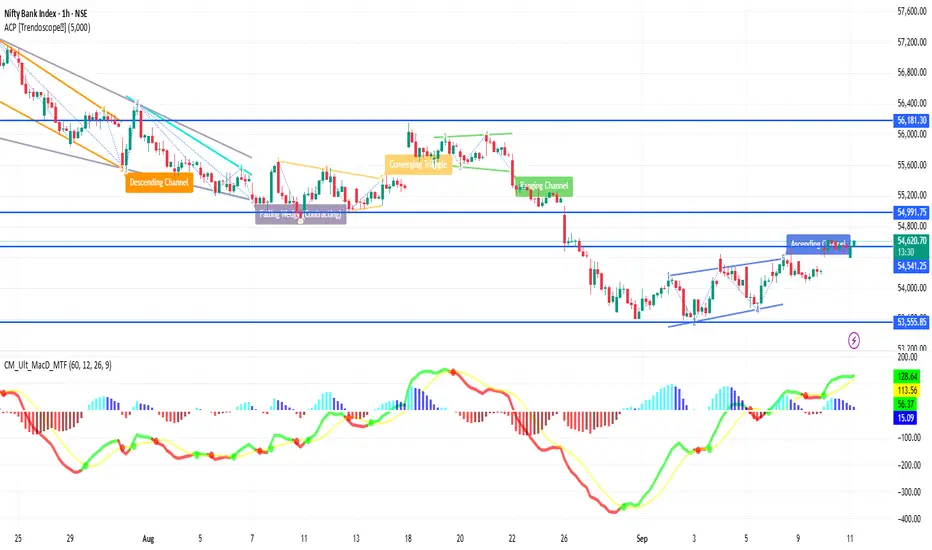
BANKNIFTY 1H Time frameBankNifty 1H Snapshot
Current Price: ~54,581
Recent Range: ~54,400 – 54,700
Bias: Slightly bullish, holding above short-term support
📈 Key Levels
Immediate Resistance: 54,650 – 54,700
Next Resistance: 54,800 → if broken, can open upside momentum
Immediate Support: 54,450
Deeper Support: 54,300 → then 54,000
🔎 Indicators (1-Hour)
RSI: Mid-60s → bullish but not yet extreme
MACD: Positive crossover → supports buying momentum
Stochastic: Near overbought → watch for minor pullback
🧭 Outlook
Bullish Case: Sustained above 54,600 → next push toward 54,700-54,800
Bearish Case: Slip below 54,450 → opens weakness toward 54,300
Overall Bias: Moderately bullish while holding above 54,450
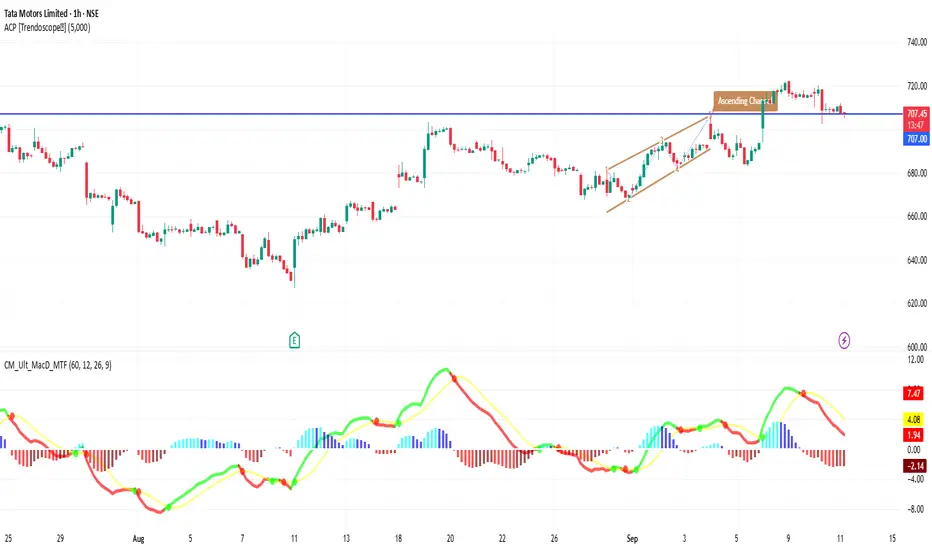
TATAMOTORS 1H Time frameMarket Snapshot
Current Price: ~₹708
Intraday Range: ~₹706 – ₹712
Bias: Sideways to mildly bullish
📈 Moving Averages (1H)
20-hour MA: ~₹707 → acting as short-term support
50-hour MA: ~₹704 → supportive level below
200-hour MA: ~₹699 → strong base, long-term intraday support
All moving averages are aligned above each other → bias is bullish.
🔎 Indicators
RSI (14, hourly): ~59 → Momentum positive, not overbought
MACD (1H): Bullish crossover, showing upward momentum
ADX: ~20 → Trend strength is still weak to moderate
Stochastic: Near overbought → caution for minor pullback
🔧 Key Levels
Support: ₹705 → first support, then ₹700 as stronger base
Resistance: ₹712 → immediate resistance, next at ₹715
🧭 Short-Term Outlook
Bullish Case: Break above ₹712–715 zone could push price toward ₹720+.
Bearish Case: Failure at resistance + RSI overbought may drag it back to ₹705 or even ₹700.
Overall Bias: Slightly bullish, but resistance is close and strong.
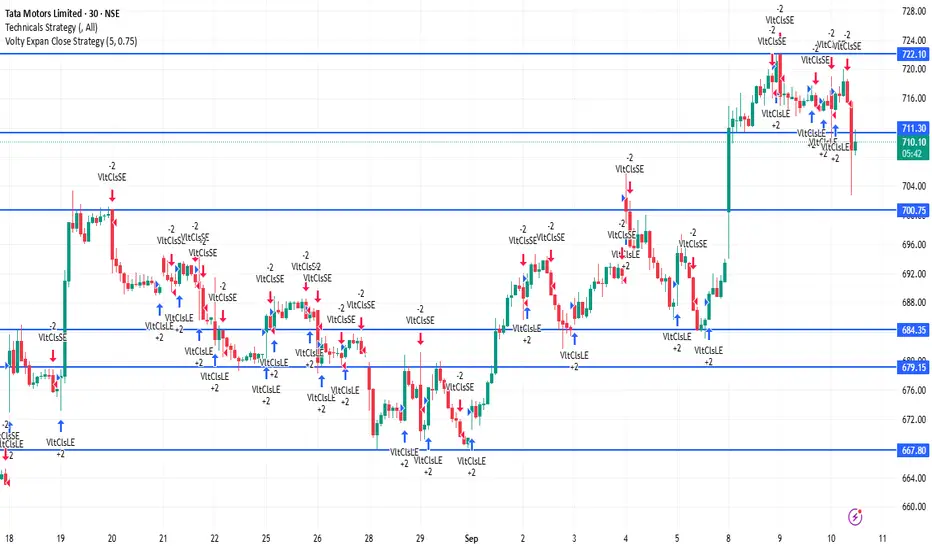
TATAMOTORS 30Minutes Time frame📊 Tata Motors – 30M Technical Levels
🔹 Support Zones
₹708 – ₹710 → Immediate intraday support
₹705 – ₹707 → Strong support zone
₹702 – ₹704 → Critical support; breakdown here can lead to further weakness
🔹 Resistance Zones
₹720 – ₹722 → First major resistance
₹724 – ₹726 → Strong supply zone
₹728 – ₹730 → Intraday breakout level; above this, momentum may pick up strongly
📈 30M Trend Outlook
Stock is sideways to mildly bullish on the 30-min chart.
Above ₹722 → Buyers gain control; possible upside to ₹726–₹730.
Below ₹708 → Weakness likely; price may slip to ₹705–₹702.
As long as it stays above ₹710, bias remains positive in the short term.
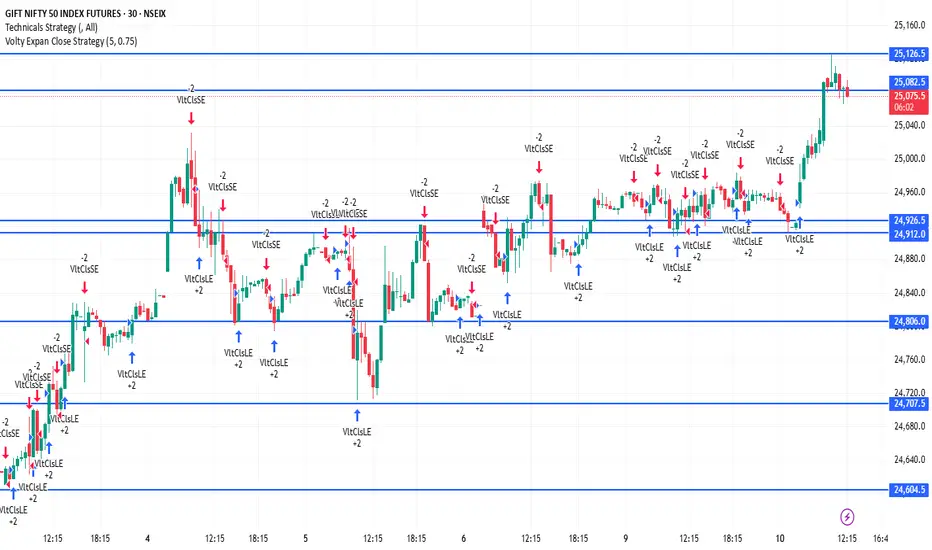
NIFTY1! 30Minutes Time frame📊 NIFTY1! – 30-Minute Timeframe (Current)
Current Price Zone: Approximately 25,092
🔻 Support Levels:
25,060 – Immediate support
25,020 – Stronger support zone
24,980 – Major support; breakdown here may lead to further weakness
🔺 Resistance Levels:
25,130 – Immediate resistance
25,180 – Strong resistance zone
25,220 – Major resistance; breakout above this level may signal bullish momentum
📈 Intraday Trend Outlook
Above 25,130: Bullish momentum likely; potential upside toward 25,180–25,220.
Between 25,060 – 25,130: Neutral to slightly bullish consolidation zone.
Below 25,060: Weakness may develop; potential slide toward 25,020–24,980.
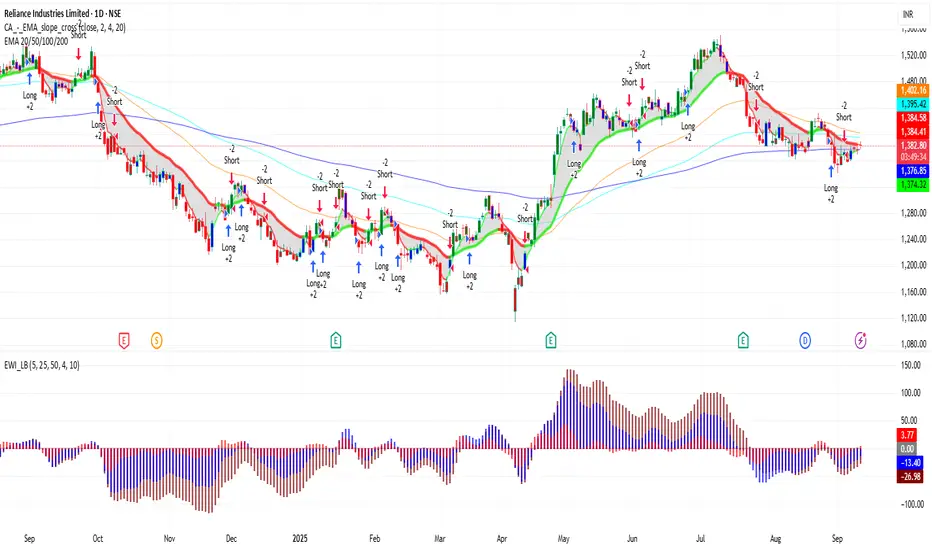
RELIANCE 1D Time frame📍 RELIANCE – 1D Important Levels (Current)
🔹 Support Zones
2,870 – 2,900 → Immediate daily support
2,820 – 2,840 → Strong support; buyers expected here
2,750 – 2,770 → Major support; breakdown may trigger deeper correction
🔹 Resistance Zones
2,950 – 2,970 → Immediate daily resistance
3,020 – 3,050 → Strong resistance zone; breakout may extend bullish momentum
3,120 – 3,150 → Major resistance; if crossed, Reliance may trend strongly higher
⚖️ Daily Trend Outlook
Reliance is in a sideways-to-bullish phase on the daily chart.
Price is consolidating between 2,870 support and 2,970 resistance.
A breakout above 2,970 – 3,020 can open upside towards 3,050 – 3,150.
A breakdown below 2,870 can drag it toward 2,820 – 2,770.
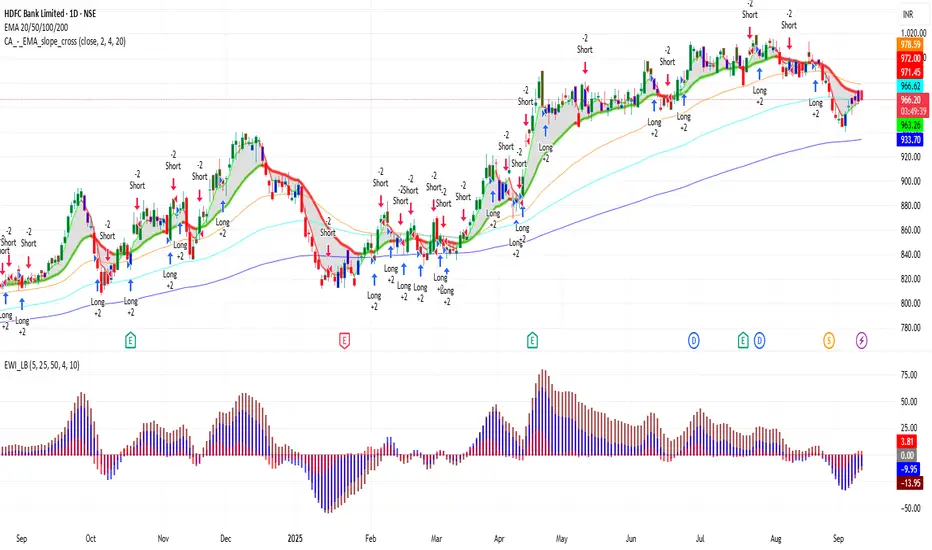
HDFCBANK 1D Time frame📍 HDFCBANK – 1D Important Levels (Current)
🔹 Support Zones
1,570 – 1,580 → Immediate daily support
1,530 – 1,550 → Strong support; buyers likely to defend this zone
1,480 – 1,500 → Major support; breakdown may shift trend bearish
🔹 Resistance Zones
1,620 – 1,630 → Immediate daily resistance
1,660 – 1,680 → Strong resistance zone
1,720 – 1,740 → Major resistance; breakout here may trigger a bigger rally
⚖️ Daily Trend Outlook
HDFC Bank is currently in a sideways-to-bullish phase on the daily chart.
As long as price holds above 1,570, momentum can stay positive.
A breakout above 1,630 – 1,680 may extend upside towards 1,720 – 1,740.
A breakdown below 1,570 could drag it back to 1,530 – 1,500.
KOTAKBANK 1D Time frame📍 KOTAKBANK – 1D Important Levels (Current)
🔹 Support Zones
1,730 – 1,750 → Immediate daily support
1,680 – 1,700 → Strong support; buyers likely to defend here
1,620 – 1,640 → Major support; breakdown here may turn trend bearish
🔹 Resistance Zones
1,780 – 1,800 → Immediate daily resistance
1,830 – 1,850 → Strong resistance zone
1,900 – 1,920 → Major resistance; breakout above this can fuel strong upside momentum
⚖️ Daily Trend Outlook
Kotak Bank is currently in a sideways to mildly bullish phase on the daily chart.
Price is consolidating between 1,730 support and 1,800 resistance.
A breakout above 1,800 – 1,850 could trigger a rally towards 1,900+.
A breakdown below 1,730 may drag the stock toward 1,700 – 1,640.

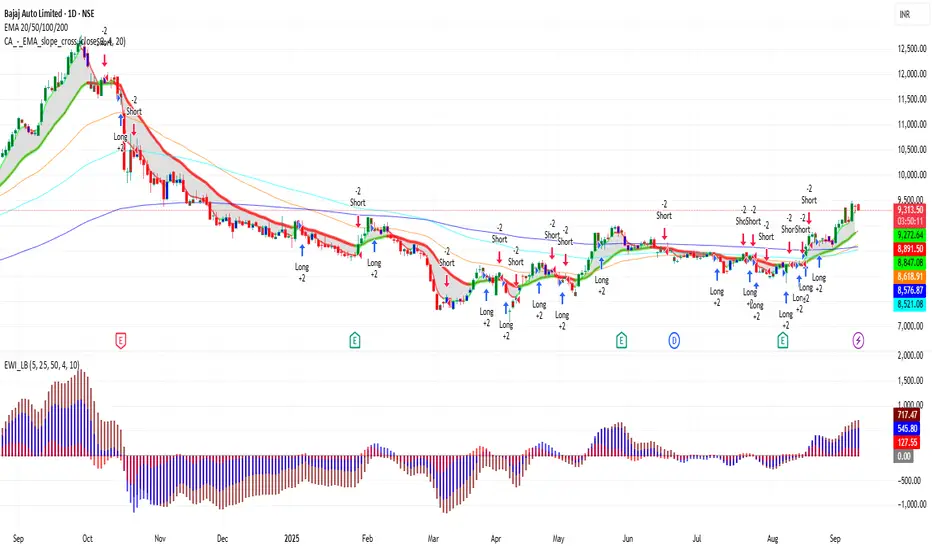
BAJAJ_AUTO 1D Time frame📍 BAJAJ_AUTO – 1D Important Levels (Current)
🔹 Support Zones
9,050 – 9,100 → Immediate daily support
8,800 – 8,900 → Strong support; buyers likely to defend this zone
8,500 – 8,600 → Major support; breakdown here may shift trend bearish
🔹 Resistance Zones
9,300 – 9,400 → Immediate daily resistance
9,550 – 9,650 → Strong resistance zone; breakout may extend upside momentum
9,800 – 10,000 → Major psychological resistance; if crossed, bullish trend strengthens further
⚖️ Daily Trend Outlook
Bajaj Auto is in a bullish structure on the daily chart, forming higher lows.
As long as price stays above 9,050, the stock remains positive.
A breakout above 9,400 – 9,650 can take it towards 9,800 – 10,000.
A breakdown below 9,050 could drag it towards 8,900 – 8,600.
SENSEX 1D Time frame 📍 Sensex – 1D Important Levels (Current)
🔹 Support Zones
73,800 – 74,000 → Immediate daily support
73,200 – 73,400 → Strong support; buyers likely to defend this zone
72,500 – 72,700 → Major support; breakdown here may invite deeper correction
🔹 Resistance Zones
74,800 – 75,000 → Immediate daily resistance
75,400 – 75,600 → Strong resistance; breakout can extend upside momentum
76,000 – 76,200 → Major psychological resistance
⚖️ Daily Trend Outlook
Sensex is in a bullish-to-range-bound phase on the daily chart.
As long as it trades above 73,800, the bias remains positive.
A breakout above 75,000 – 75,600 may extend the rally toward 76,000+.
A breakdown below 73,800 could drag it to 73,200 – 72,700.

Nifty Auto Sector : A possible talk of the Town.The much talked sector of the Indian stock market is Automobile sector after the government slashed the GST rate from 28% to 18% for small cars and trimming effective tax on large engine SUVs.
Major gainer from the GST rate cuts were the companies dealing in passenger vehicles i.e. 4-wheeler & 2-wheeler.
1. Impact of rate cuts on Passenger Vehicles (2-wheelers)
a. Lower Price : India is a price sensitive market and the price cut will significantly boost the volumes as the entry level bikes and scooters will become affordable, a potential boost to the rural demand after a good monsoon this year.
b. Stock Makret reaction : HeroMoto Corp, Bajaj Auto and TVS Motors are the major beneficial of the GST reform. Analysts project mid to high sales growth in the 2-wheeler companies over the coming quarters as the sector will recover from the sluggish growth due to high inflation rate post-COVID .
c. Margin Expansion : Companies may pass most of the benefits to the consumers but could allow retention of a portion of the benefits, leading to improved Operating margins. Both demand boost and margin gains can be seen in premium models like Bajaj Pulsar, TVS Apache, Royal Enfield (Eicher Motors).
d. Impact on EV : EV scooters (Ola Electric, Ather, TVS iQube, Bajaj Chetak) already benefit from FAME-II subsidies. Now, with ICE two-wheelers getting cheaper, EV makers might face tighter price competition, but overall demand expansion will grow the entire category.
2. Impact of rate cuts on Passenger Vehicles (4-wheelers)
a. Price reduction fuels demand : GST cut on small cars, SUVs and large cars will reduce effective rate from 50%+ to around 40% making cars more affordable across segments, stimulating demand from middle class families as well as premium buyers.
b. Passenger Vehicles Boost : Maruti suzuki (small cars leader) is the biggest beneficiary as price sensitive buyers will return to showrooms. While M&M and Tata motors benefits from the SUVs, which remain the fastest growing category.
c. EV Four-Wheelers : GST cut makes ICE vehicles cheaper, but EVs (already taxed at just 5% GST) remain far cheaper on tax. Beneficiaries: Tata Motors (Nexon EV, Tigor EV), M&M (XUV400 EV, BE 6E, XEV 9E), Maruti (upcoming EVs).
3. Stocks and their YTD Returns
a. Hero Moto Corp (29.23%) : Dealing in 2-wheelers, the stock has giving good return and remain a hot stock as it had acquired 32.5% in Euler Motors, signaling entry into Electric 3-wheeler segment.
b. Bajaj Auto (4.18%) : Stock has delivered a Net profit of Rs. 2049 Crore (up~ 5.8%) while declaring a dividend too. The company has faces a potential "zero month" in August for EVs due to rare-earth magnet supply issues from China. Some brokerages remain neutral suggesting the stock is fully valued in the short term.
c. TVS Motors (46.78%) : Companies EV Expansion and its iQube saw 44% YoY growth. Company plans launching new EV Scooters and EV 3-wheelers.
d. Eicher Motors (36.47%) : Royal enfield recorded its highest quarter sale (~2.8 lakh units) and crossed 1 Million sales in FY25. Though, company will not be relaxed by the GST rate cuts as the premium Bikes (over 350 cc) will now be taxed 40% up from ~31%. Stock is creating new ATH high on the prospect of the Commercial vehicles as reduction of auto components costs by 7-8%. Better margins, improved volumes and healthy ROI in coming quarter, reinforces its growth outlook.
e. Maruti Suzuki (37%) : Maruti is the leading small car producers and will be the leading beneficial of the GST rate cut on small cars. The entry in the EV will also improve the company's portfolio and the upcoming festive season seeing the discounted rate of the GST may help boost the sales.
f. Tata Motors (-6.55%) : Company's outlook is mixed to cautiously optimistic, growth drivers include EV adoption and strong demand on the upcoming car models. Most analysts project modest upside in single digits.
g. Mahindra & Mahindra (19%) : Most beneficial of the GST rate as uniform rate of 40% across all SUVs, 18% on the small cars, 5% GST on tractor segment. The company has demonstrated impressive EV segment growth. The favorable GST reform, pent-up demand and strong booking will help company in good quarter numbers.
Indian Auto sector can be seen as a good sector to invest in for the upcoming quarter considering GST rate cuts, festive season demand and EV adoption.

Bajaj Auto - BreakoutBajaj Auto has a trendline breakout and give good upside movement.
Good to buy now at cmp 8900 with the SL of 8560.
Strong upside move possible till 10080.
Above 10100, possible 10800-11500.
Bajaj Auto Ascending Triangle Breakout: ₹8,650 → ₹9,700🔎 Study: This analysis is based on the daily timeframe, focusing purely on price action and chart patterns—no indicators, no news.
📈 Pattern: Symmetrical triangle formed since May 2025.
🔹 Breakout Signal: Today’s daily candle closed decisively above the upper trendline, confirming the triangle breakout.
🔹 Entry:
• Buy around ₹8,420–8,450 once price sustains above the broken trendline.
🔹 Stop‑Loss:
• Place at ₹8,306 (today’s low) to invalidate the breakout on a downside close.
🔹 Profit Targets & Trailing:
Short‑Term: ₹8,650 → book partial & trail stop to ₹8,770
Mid‑Term: ₹8,770 → trail stop toward ₹9,000 as price clears each resistance
Long‑Term: ~₹9,700 (triangle height projection) over 2–3 months+
🔹 Risk Management:
• Expect minor pullbacks at interim resistances—healthy for continuation.
• Adjust position size and stop distances to match your risk tolerance.
⚠️ For educational discussion only; not financial advice.
🔍 Always do your own research and manage risk with proper stops.
👍 Boost if you find this useful, drop a 🚀 in the comments, and share your ideas below!

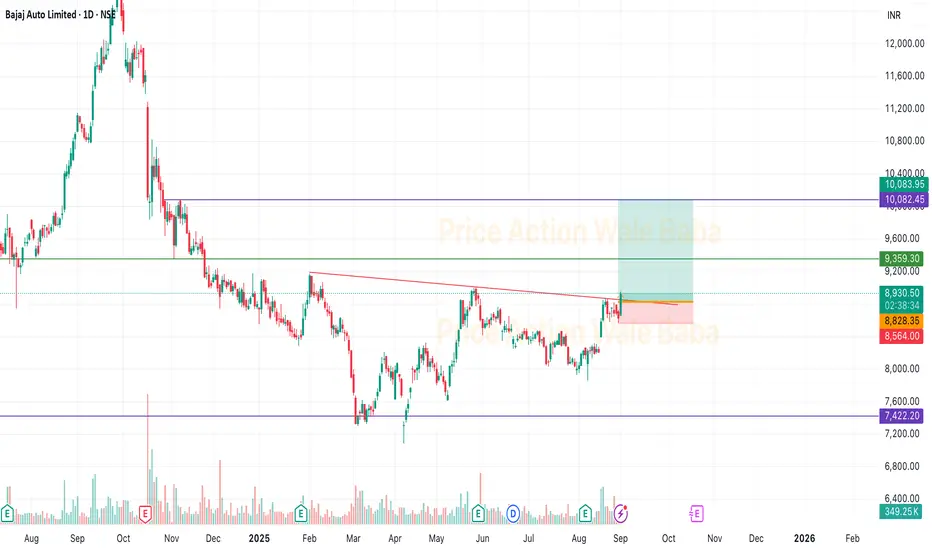
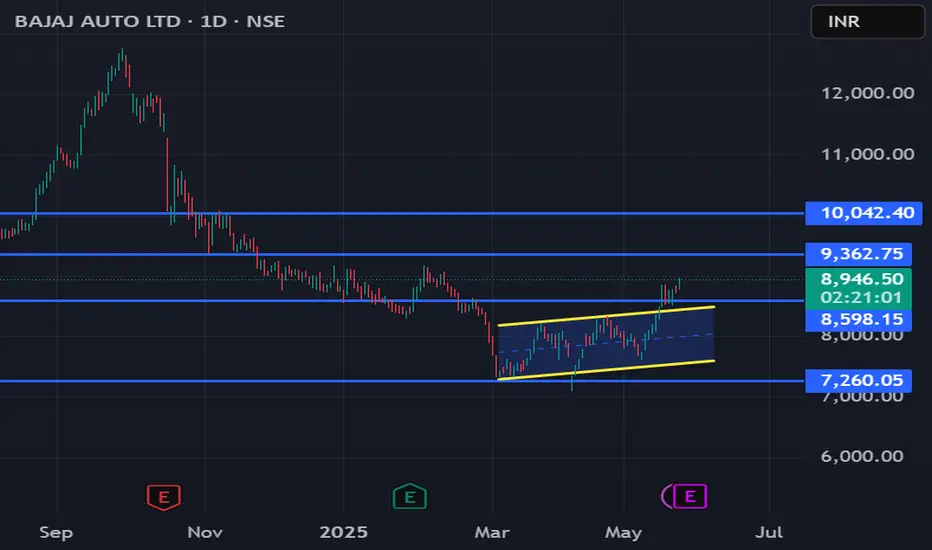
Bajaj Auto: Support Hold After Channel BreakoutDetails:
Asset: Bajaj Auto Ltd (BAJAJ-AUTO)
Breakout Level: 8600 (Support zone post breakout)
Potential Targets: 9360, 10000
Stop Loss: Below 8400
Timeframe: Medium-term (Daily timeframe)
Rationale: After a successful channel breakout, Bajaj Auto has retested and taken support at 8600. The price action suggests renewed buying interest and a continuation of the uptrend.
Market Analysis:
Technical Setup: Strong breakout followed by healthy consolidation and support test.
Sector Outlook: Auto sector is seeing robust demand and export tailwinds, benefiting key players like Bajaj Auto.
Risk Management:
Stop loss placed below 8400 to limit downside in case of failed support.
Timeframe:
Medium-term rally likely toward 9360 and eventually 10000.
Risk-Reward Ratio:
Favorable, with clear support and defined targets.
Look for volume confirmation and bullish candles above 8700 for strong momentum continuation.
Bajaj Auto: Bought at CMPCMP: 8003
Bajaj_auto is approaching for buying zone again.
Taking early entry at this point with SL at nearest low i.e. below 7735
The targets are the same, with a small update. The first target will be the earlier entry point, 8151, and so on.
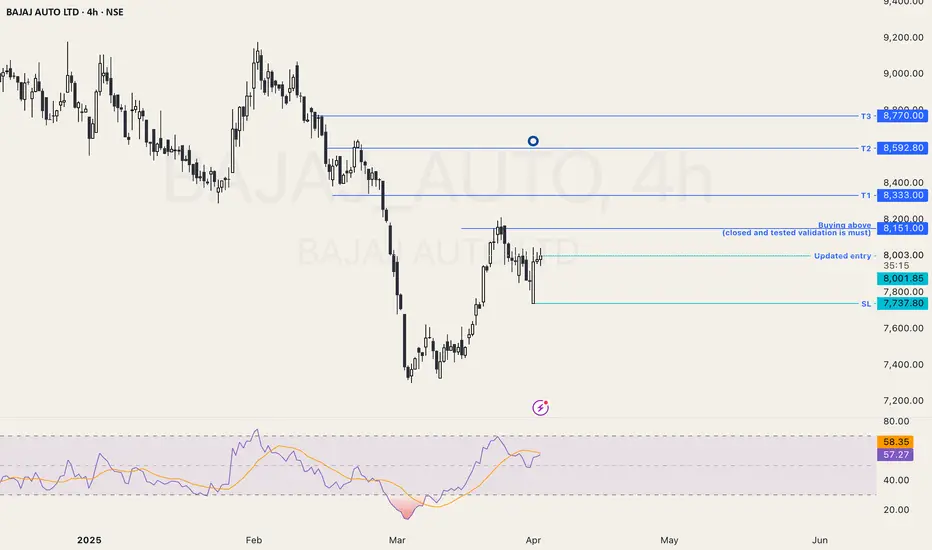
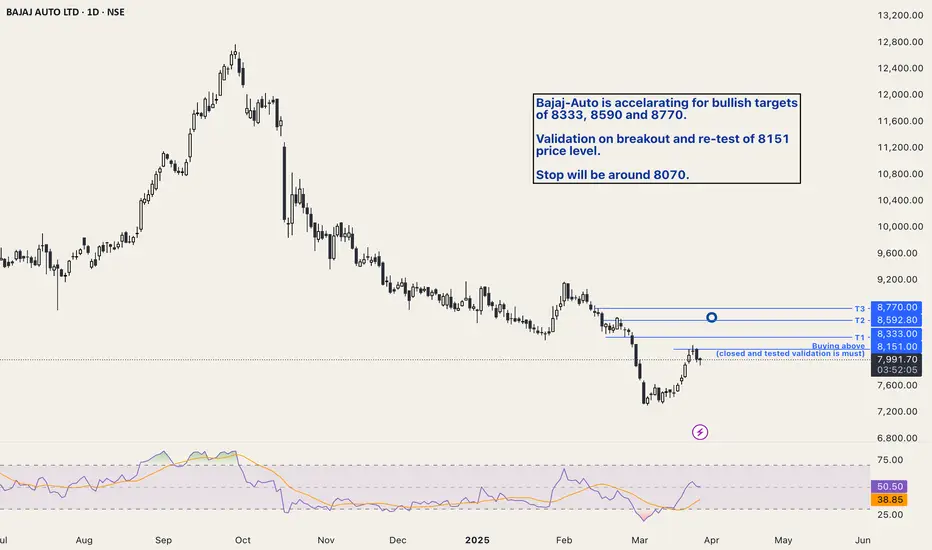
Bajaj-Auto bullish insightBajaj-Auto is accelerating for bullish targets
of 8333, 8590 and 8770.
Validation on breakout and re-test of 8151
price level.
The stop will be around 8070.
Bajaj Auto Technical Chart - Monthly TimeframeBajaj Auto Limited is an Indian multinational automotive manufacturing company that is renowned for producing motorcycles, scooters, and auto rickshaws. Here are some chart about Bajaj Auto:

Bajaj Auto Ltd.: Descending Wedge - Breakout or Breakdown?Bajaj Auto Ltd. is currently trading within a descending wedge pattern, indicating potential consolidation or a breakout scenario. Here’s the technical breakdown:
Key Observations
Descending Wedge:
The price is narrowing, with lower highs and lows, signaling reduced selling momentum.
Support Zone:
₹8,800–₹8,900 serves as a strong support level. A breakdown below this could lead to further downside.
Resistance Levels:
₹9,262.90: Immediate resistance.
₹9,642.45 and ₹9,995.55: Higher levels to watch in case of a breakout.
Trade Outlook
Bullish View:
A breakout above the wedge’s upper trendline signals upward momentum, targeting ₹9,262 and beyond.
Bearish View:
A breakdown below ₹8,800 could push the price to ₹8,600 or ₹8,400.

TataMotors | Bullish from here ⭕️ Swing Trading opportunity: Price Action Analysis Alert !!!⭕️
💡FNO Stocks Trading📉📈📊
✅Check out my TradingView profile to see how we analyze charts and execute trades.
✅We can't conduct a thorough analysis in such a short span of time. We need to review it, post our findings, and then take action.
🙋♀️🙋♂️If you have any questions about this stock, feel free to reach out to me.
📍📌Thank you for exploring our idea! We hope you found it valuable.
🙏FLLOW for more !
👍LIKE if useful !
✍️COMMENT Below your view !

Bajaj Auto - Bullish reversal possibleStock currently at strong support area as well as flip zone
Buying range 9800-10000
Sl Area - Below 9700
Target 1 - 11500
Target 2 - 12000
Target 3 - 12700
Not a recommendation - For study purpose only

Bajaj auto bullish from 10750 region Bajaj auto bullish from 10750 region may take support from 11250 region as per fibonaci levels drawn on the chart in coming days and can see breaking 12775 evel its all time high and next target will be 14320.
Its not an recomendation its my point of view for educational purpose only.
Take advice from your financial advisor before investing. I am not responsible for any profit or loss occured.
#bajajauto
