Bajaj finserv respecting resistance levelsbajfinserv has been returning from its resistance levels showing selling pressure
While nifty shows strentgh
bajfinserv show selling pressure
one can watch for downside movement
BAJAJFINSV

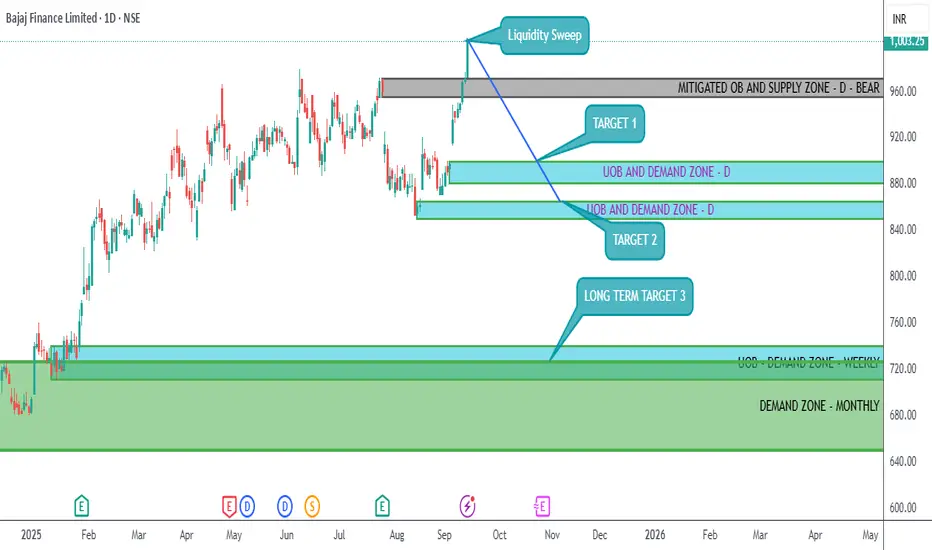
BAJFINANCE - BEARISH PREDICTIONAs BAJFINANCE is rising as of now above a 1000 mark, this is barely a liquidity sweep taking place and big institutions entering into sell on a larger scale. After this liquidity sweep is over, BAJFINANCE will start declining and a major decline is anticipated.
BAJFINANCE has several order blocks pending at weekly and monthly levels to be mitigated.
A short position is BAJFINANCE futures (maybe Nov) can be initiated on 15-Sep-2025 with a stop loss a little over closing of 12-Sep-2025 high.
TARGETS ARE GIVEN IN THE CHART.
📉 THIS CHANNEL IS ONLY FOR EDUCATIONAL PURPOSES.
Disclaimer: I am Not a SEBI registered analyst. I just share my positions to do paper trading and no where its a recommendation! Please do your own analysis before taking any trade.
STWP Breakout Watchlist – [14.09] | Key Stocks for Swing TradersSTWP Breakout Watchlist – | Key Stocks for Swing Traders 📊🚀
Markets are buzzing with momentum as multiple stocks show strong breakout signals backed by volumes and clean chart structures 🚀. Today’s watchlist highlights finance heavyweights and defence leaders that are attracting trader attention with fresh swing setups. Let’s decode the key levels, supports, and resistances to track for the coming sessions 🔑.
________________________________________________________________________________
________________________________________________________________________________
BAJFINANCE – 1003.25 (3.41%)
📊 Technical Indicators Explained
Bajaj Finance has given a powerful breakout 🚀 as it clears a long consolidation zone with a strong bullish Marubozu candle backed by heavy volume. The stock posted volumes almost 2 times its 20-day average, reflecting active trading and stronger-than-usual participation. Elevated volumes like this often support the sustainability of the underlying trend.
The chart highlights multiple bullish signals — strong momentum, a 52-week breakout, RSI breakout ⚡ confirming strength, and a Bollinger Band squeeze-off 📊 hinting at fresh volatility expansion. With VWAP support and intraday swing confirmation, the setup looks robust.
As long as key supports at 981 / 959 / 947 are protected, the stock can eye resistances at 1015 / 1026 / 1048 and possibly move towards higher upside levels of 1062 and 1120 in the coming sessions, with a possible demand zone at 975.90 – 965.60.
Bajaj Finance recently touched a 52-week high, driven by strong trading volumes (as per MarketWatch).
The company has set an ambitious goal to grow its loan book to ₹10 lakh crore by FY29, while also working on internal succession planning for senior leadership roles (as per Economic Times).
________________________________________
📈 Investment Outlook & Conclusion
📈 Bullish Case – Momentum with volume support may extend gains towards resistances.
📉 Bearish Case – Breach below 970 can attract selling pressure.
⚡ Momentum Case – Well-aligned for short swing trades.
📅 Perspective – Short-term momentum positive; long-term depends on loan book growth and asset quality.
________________________________________
📊 STWP Trade Analysis – BAJFINANCE
Bajaj Finance has given a strong breakout with momentum and volume confirmation 🚀
👉 For me, my entry zone is around 1004.60, aligned with the breakout structure considering 946.70 as my stop loss.
👉 If the stock dips towards 975.90 – 965.60 (Pullback zone), I will see that as a conservative re-entry with tighter risk.
🔑 Key Levels I’m Watching
Invalidation Level: A sustained move below 945 will negate my bullish view.
My Levels (if momentum continues): 1048 → 1062 → 1120
This is my swing trading approach as long as supports hold and is not a buy/sell recommendation.
________________________________________________________________________________
________________________________________________________________________________
BDL – 1566.50 (▲ +5.73%)
📊 Technical Indicators Explained
Bharat Dynamics (BDL) has delivered a strong breakout candle 🔥 after a prolonged downtrend, backed by extremely high volume 🚀. BDL stood out with an impressive 3.7x surge in volumes over its 20-day average, showcasing aggressive market involvement. Such strong accumulation signals heightened attention from traders and investors, often aligned with significant moves.
The chart highlights multiple bullish signals — RSI breakout, Bullish Engulfing candle, Buy Today Sell Tomorrow (BTST) setup, VWAP support, and SuperTrend reversal confirmation. The BB squeeze-off 📊 indicates a fresh trending move is likely to unfold.
As long as supports at 1506 / 1446 / 1410 are protected, and with a demand zone between 1513 – 1470, the stock looks well positioned to sustain momentum. On the upside, resistances are placed at 1602 / 1637 / 1697, with Fibonacci-based higher levels stretching to 1734 → 1886 → 2041 and beyond.
________________________________________
📰 Recent Updates
Institutional interest in BDL is rising, with the HDFC Defence Fund increasing its stake in the company along with other defence stocks (Economic Times).
BDL has also been highlighted among defence counters that recently surged up to 19%, supported by a strong order book and export prospects (Mint).
________________________________________
📈 Investment Outlook & Conclusion
📈 Bullish Case – Strong breakout with heavy volumes may extend towards higher resistances.
📉 Bearish Case – Slip below 1479 can open downside risk.
⚡ Momentum Case – High-risk, high-reward setup for aggressive short-term swings.
📅 Perspective – Short-term breakout play; long-term outlook tied to defence orders and exports.
________________________________________
📊 STWP Trade Analysis – BDL
Bharat Dynamics has delivered a breakout with volume confirmation and multiple bullish signals 🚀
👉 For me, my entry zone is around 1577, aligned with the breakout structure with my stop being at 1422.60
👉 If the stock dips towards the 1513 – 1470 demand zone, I will treat it as a conservative re-entry with tighter risk.
🔑 Key Levels I’m Watching
Invalidation Level: Invalidation level of below 1422 will negate my bullish view.
My Levels (if momentum continues): 1602 → 1637 → 1697 → 1734 → 1886 → 2041
This is my swing trading approach as long as supports hold and is not a buy/sell recommendation.
________________________________________________________________________________
________________________________________________________________________________
BAJAJFINSV – 2081.50 (▲ +2.14%)
📊 Technical Indicators Explained
Bajaj Finserv (BAJAJFINSV) has given a breakout candle with volume confirmation 🔥 after a long consolidation phase.
The stock displays strong signals — possible breakout setup, bullish engulfing candle, RSI breakout ⚡, swing trade confirmation, and Bollinger Band breakout 📊. The stock is also supported by VWAP demand and a BB squeeze-off, indicating potential for fresh momentum expansion. BAJAJFINSV recorded volumes about 1.8 times its recent 20-day average, suggesting above-normal market activity. This indicates healthy interest and participation, though the intensity is moderate compared to high-volume breakouts.
With strong supports at 2047 / 2013 / 1992, the stock looks well-positioned to sustain its move. On the upside, resistances are placed at 2102 / 2122 / 2156, with higher Fibonacci levels seen at 2135 → 2217 → 2236 if momentum holds.
________________________________________
📰 Recent Updates
Bajaj Finserv has set a target to achieve carbon neutrality for Scope 1 & 2 emissions by 2032, following a decarbonisation study in FY25 (Times of India).
In Q1 FY26, the company reported a 30.4% YoY rise in consolidated net profit to ₹2,789 crore, with revenues growing by ~12–13% (Economic Times).
________________________________________
📈 Investment Outlook & Conclusion
📈 Bullish Case – Gradual momentum with volume support could lift towards resistances.
📉 Bearish Case – A fall below 2032 can trigger near-term weakness.
⚡ Momentum Case – Suitable for cautious swing setups.
📅 Perspective – Short-term bias positive; long-term backed by financial services expansion.
________________________________________
📊 STWP Trade Analysis – BAJAJFINSV
Bajaj Finserv has delivered a breakout candle with momentum and above-average volume 🚀
👉 For me, my entry zone is around 2089, aligned with the breakout structure and a stop loss level of 2024.95.
👉 If the stock dips towards the level of 2041, I will treat it as a conservative re-entry with tighter risk.
🔑 Key Levels I’m Watching
Invalidation Level: A sustained move below 2012 will negate my bullish view.
My Levels (if momentum continues): 2102 → 2122 → 2156 → 2135 → 2217 → 2236
This is my swing trading approach as long as supports hold and is not a buy/sell recommendation.
________________________________________________________________________________
________________________________________________________________________________
HAL – 4745.60 (▼ –3.59%)
📊 Technical Indicators Explained
Hindustan Aeronautics (HAL) has given a breakout candle with strong volume confirmation 🚀 after a corrective downtrend. HAL witnessed trading volumes nearly 2.6x higher than its 20-day average, reflecting strong participation in the stock. Such elevated volumes often highlight rising institutional or retail activity, adding credibility to the ongoing price momentum.
The stock shows powerful bullish signals — Bullish Marubozu candle, RSI breakout ⚡, Bullish Engulfing setup, VWAP support, backed by a SuperTrend reversal and Bollinger Band breakout 📊. The BB squeeze-off suggests a potential trending move is just beginning.
With supports at 4634 / 4523 / 4465, the stock looks cushioned for momentum continuation. On the upside, immediate resistances lie at 4803 / 4861 / 4972, with higher Fibonacci-based levels stretching towards 5074 → 5399 → 5723 if momentum sustains. There is a possible demand zone around 4634 – 4544.30
________________________________________
📰 Recent Updates
HAL has received its third GE-404 engine from the US for the LCA Tejas Mark-1A programme, with a fourth expected later this month (Economic Times).
The company also signed a technology transfer agreement with IN-SPACe, ISRO, and NSIL for the Small Satellite Launch Vehicle (Economic Times).
HAL’s HJT-36 trainer jet is being evaluated for conversion into a light-attack fighter aircraft, with basic weapon trials already completed (Navbharat Times).
________________________________________
📈 Investment Outlook & Conclusion
📈 Bullish Case – Strong momentum with volume support may push towards higher resistances.
📉 Bearish Case – A drop below 4576 can attract downside pressure.
⚡ Momentum Case – Aligned with momentum; good for short-term swings.
📅 Perspective – Short-term breakout play; long-term supported by defence growth.
________________________________________
📊 STWP Trade Analysis – HAL
Hindustan Aeronautics has delivered a breakout candle with strong volume and momentum 🚀
👉 For me, my entry zone is around 4750, aligned with the breakout setup and my stop loss level at 4425.35.
👉 If the stock dips towards the 4634 – 4544.30, I will consider it as a conservative re-entry with tighter risk.
🔑 Key Levels I’m Watching
Invalidation Level: A sustained move below 4425 will negate my bullish view.
My Levels (if momentum continues): 4803 → 4861 → 4972 → 5074 → 5399 → 5723
This is my swing trading approach as long as supports hold and is not a buy/sell recommendation.
________________________________________________________________________________
________________________________________________________________________________
⚠️ Disclaimer – Please Read Carefully
The information shared here is meant purely for learning and awareness. It is not a buy or sell recommendation and should not be taken as investment advice. I am not a SEBI-registered investment advisor, and all views expressed are based on personal study, chart patterns, and publicly available market data.
Trading — whether in stocks or options — carries risk. Markets can move unexpectedly, and losses can sometimes exceed the money you have invested. Past performance or past setups do not guarantee future results.
If you are a beginner, treat this as a guide to understand how the market works — practice on paper trades before risking real money. If you are experienced, always assess your own risk, position sizing, and strategy suitability before entering trades.
Consult a SEBI-registered financial advisor before making any real trading decision. By engaging with this content, you acknowledge full responsibility for your trades and investments.
💬 Found this useful?
🔼 Give this post a Boost to help more traders discover clean, structured learning.
✍️ Drop your thoughts, questions, or setups in the comments — let’s grow together!
🔁 Share with fellow traders and beginners to spread awareness.
👉 “If you liked this breakdown, follow for more clean, structured setups with discipline at the core.”
🚀 Stay Calm. Stay Clean. Trade With Patience.
Trade Smart | Learn Zones | Be Self-Reliant 📊
BAJAJ FINSERV Swing Trade ( 1:3 RR )If Nifty holds current levels ie. 25000, then Bajaj Finserv will continue its sideways-uptrend.
Sellers have recently got trapped by the buyers in the buying zone which can fuel next up-move.
With 1:3 RR, trade setup is simple and looks good if overall market is not bearish.
Thanks and let me know in comments if you have any questions.
Follow for more such simple swing trade setups.

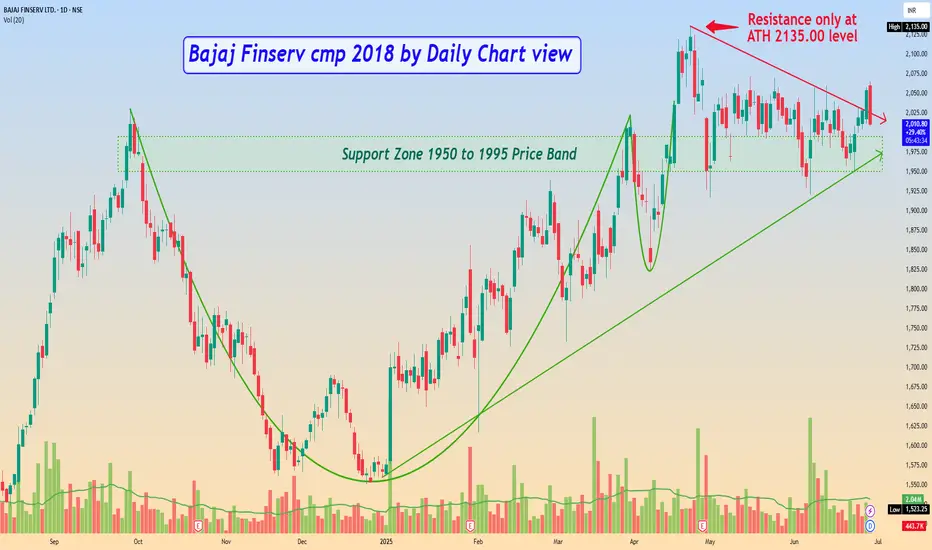
Bajaj Finserv cmp 2018 by Daily Chart viewBajaj Finserv cmp 2018 by Daily Chart view
- Support Zone 1950 to 1995 Price Band
- Resistance only at the ATH 2135.00 level
- Falling Resistance Trendline Breakout seems sustained
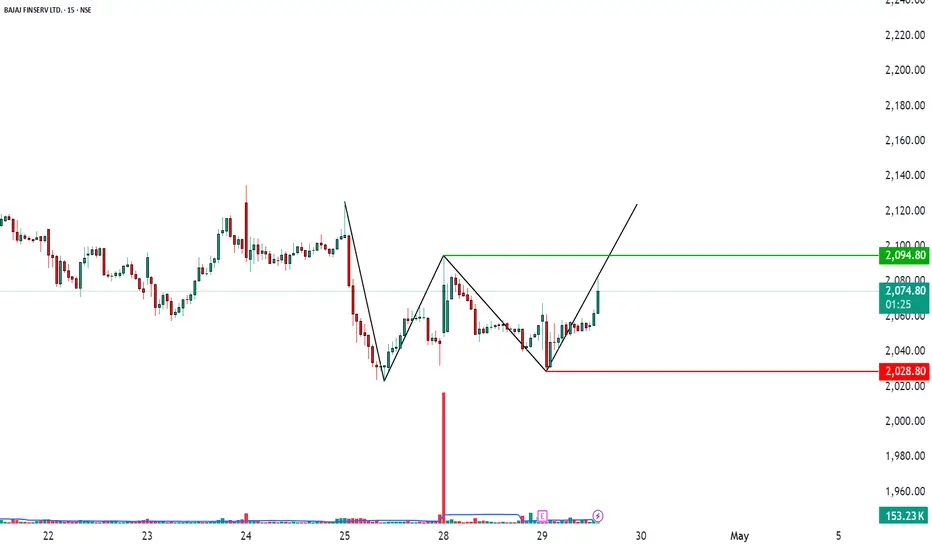
W Pattern Breakout Setup on 15-Min Chart📊 Script: BAJAJ FINSERV LTD. (NSE)
⏱️ Timeframe: 15-Minutes
📌 Chart Pattern: W-Pattern Formation
A potential bullish W-pattern is forming on the 15-minute chart of Bajaj Finserv. The price is consolidating near the neckline, indicating a possible breakout move in the upcoming sessions.
Key Levels:
✅ Breakout Resistance: 2,094.80
⚠️ Support Zone: 2,028.80
💼 Current Price: 2,063.70
If the price sustains above 2,094.80 with volume confirmation, it could trigger a short-term upward rally. The structure shows healthy consolidation and buying interest around support, which adds strength to this setup.
Trade Plan (For Educational Purposes):
📈 Entry: On breakout above 2,095 with strong volume
🎯 Target: ~100–150 points above breakout
🛑 Stop Loss: Below 2,028 (on a candle close basis)
Caution: Results are due so watch for possible reversal below 2028
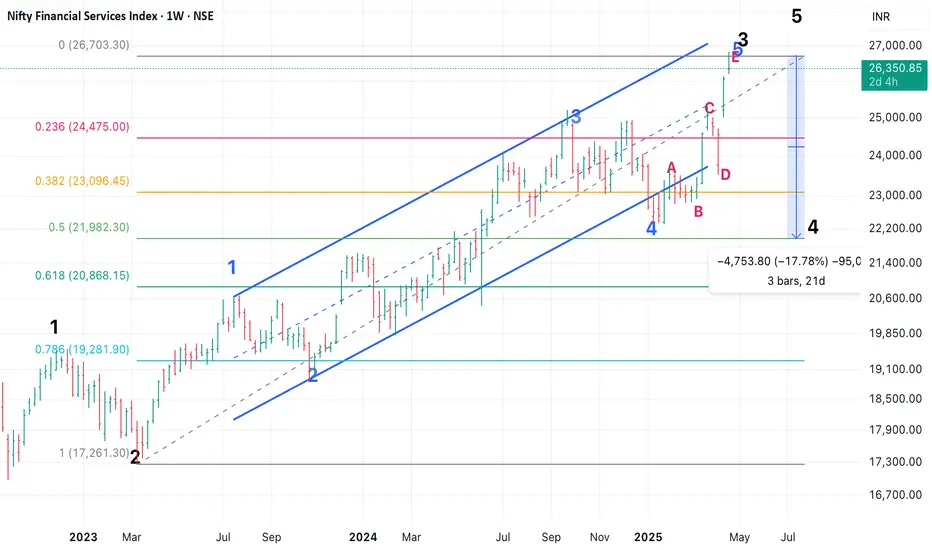
Nifty Financial Services - EW Analysis - Good RR ShortNifty Financial Services showed resilience in the entire fall and led the way up in recovery as it had a 5 of 3 up (from March 23 lows) pending, which got done in Nifty and most other indices in Dec 2023.
Now it has completed that 4 and should lead on the way down. Expecting at least a 14% correction in index till 23150 (38.2% retracement). Next target will be 22020 (50% retracement).
My bet is on 50% retracement, as Bajaj Twins and HDFC Bank and ICICI Bank have completed a corrective bounce and should test/ break recent lows.
Bajaj Twins have much larger correction possibility. Will share in other posts.
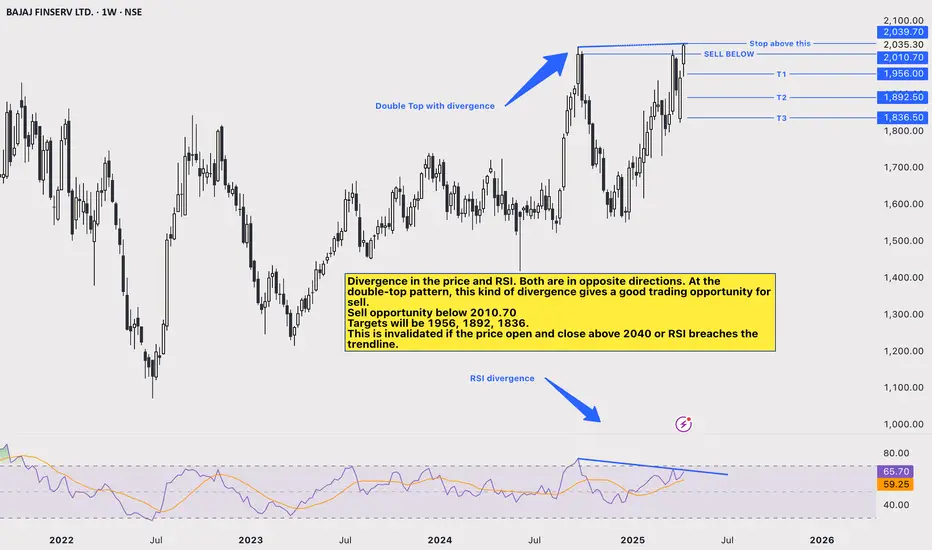
Bajajfinserv Double Top: Bearish Divergence in the price and RSI. Both are in opposite directions. At the double-top pattern, this kind of divergence gives a good trading opportunity to sell.
Sell opportunity below 2010.70
Targets will be 1956, 1892, 1836.
Stop loss is a few points above high at around 2042-45
This is invalidated if the price opens and closes above 2040 or RSI breaches the trendline.
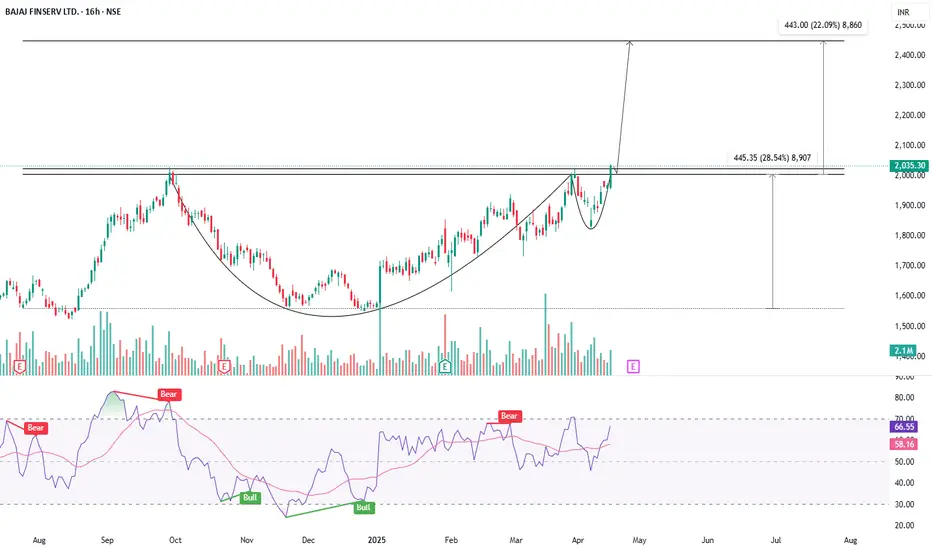
CUP & HANDLE ON THE CHART - IS BAJAJ FINSERV READY FOR LIFTOFF?Symbol - BAJAJFINSV
Bajaj Finserv Ltd. is a leading Indian financial services company engaged in insurance, lending, asset management, and wealth advisory. It operates through its subsidiaries like Bajaj Finance and Bajaj Allianz, making it a major player in the sector. The company is classified as a Systemically Important Non-Deposit taking NBFC.
Bajaj Finserv has recently shown a strong bullish breakout after forming a cup and handle pattern on the larger TF charts - A widely recognized bullish continuation setup. The breakout has occurred with notable volume, lending credibility to the move and signaling the potential for a sustained uptrend.
The stock is currently trading just above its breakout point, and a retest of the breakout zone 1980-2000 is possible. This area now acts as a strong support and provides an attractive entry opportunity for long positions.
Based on the technical pattern, the medium-term target for the move is projected at around 2450, implying an upside of nearly 22% from current levels. The pattern’s depth and the strength of the breakout support this target.
For risk management, a stop loss around 1800 is suggested, just below the handle's base, providing a good risk-to-reward setup.
The formation and breakout from the cup and handle pattern on a higher time frame adds strong bullish conviction to Bajaj Finserv’s chart. For investors looking to ride a medium-term trend with favorable risk-reward dynamics, this may be an opportune moment to enter or accumulate.
Disclaimer: The information provided here should not be construed as a buy or sell recommendation. It reflects my personal analysis and my trading position. Please consider this trading idea for educational purposes only. Thank you!
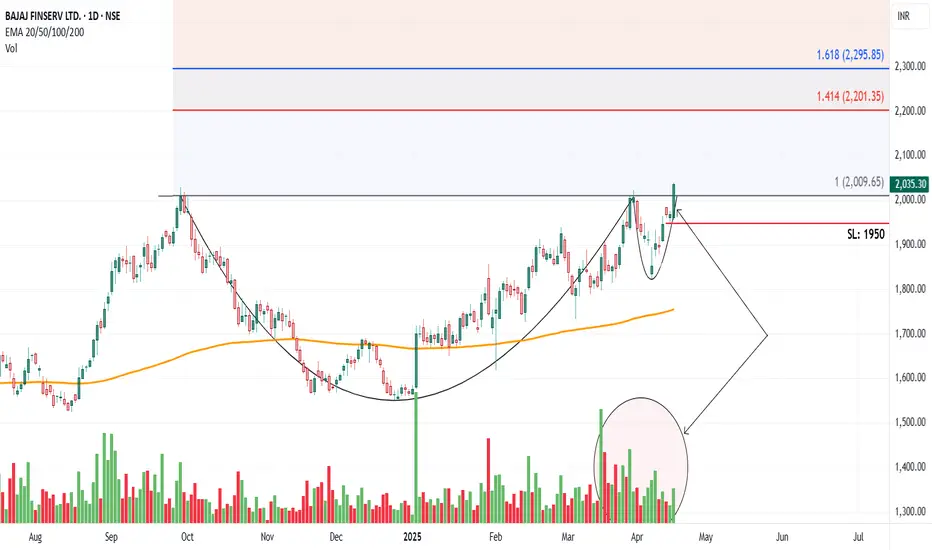
Cup and handleChart -> Bajaj Finserv Daily
Cup and handle breakout with volume buildup.
CMP: 2035
Good Range to Buy: 1980 to 2040
Targets: 2200, 2300
SL: 1950 Daily Close
Disclaimer: This is for educational purposes only, not any recommendations to buy or sell. As I am not SEBI registered, please consult your financial advisor before taking any action.
Double-TOP: Bearish for BajajfinservStop above 1962-65
Selling below 1938
Targets: 1887, 1831.50 and 1775 as T1, T2 and T3 respectively.
CMP: 1946.30
Trade based on double top rejection.

Bajaj Finserv in a bullish trend; Watch and trade?Bajaj Finserv has been in a good trend even when overall market remained negative, the stock has been trading around the recent highs.
There has been a Break out of the resistance zone but the market has formed a Tweezer top after the break out on the weekly charts.
If there is trend reversal of the indices, high chance of it forming new high while be there.
YTD the stock has posted 17% positive returns while the markets are down by the approximately the same percentage.
Major Resistance levels :-1860-19410
Possible Target levels (as per fibonacci levels) :- 2304, 2771
This can be the stock of the year. 20-40% return can be captured as per the holding capacity. Keep strict SL
Wait for the price action and trade as per the trading plan/setup.

BAJAJFINSV Chart indicates bullishness!#BAJAJFINSV NSE:BAJAJFINSV
1. Stock came out of its 200 SMA
2. Tested 200 SMA quite a few time and is holding above
3. Seems like a Cup, waiting for a handle to form
4. Market Stance is weak, hence long position to be avoided

Bajaj Finance will be the key Stock in Upcoming Recession In the Recession conditions of overall global market most of popular stocks getting dump while bajaj finance is pumping and showing a great potential for further pump.

Chart Analysis for Bajaj Finserv Ltd. (Weekly Timeframe)The stock is forming a bullish triangle pattern, a classic continuation pattern signaling potential upside. The price is respecting the ascending trendline, showing strong support near ₹1,700 levels, while the upper resistance line has been tested multiple times. This signifies increasing buyer strength.
Key Levels to Watch:
• Support: ₹1,698
• Resistance (Breakout Level): ₹2,050
• Target Price (Post Breakout): ₹2,336 (derived from the triangle’s height projection).
• Stop Loss: ₹1,515 (below the trendline support).
Short-Term Long Trade Setup
• Entry: Around ₹1,700, once the price shows bullish confirmation (e.g., reversal candlestick patterns or high volume).
• Target: ₹2,050 (short-term) and ₹2,336 (medium-term).
• Stop Loss: ₹1,515 to manage risk effectively.
Market Sentiment:
The stock shows a bullish structure, supported by prior consolidation and breakout potential. Patience is key for confirming a breakout above ₹2,050 before expecting the measured move towards ₹2,336.
DISCLAIMER- Please do your own research before investing in the market. This is for educational purposes only

BAJAJ FINSERV LTD - LARGECAP STOCK FOR LONG TERMCan Enter at 1515
if again falls then you need to average at 1210 level
Target - 2030,2400
Disclaimer - All information on this page is for educational purposes only,
we are not SEBI Registered, Please consult a SEBI registered financial advisor for your financial matters before investing And taking any decision. We are not responsible for any profit/loss you made.
Request your support and engagement by liking and commenting & follow to provide encouragement
HAPPY TRADING 👍

BAJAJFINSV Trading Above Fresh Weekly Demand ZoneBAJAJFINSV is currently trading at ₹1569.25, slightly above its demand zone between ₹1569 and ₹1523.25, established on 23rd August 2024. This fresh zone has not been tested yet, suggesting potential buying interest if the stock revisits this range. Investors might consider monitoring for a pullback to these levels, which could present a buying opportunity with strong support.
Disclaimer: This analysis is for informational purposes only and should not be considered as financial advice. Please conduct your own research or consult a financial advisor before making any investment or trading decisions.

BAJAJFINSV: Key Levels to Watch for Potential Downside MovementIn this analysis of BAJAJFINSV, we observe a potential bearish setup
Trigger Level: If the price breaks today's low, it may indicate further downside movement.
Stop Loss: Today's high serves as a prudent SL to manage risk.
Target: Monitor the mentioned levels or adjust based on price action dynamics.
⚠️ Disclaimer:
This analysis is for educational purposes only and is not a trading or investment recommendation. Please do your own research and consult a financial advisor before making any decisions.

BAJAJ FINSERV ATH BREAKOUTBajaj Finserv has been consolidating since 2021 and had formed a bullish pennant pattern , which it has already given breakout of , If The stock gives strong weekly closing above all time high levels with good volumes it can bring further momentum in stock
Do lookout for weekly closing above 1933 levels for possible target of ~ 2800 on positional basis

Bajaj Finance LtdAll important points are marked.
𝐃𝐢𝐬𝐜𝐥𝐚𝐢𝐦𝐞𝐫: 𝐈𝐧𝐯𝐞𝐬𝐭𝐦𝐞𝐧𝐭 𝐢𝐧 𝐬𝐞𝐜𝐮𝐫𝐢𝐭𝐢𝐞𝐬 𝐦𝐚𝐫𝐤𝐞𝐭 𝐚𝐫𝐞 𝐬𝐮𝐛𝐣𝐞𝐜𝐭 𝐭𝐨 𝐦𝐚𝐫𝐤𝐞𝐭 𝐫𝐢𝐬𝐤𝐬, 𝐫𝐞𝐚𝐝 𝐚𝐥𝐥 𝐭𝐡𝐞 𝐫𝐞𝐥𝐚𝐭𝐞𝐝 𝐝𝐨𝐜𝐮𝐦𝐞𝐧𝐭𝐬 𝐜𝐚𝐫𝐞𝐟𝐮𝐥𝐥𝐲 𝐛𝐞𝐟𝐨𝐫𝐞 𝐢𝐧𝐯𝐞𝐬𝐭𝐢𝐧𝐠. 𝐒𝐭𝐨𝐜𝐤𝐬 𝐬𝐮𝐠𝐠𝐞𝐬𝐭𝐞𝐝 𝐢𝐧 𝐭𝐡𝐢𝐬 𝐠𝐫𝐨𝐮𝐩 𝐚𝐫𝐞 𝐟𝐨𝐫 𝐞𝐝𝐮𝐜𝐚𝐭𝐢𝐨𝐧 𝐩𝐮𝐫𝐩𝐨𝐬𝐞. 𝐖𝐞 𝐝𝐨𝐧𝐭 𝐦𝐚𝐤𝐞 𝐚𝐧𝐲 𝐩𝐫𝐨𝐟𝐢𝐭𝐬 𝐟𝐫𝐨𝐦 𝐭𝐡𝐢𝐬 𝐫𝐞𝐜𝐨𝐦𝐦𝐞𝐧𝐝𝐚𝐭𝐢𝐨𝐧𝐬 𝐞𝐯𝐞𝐫𝐲𝐭𝐡𝐢𝐧𝐠 𝐬𝐡𝐚𝐫𝐞𝐝 𝐡𝐞𝐫𝐞 𝐚𝐫𝐞 𝐜𝐨𝐦𝐩𝐥𝐞𝐭𝐞𝐥𝐲 𝐨𝐟 𝐟𝐫𝐞𝐞 𝐨𝐟 𝐜𝐨𝐬𝐭.

Bajaj finserv break out.Bajaj finserv trading as per Elliott wave, It was given break out of triangle pattern at1700, As per chart Possible target would be 1836, 1932 and 2431 soon.

BAJAJFINSV - Breakout after 2 years BAJAJFINSV - Breakout on the weekly timeframe after 2 years.
The stock has been trading in a the same range for around 2 years and finally out of the zone and expected to finally give a good upside rally in the coming weeks, months.
Those who are looking for a medium - long term investment opportunity in a well established company, this is an ideal option.
Please do you OWN RESEARCH before making your buy/sell decision, these views are my personal views only.

Trendline Breakout in years
⭕ Swing Trading opportunity ! Weekly Chart Alert !!!⭕
======================================================
Technical Reasons to trade or Strategy applied :-
Bajaj Finserv Ltd
Good Breakout of Trendline in years
100 EMA is also supporting
Strong Price Action
Breakouts:- Breakouts indicate the potential for the price to start trending in the breakout direction. For example, a breakout to the upside from a chart pattern could indicate the price will start trending higher.
Support Zone :-A zone of support provides high probability areas where a reversal or continuation of the trend may occur.
#ThankU For Checking Out Our IDEA , We Hope U Liked IT 📌
🙏FOLLOW for more !
👍LIKE if useful !
✍️COMMENT Below your view !
