BAJFINANCE : AT A GOOD SWING
Timeframe: Daily
Current Spot Price: ~₹949
Trend Context: Primary uptrend intact | Ongoing corrective phase
🔍 Technical Structure Overview
Bajaj Finance has completed a corrective ABC structure, where:
Wave (a) initiated the correction,
Wave (b) retraced upward,
Wave (c) is nearing completion near a high-probability demand zone.
The ABC completion zone (₹934–₹945) coincides with:
Rising trendline support
Prior structure demand
Short-term mean reversion support (7-SMA)
This confluence increases the probability of a trend resumption bounce rather than a breakdown.
🟩 Swing Trade – Buying Strategy (Cash / Futures)
✅ Buy Zone (Accumulation Range):
₹945 – ₹935 (staggered buying preferred)
🎯 Swing Targets:
Target 1: ₹981
Target 2: ₹1,020
Extended Target: ₹1,066 (only if momentum sustains)
🛑 Stop Loss (Strict):
₹903 (Daily candle close basis)
Risk–reward remains favorable as long as price holds above the ABC completion zone and trendline support.
🟨 Options Trade Strategy – January Expiry
📌 Directional Bias: Moderately Bullish (Buy on Dip)
▶️ Call Buying Setup
Buy: 960 CE or 980 CE (January Expiry)
Ideal Entry: When spot sustains above ₹950–₹955 after pullback confirmation
🎯 Option Targets:
On move towards ₹981–₹1,020 in spot, expect healthy premium expansion
🛑 Option Stop Loss:
Spot-based SL: Hourly close below ₹931
OR 40–45% premium SL, whichever is hit earlier
Avoid aggressive OTM calls; prefer ATM or slightly ITM strikes for better theta and delta balance.
⚠️ Risk Management Notes
If price fails to hold ₹931 on an hourly closing basis, the bullish structure weakens.
A daily close below ₹903 invalidates the swing setup and may open deeper correction.
Position sizing should be conservative due to January expiry volatility.
📌 Summary View
Bias: Buy on dips near demand
Structure: ABC correction nearing completion
Edge: Trendline + demand zone confluence
Best Approach: Staggered swing buying + disciplined option positioning
⚠️ Disclaimer
This analysis is for educational purposes only. I am not a SEBI-registered analyst. Traders should manage risk responsibly and consult their financial advisor before taking positions.
BAJFINANCE

Bajaj Finance Limited- Breakout Setup, Move is ON...#BAJFINANCE trading above Resistance of 1004.50
Next Resistance is at 1182
Support is at 851
Here is previous chart:
Chart is self explanatory. Levels of breakout, possible up-moves (where stock may find resistances) and support (close below which, setup will be invalidated) are clearly defined.
Disclaimer: This is for demonstration and educational purpose only. This is not buying or selling recommendations. I am not SEBI registered. Please consult your financial advisor before taking any trade.

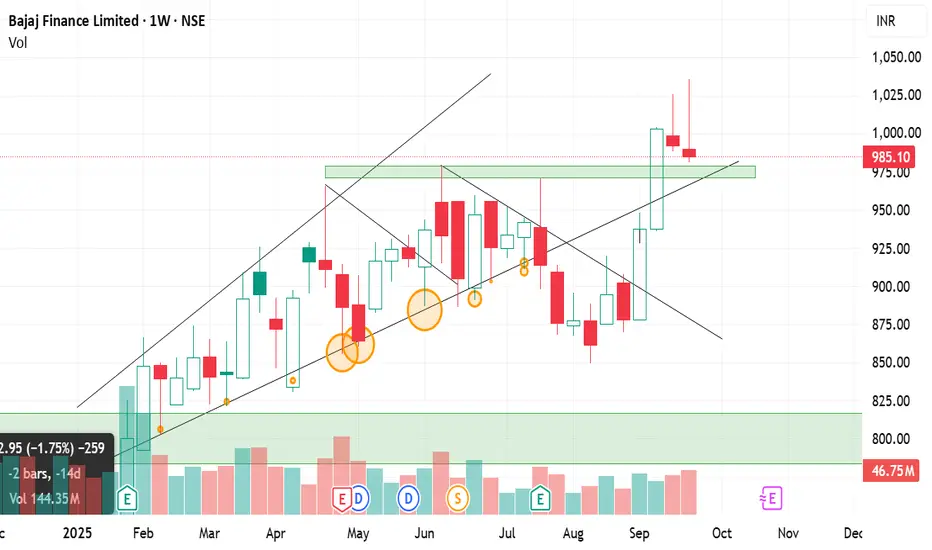
Bajaj Finance: Breakout, Retest & What’s Next?Bajaj Finance has been in focus ever since it broke its long-term resistance zone of ₹870–₹880 on 12th September 2025. This breakout was significant because the stock had been struggling to cross this level for a long time. Once it crossed, the stock quickly rallied and touched a high of ₹1036 🚀.
But the story has taken an interesting turn in the last two weeks. Let’s break it down in detail:
✨ 1. Weekly Chart View (Bigger Picture)
A shooting star candle formed last week. This is a bearish reversal pattern that occurs when the price moves higher but closes near the lows, showing that sellers took control.
This week, once again, a second shooting star appeared, and what’s more important is that it closed lower than last week’s close.
This back-to-back formation is a strong sign that buyers are losing momentum and sellers are active at higher levels.
📅 2. Daily Chart View (Short-Term Action)
After the breakout above ₹870–₹880, the stock pulled back and is now retesting this breakout zone.
This level is crucial because:
It is a classic breakout-retest scenario.
The same zone also coincides with a trendline support, adding strength to this level.
If the price bounces from this zone, it will confirm the breakout as valid and can lead to another leg up.
📌 3. Key Levels to Watch
Strong Support: ₹870–₹880 (breakout + trendline support).
Upside Potential: If the stock holds above this zone, it can retest ₹1000+ levels in the short-to-medium term.
Downside Risk: If the stock decisively breaks below ₹870–₹880, then the structure weakens, and the stock can slip towards ₹900 or even lower.
⚖️ 4. Market Sentiment & Interpretation
Two weekly shooting stars show weakness and profit-booking at higher levels.
But since the stock is still above the breakout zone, bulls still have a chance to defend the trend.
The coming sessions are critical — holding above 870–880 means bulls are in control, but if broken, sellers will dominate.
👉 Summary
🔻 Weakness spotted: Two weekly shooting stars confirm selling pressure.
🛡️ Support zone (₹870–₹880): This is the line in the sand for bulls.
⚠️ If broken: A medium-term fall toward ₹900 (or lower) is likely.
🚀 If defended: The stock can bounce and resume its upward journey, possibly retesting ₹1000–₹1036.
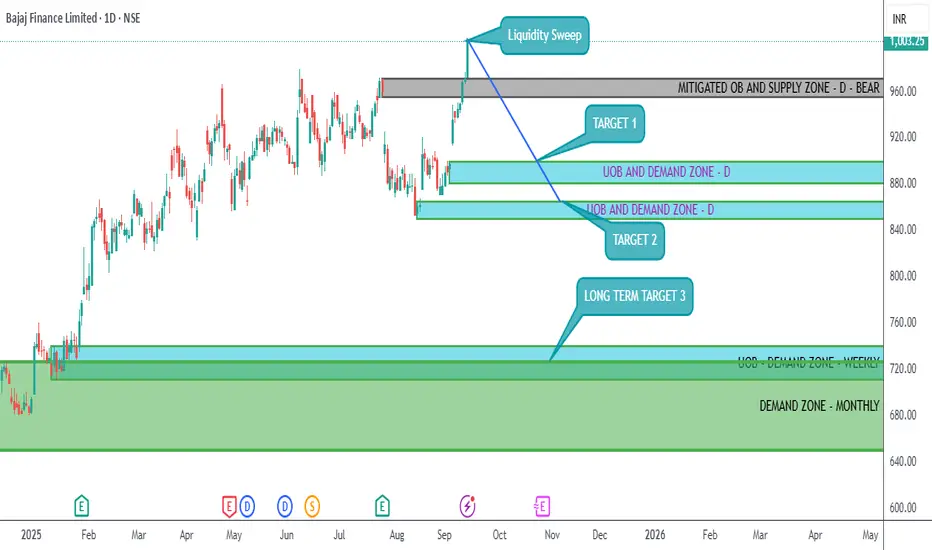
BAJFINANCE - BEARISH PREDICTIONAs BAJFINANCE is rising as of now above a 1000 mark, this is barely a liquidity sweep taking place and big institutions entering into sell on a larger scale. After this liquidity sweep is over, BAJFINANCE will start declining and a major decline is anticipated.
BAJFINANCE has several order blocks pending at weekly and monthly levels to be mitigated.
A short position is BAJFINANCE futures (maybe Nov) can be initiated on 15-Sep-2025 with a stop loss a little over closing of 12-Sep-2025 high.
TARGETS ARE GIVEN IN THE CHART.
📉 THIS CHANNEL IS ONLY FOR EDUCATIONAL PURPOSES.
Disclaimer: I am Not a SEBI registered analyst. I just share my positions to do paper trading and no where its a recommendation! Please do your own analysis before taking any trade.
STWP Breakout Watchlist – [14.09] | Key Stocks for Swing TradersSTWP Breakout Watchlist – | Key Stocks for Swing Traders 📊🚀
Markets are buzzing with momentum as multiple stocks show strong breakout signals backed by volumes and clean chart structures 🚀. Today’s watchlist highlights finance heavyweights and defence leaders that are attracting trader attention with fresh swing setups. Let’s decode the key levels, supports, and resistances to track for the coming sessions 🔑.
________________________________________________________________________________
________________________________________________________________________________
BAJFINANCE – 1003.25 (3.41%)
📊 Technical Indicators Explained
Bajaj Finance has given a powerful breakout 🚀 as it clears a long consolidation zone with a strong bullish Marubozu candle backed by heavy volume. The stock posted volumes almost 2 times its 20-day average, reflecting active trading and stronger-than-usual participation. Elevated volumes like this often support the sustainability of the underlying trend.
The chart highlights multiple bullish signals — strong momentum, a 52-week breakout, RSI breakout ⚡ confirming strength, and a Bollinger Band squeeze-off 📊 hinting at fresh volatility expansion. With VWAP support and intraday swing confirmation, the setup looks robust.
As long as key supports at 981 / 959 / 947 are protected, the stock can eye resistances at 1015 / 1026 / 1048 and possibly move towards higher upside levels of 1062 and 1120 in the coming sessions, with a possible demand zone at 975.90 – 965.60.
Bajaj Finance recently touched a 52-week high, driven by strong trading volumes (as per MarketWatch).
The company has set an ambitious goal to grow its loan book to ₹10 lakh crore by FY29, while also working on internal succession planning for senior leadership roles (as per Economic Times).
________________________________________
📈 Investment Outlook & Conclusion
📈 Bullish Case – Momentum with volume support may extend gains towards resistances.
📉 Bearish Case – Breach below 970 can attract selling pressure.
⚡ Momentum Case – Well-aligned for short swing trades.
📅 Perspective – Short-term momentum positive; long-term depends on loan book growth and asset quality.
________________________________________
📊 STWP Trade Analysis – BAJFINANCE
Bajaj Finance has given a strong breakout with momentum and volume confirmation 🚀
👉 For me, my entry zone is around 1004.60, aligned with the breakout structure considering 946.70 as my stop loss.
👉 If the stock dips towards 975.90 – 965.60 (Pullback zone), I will see that as a conservative re-entry with tighter risk.
🔑 Key Levels I’m Watching
Invalidation Level: A sustained move below 945 will negate my bullish view.
My Levels (if momentum continues): 1048 → 1062 → 1120
This is my swing trading approach as long as supports hold and is not a buy/sell recommendation.
________________________________________________________________________________
________________________________________________________________________________
BDL – 1566.50 (▲ +5.73%)
📊 Technical Indicators Explained
Bharat Dynamics (BDL) has delivered a strong breakout candle 🔥 after a prolonged downtrend, backed by extremely high volume 🚀. BDL stood out with an impressive 3.7x surge in volumes over its 20-day average, showcasing aggressive market involvement. Such strong accumulation signals heightened attention from traders and investors, often aligned with significant moves.
The chart highlights multiple bullish signals — RSI breakout, Bullish Engulfing candle, Buy Today Sell Tomorrow (BTST) setup, VWAP support, and SuperTrend reversal confirmation. The BB squeeze-off 📊 indicates a fresh trending move is likely to unfold.
As long as supports at 1506 / 1446 / 1410 are protected, and with a demand zone between 1513 – 1470, the stock looks well positioned to sustain momentum. On the upside, resistances are placed at 1602 / 1637 / 1697, with Fibonacci-based higher levels stretching to 1734 → 1886 → 2041 and beyond.
________________________________________
📰 Recent Updates
Institutional interest in BDL is rising, with the HDFC Defence Fund increasing its stake in the company along with other defence stocks (Economic Times).
BDL has also been highlighted among defence counters that recently surged up to 19%, supported by a strong order book and export prospects (Mint).
________________________________________
📈 Investment Outlook & Conclusion
📈 Bullish Case – Strong breakout with heavy volumes may extend towards higher resistances.
📉 Bearish Case – Slip below 1479 can open downside risk.
⚡ Momentum Case – High-risk, high-reward setup for aggressive short-term swings.
📅 Perspective – Short-term breakout play; long-term outlook tied to defence orders and exports.
________________________________________
📊 STWP Trade Analysis – BDL
Bharat Dynamics has delivered a breakout with volume confirmation and multiple bullish signals 🚀
👉 For me, my entry zone is around 1577, aligned with the breakout structure with my stop being at 1422.60
👉 If the stock dips towards the 1513 – 1470 demand zone, I will treat it as a conservative re-entry with tighter risk.
🔑 Key Levels I’m Watching
Invalidation Level: Invalidation level of below 1422 will negate my bullish view.
My Levels (if momentum continues): 1602 → 1637 → 1697 → 1734 → 1886 → 2041
This is my swing trading approach as long as supports hold and is not a buy/sell recommendation.
________________________________________________________________________________
________________________________________________________________________________
BAJAJFINSV – 2081.50 (▲ +2.14%)
📊 Technical Indicators Explained
Bajaj Finserv (BAJAJFINSV) has given a breakout candle with volume confirmation 🔥 after a long consolidation phase.
The stock displays strong signals — possible breakout setup, bullish engulfing candle, RSI breakout ⚡, swing trade confirmation, and Bollinger Band breakout 📊. The stock is also supported by VWAP demand and a BB squeeze-off, indicating potential for fresh momentum expansion. BAJAJFINSV recorded volumes about 1.8 times its recent 20-day average, suggesting above-normal market activity. This indicates healthy interest and participation, though the intensity is moderate compared to high-volume breakouts.
With strong supports at 2047 / 2013 / 1992, the stock looks well-positioned to sustain its move. On the upside, resistances are placed at 2102 / 2122 / 2156, with higher Fibonacci levels seen at 2135 → 2217 → 2236 if momentum holds.
________________________________________
📰 Recent Updates
Bajaj Finserv has set a target to achieve carbon neutrality for Scope 1 & 2 emissions by 2032, following a decarbonisation study in FY25 (Times of India).
In Q1 FY26, the company reported a 30.4% YoY rise in consolidated net profit to ₹2,789 crore, with revenues growing by ~12–13% (Economic Times).
________________________________________
📈 Investment Outlook & Conclusion
📈 Bullish Case – Gradual momentum with volume support could lift towards resistances.
📉 Bearish Case – A fall below 2032 can trigger near-term weakness.
⚡ Momentum Case – Suitable for cautious swing setups.
📅 Perspective – Short-term bias positive; long-term backed by financial services expansion.
________________________________________
📊 STWP Trade Analysis – BAJAJFINSV
Bajaj Finserv has delivered a breakout candle with momentum and above-average volume 🚀
👉 For me, my entry zone is around 2089, aligned with the breakout structure and a stop loss level of 2024.95.
👉 If the stock dips towards the level of 2041, I will treat it as a conservative re-entry with tighter risk.
🔑 Key Levels I’m Watching
Invalidation Level: A sustained move below 2012 will negate my bullish view.
My Levels (if momentum continues): 2102 → 2122 → 2156 → 2135 → 2217 → 2236
This is my swing trading approach as long as supports hold and is not a buy/sell recommendation.
________________________________________________________________________________
________________________________________________________________________________
HAL – 4745.60 (▼ –3.59%)
📊 Technical Indicators Explained
Hindustan Aeronautics (HAL) has given a breakout candle with strong volume confirmation 🚀 after a corrective downtrend. HAL witnessed trading volumes nearly 2.6x higher than its 20-day average, reflecting strong participation in the stock. Such elevated volumes often highlight rising institutional or retail activity, adding credibility to the ongoing price momentum.
The stock shows powerful bullish signals — Bullish Marubozu candle, RSI breakout ⚡, Bullish Engulfing setup, VWAP support, backed by a SuperTrend reversal and Bollinger Band breakout 📊. The BB squeeze-off suggests a potential trending move is just beginning.
With supports at 4634 / 4523 / 4465, the stock looks cushioned for momentum continuation. On the upside, immediate resistances lie at 4803 / 4861 / 4972, with higher Fibonacci-based levels stretching towards 5074 → 5399 → 5723 if momentum sustains. There is a possible demand zone around 4634 – 4544.30
________________________________________
📰 Recent Updates
HAL has received its third GE-404 engine from the US for the LCA Tejas Mark-1A programme, with a fourth expected later this month (Economic Times).
The company also signed a technology transfer agreement with IN-SPACe, ISRO, and NSIL for the Small Satellite Launch Vehicle (Economic Times).
HAL’s HJT-36 trainer jet is being evaluated for conversion into a light-attack fighter aircraft, with basic weapon trials already completed (Navbharat Times).
________________________________________
📈 Investment Outlook & Conclusion
📈 Bullish Case – Strong momentum with volume support may push towards higher resistances.
📉 Bearish Case – A drop below 4576 can attract downside pressure.
⚡ Momentum Case – Aligned with momentum; good for short-term swings.
📅 Perspective – Short-term breakout play; long-term supported by defence growth.
________________________________________
📊 STWP Trade Analysis – HAL
Hindustan Aeronautics has delivered a breakout candle with strong volume and momentum 🚀
👉 For me, my entry zone is around 4750, aligned with the breakout setup and my stop loss level at 4425.35.
👉 If the stock dips towards the 4634 – 4544.30, I will consider it as a conservative re-entry with tighter risk.
🔑 Key Levels I’m Watching
Invalidation Level: A sustained move below 4425 will negate my bullish view.
My Levels (if momentum continues): 4803 → 4861 → 4972 → 5074 → 5399 → 5723
This is my swing trading approach as long as supports hold and is not a buy/sell recommendation.
________________________________________________________________________________
________________________________________________________________________________
⚠️ Disclaimer – Please Read Carefully
The information shared here is meant purely for learning and awareness. It is not a buy or sell recommendation and should not be taken as investment advice. I am not a SEBI-registered investment advisor, and all views expressed are based on personal study, chart patterns, and publicly available market data.
Trading — whether in stocks or options — carries risk. Markets can move unexpectedly, and losses can sometimes exceed the money you have invested. Past performance or past setups do not guarantee future results.
If you are a beginner, treat this as a guide to understand how the market works — practice on paper trades before risking real money. If you are experienced, always assess your own risk, position sizing, and strategy suitability before entering trades.
Consult a SEBI-registered financial advisor before making any real trading decision. By engaging with this content, you acknowledge full responsibility for your trades and investments.
💬 Found this useful?
🔼 Give this post a Boost to help more traders discover clean, structured learning.
✍️ Drop your thoughts, questions, or setups in the comments — let’s grow together!
🔁 Share with fellow traders and beginners to spread awareness.
👉 “If you liked this breakdown, follow for more clean, structured setups with discipline at the core.”
🚀 Stay Calm. Stay Clean. Trade With Patience.
Trade Smart | Learn Zones | Be Self-Reliant 📊
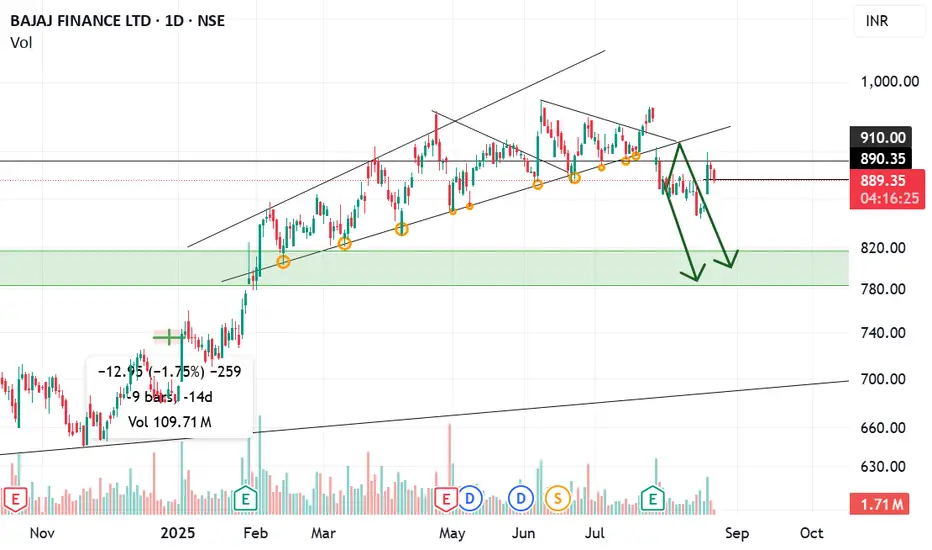
Chart Analysis – Bajaj Finance LtdThe stock was trading inside a rising channel for a long time but eventually broke down from it.
After the breakdown, a retest of the broken support trendline was observed, confirming weakness.
Currently, the price is struggling near the ₹890–₹900 zone, which is acting as a resistance.
The critical support lies around ₹850.
⚠️ If the stock closes below ₹850, it will confirm further bearish momentum.
The next support levels open up towards ₹820–₹800, which is also a strong demand zone (green highlighted area on chart).
📌 Summary:
Unless the stock reclaims and sustains above ₹900, the bias remains weak. A close below ₹850 can accelerate the fall toward ₹820–₹800.
Bajaj Finance - Seems to be on SupportCMP 853 on 12.08.25
In the last 15-20 days, the stock price has come down to 853 from 970. Present level may act as support again, as can be seen on the chart.
If it bounces back, it will form a Double bottom pattern.
Stochastic RSI is showing a reversal sign too.
Targets may be 885/915+.
If it sustains below 840-835 levels, the setup will go weak.
The risk-reward ratio is good at this point.
This illustration is for educational and sharing purposes; this should not be taken as a buying or selling recommendation.
All the best.

Bajaj Finance – Trendline BreakdownBajaj Finance has broken a key ascending trendline on the daily chart, with a minor retest underway. The price now trades below the 21 EMA (926.59), indicating short-term weakness. RSI stands at 38.31, showing bearish momentum with room for further downside. A significant volume spike confirms strong selling pressure. If the retest fails, the stock could drop toward the 790–830 support zone. This bearish setup remains valid unless the price reclaims the trendline and closes above the EMA. Traders should watch for rejection at the trendline to confirm further downside.

BAJFINANCE - HIDDEN BEARISH ACTIVITY REVEALEDwe are studying various assets according to our conditions and predfined criterias which shows recently a hidden bearish activity in a bullish momentum asset bajaj finance 9000CE, which may bring the asset down to 175 levels and a bearish setup for short up is seemingly building up.
We will observe this hidden bear, derivative bear activity which is significat as per our study parameters. lets observe how it behaves in future sessions. Stay tuned.
Post is just for educational purpose for our study and efficacy of parameters. Kindly trade at your own risk and capacity.

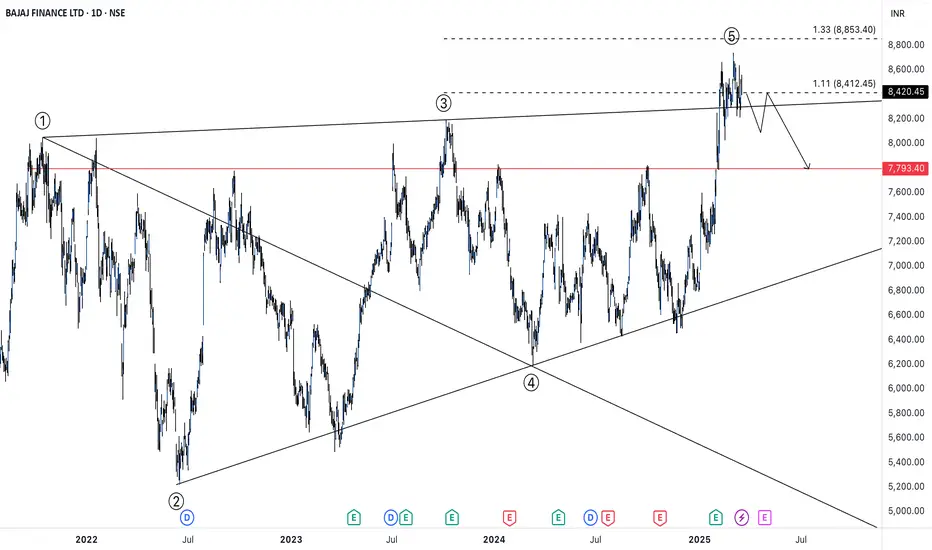
BAJAJ FINANCEIn this entire rally of NIFTY towards the downside since few months, BAJFIN has acted in a defensive way for the time being. But currently a Bearish Wolfe Wave pattern is emerging in the stock indicating that the stock can show a potential downside.
The target remains to be at 7793 once it trades below 8820. There are few reasons to justify the potenial downside.
1. Bearish Wolfe Wave Pattern
2. Exxagerated RSI Divergence pattern
3. Emerging Head and Shoulder pattern
Even though NIFTY is a very low and people hoping for a bottom out soon, the chances of the stock coming down may be fairly less. But who knows even if NIFTY falls by 200 points may be BAJFIN may turn out to be the biggest contributor for the day.
Its advisable to not go long on this stock and short only after confirmation(once it breaks below 8820) for the target of 7793. SL remains to be at 8650 on closing basis.
Chart and Anlysis
Adarsh Kumar Dey
Such a Strong Stock in this Weak Market. Views?Have a look at this chart!
Such a beautiful formation. Near 52W High.
What I really love is 20 SMA is acting as its support. Market is Weak else i wud hv attempted it.
Views?
Caution: No a recommendation!

BAJFINANCE - Ready To Bounce from LongTerm Support AreaThe chart shows Bajaj Finance Ltd. forming a 3-year long ascending triangle pattern, a bullish continuation setup.
Key observations:
1.Consistent higher lows indicate strong buyer support along the long-term uptrend line.
2.A bullish hammer candlestick suggests a potential reversal near the support level.
3.The stock has also formed a triple bottom near long term support making a confluence area.

BAJAJ FINANCE - SWING TRADE ON SHORT SIDESymbol - BAJFINANCE
BAJFINANCE is currently trading at 7800
I'm seeing a trading opportunity on sell side.
Shorting BAJFINANCE Futures at CMP 7800
I will be adding more position if 8000 comes & will hold with SL 8220
Targets I'm expecting are 7450 - 7225 & 7050
Disclaimer - Do not consider this as a buy/sell recommendation. I'm sharing my analysis & my trading position. You can track it for educational purposes. Thanks!

BUY BAJAJ FINANCE ABOVE 6600Buy Bajaj Finance above 6600 for the targets of 7000, 7100 and above until 6380 is intact on the downside.
To motivate us, Please like the idea If you agree with the analysis.
Happy Trading!
InvestPro India

BAJFINANCE Outlook...I used Trend following method and Fibonacci retracement tools to discover stock'schanges to break the previous high to find probable break keep watch and wait.
Ignore Gap down Cancel the plan
Analysis:
Starting Point: Mentioned on the chart
Ending Point: Mentioned on the chart
Disclaimer: This is for educational purposes only. Conduct your own research and consider your risk tolerance before trading.

BAJFIN READY FOR UPMOVEAfter the recent RSI divergence, BAJFIN is at a critical breakout point. This uptrend can be a 10-15% up move.
Best time to catch a bottom out.

Bajaj Finance Big BreakoutBajaj Finance Big Breakout
Buy At Cmp 8168
Add On Dips Till 7000
SL - 6780 ( Weekly Closing Basis )
Target - 11000+++
Time Frame - 1 Year

BAJFINANCE Looing Good NSE:BAJFINANCE Previously, BAJFINANCE made H&S patterns, broke the support, and fell.
now taking support from Yellow Zone and Trendline

04 Jan ’24 — Banks does the powerlifting for the reversal todayBankNifty Analysis - Stance Neutral ➡️
The powerlifting was done by BankNifty today. The Bajaj Finserv and Finance were on fire today and were propelling FinNifty to a higher variance than BankNifty earlier in the day. However, the close ensured the variance was less than 0.2%
4mts chart link
Honestly, we did not see this coming. The setup was perfect for a Bear run, the first hour of trade almost froze us so that we could not build onto expiry positions on Nifty. Since the stop loss was hit, we had to make multiple adjustments to stay in green. Was this a turn of events or a blip is something we are not completely sure of? Ideally, the bear run was just starting, and it would be sad if it ran out like this.
63mts chart link
It is prudent to draw a new support line at 47539, the level from where we got the inflection today. To reclaim bullishness, BankNifty has to re-enter the ascending channel. If that happens tomorrow then the level to beat is 48700 which would mean it will take out the ATH. Since we changed the stance to neutral from bearish, a sensible move would be to go sideways without breaking the support of 47539.

02 Jan ’24 — A Breakdown in Progress? 3 black crowsNifty Analysis - Stance: Neutral
Recap from yesterday: “The last candle is looking quite deep and has almost negated the progress of 3 days. If it was not related to any news/event, the outcomes match quite strongly for an interim top-like formation.”
4mts chart link - click here
The last 30mts action yesterday was not a blip, we got some continuity today. Nifty50 fell 199pts ~ 0.92% intraday to 21555 by 10.39 and then retraced 50% of that fall. The real impact was on BankNifty and not Nifty. Just like we often say, during trend reversals - BankNifty takes the lead and then Nifty50 follows. We did change the stance on BankNifty to bearish today (more on that in a while).
Even NiftyIT took some beating today, the positive contributors to Nifty50 were BAJFINANCE, RELIANCE, and ADANIPORTS. In fact, BAJFINANCE was the main reason FinNifty and BankNifty had a variance of 0.46% today.
63mts chart link - click here
We would like to maintain the stance on Nifty to neutral itself. The first target for a trend change will be the breach of the ascending channel top line approx 21530 levels. From a technical analysis perspective, we had the 3 black crows at 14.30 yesterday and the first 2 candles today. The last time we had a breakdown i.e. on 20th Dec, Nifty50 took support at the channel top line - so we must breach that now for extra confirmation.

Bajajfinance or BAJFINANCE Trade👑Royal Trade👑
BAJFINANCE IMPORTANT LEVEL
Dont buy any trade without stop loss
This is only level we upload new idea in morning 9.30
Buy when Market Break
The support or Resistance
and wait for the closing and
set stop loss at the
last opening of the candle.
NOTE
#We Are Not Promote Anything
#This channel Purpose to share market ideas.
Thanks for Watching🙏

BAJFINANCE BUY CAL OPTION TODAY 👑🤑👑Royal Trade👑
BAJFINANCE IMPORTANT LEVEL
We buy Call and my Target in VIDEO
Dont buy any trade without stop loss
This is only level we upload new idea in morning 9.30
Buy when Market Break
The support or Resistance
and wait for the closing and
set stop loss at the
last opening of the candle.
NOTE
#We Are Not Promote Anything
#This channel Purpose to share market ideas.
Thanks for Watching🙏

BAJFINANCE is showing reversalNSE:BAJFINANCE has shown some recovery and showing higher highs for the last few days. If it retraces back to 7k levels and starts up again then it could be a good journey till 7600.
